net section collapse and the reference stress, a simple method for estimating stress-strain fields in the vicinity of stress concentrations is proposed. The accuracy of the method is compared with elastic-plastic finite element analysis for several notch configurations with different loading conditions and in plane stress, plane strain and axisymmetric configurations.
1. INTRODUCTION
Stress concentration configurations such as fillets, holes, welds, grooves and keyholes cannot be avoided when designing structures or mechanical components. Therefore, estimation of stresses and strains at notch is useful in the designing of a component or a structure with stress raisers against different types of failure modes, i.e. brittle facture due to monotonic loading [1], low cycle fatigue (LCF) due to cyclic loading [2], creep at high temperature [3], and sometimes a combination of these failure modes [4]. The notch stress-strain conversion (NSSC) rules provide a relatively simple method for estimating local strains, especially for prediction of fatigue crack initiation (FCI) using either smooth specimen fatigue life data or other empirical relationships such as Manson-Coffin equation [5,6].The most commonly used rules are Linear approximation [7], Neuber [8] and equivalent strain energy density (ESED) method [9]. Many experimental [10-12] and numerical [13,14] investigations have been carried out in order to verify these rules. Results show that Neuber rule predicts an upper bound on strains, Linear approximates a lower bound and the ESED approximation will between the two.
There are methods based on iterative linear elastic finite element analyses that make use of modification to the local elastic modulus of the component at each subsequent iteration in order to achieve inelastic-like strain and stress distributions. Seshadri [15] developed the elastic modulus adjustment procedure (EMAP) on a rigorous basis. By introducing the concept of “time-scaling” in conjunction with a uniaxial stress relaxation model, a local region constraint parameter characterizing multiaxiality and follow-up effects has been determined. This local region constraint parameter, which is a measure of the extent on interaction between local and remainder regions, has been shown to be useful in the assessment of multiaxial stress relaxation, creep damage, low-cycle fatigue, plastic collapse, and elastic-plastic fracture. The method for determining the constraint parameter, called the Generalized Local Stress and Strain (GLOSS) analysis, is based on two linear elastic finite element analysis (FEA) in which the first analysis is carried out with homogeneous material properties with mechanical and thermal loads applied to the structure. A second linear elastic FEA is performed by suitable reducing the elastic moduli of the elements that exceed the yield stress [15].
This paper focuses on the behavior in the small, and in the large, of relaxation process during redistribution from pseudoelastic state to inelastic state on stress-strain curve by considering reference stress [16] in the component. Based on the NSSC rules and the net-section stresses, a new approach is suggested for the estimation of the stress-strain at the notch root. The technique is demonstrated and the accuracy assessed, by comparing the results with inelastic finite element predictions for some practical notch configurations including plane stress, plane strain and axisymmetric geometries.
2. NOTCH STRESS-STRAIN CONVERSION RULES
For sake of discussion, consider a plate with a hole subjected to a tensile load. For a given load level, we examine the relationship between inelastic states (points a' and b') and the corresponding pseudoelastic points (a and b) on the elastic curve. There is an implied relaxation trajectory that connects point a to a', and point b to b', as shown in Fig. 1. This trajectory is indicative of a progressive loss of local region constraint in the given component, and its slope is related to the constraint parameter. The assumption that the material remains isotropic, even after yielding locally, is reasonable given that small deformation theory is employed. The parameter Es can be estimated by applying NSSC rules; however, the accuracy of
results would be mainly dependent on the choice of the NSSC rule.
(a) (b)
Fig. 1- Pseudoelastic and inelastic states of stress and strain: (a) Plate with a hole, (b) Strain stress curve
2.1 Linear rule
The linear rule is based on the assumption that the strains for pseudoelastic and inelastic states are the same, which leads to vertical line representing the relaxation locus. The linear rule can be written in terms of the strains as
e eq ep
eq ε
ε = (1)
where ep eq
ε is the notch tip elastic-plastic equivalent strain and e eq
ε is that which would have been obtained in a linear elastic analysis. This rule gives a better estimation for plane strain compared to the plane stress condition [2]. Gowhari-Anaraki and Hardy [2] reported a strain range estimation method based on the linear rule that provides a lower bound estimation in comparison to the results obtained using inelastic FEA.
2.2. Neuber rule
Neuber published the theory of stress concentration [8] for a prismatic body subjected to pure shear loading, where a relationship between nominal and notch-tip stress and strain in terms of elastic stress and strain concentration factors was proposed. Neuber rule complemented the Manson-Coffin relationship for low cycle estimating fatigue life. However, the studies to verify Neuber rule by Leis et al. [10] and Conle et al. [11] revealed that it may overestimate the local inelastic strains and stresses. A generalization of Neuber rule proposed by Hoffmann and Seeger [17,18] addresses multiaxial proportional loading sequences. They extended Neuber rule by replacing the uniaxial stress and strain with equivalent stress and strain, i.e.,
e eq e eq ep eq ep
eq ε σ ε
σ = (2)
where ep eq
σ is the notch tip elastic-plastic equivalent stress, and e eq
σ is that which would be obtained in an elastic analysis.
2.3. Equivalent strain energy density (ESED) rule
Molski and Glinka [9] proposed an alternate approximate techniques for use in place of the Neuber's rule, which is called as ESED method. This method is based on the assumption that the strain energy density at the notch root does not change significantly if the localized plasticity is surrounded by predominantly elastic material (by Hutchison [19] for cracks, and by Walker [20] for a deep sharp notch). In other words, the computation of the strain energy density at the notch root will yield identical results for either the elastic or the elastic-plastic material relationship. The ESED relation has the following form:
∫
=
ep ij
ep ij e ij e ij e
ij d
ε ε σ ε σ
0
2
1
(3)
It was demonstrated in some cases that the measured or FEA results for local strain lie between the predictions from the ESED rule and Neuber's rule. In these instances, it was difficult to determine which model best fit the experimental data. It has been suggested that estimations made from ESED rule and Neuber's rule will give lower and upper bounds on the local strain, respectively, which can be used to estimate the uncertainty with the life prediction (Sharpe et al. [21]).
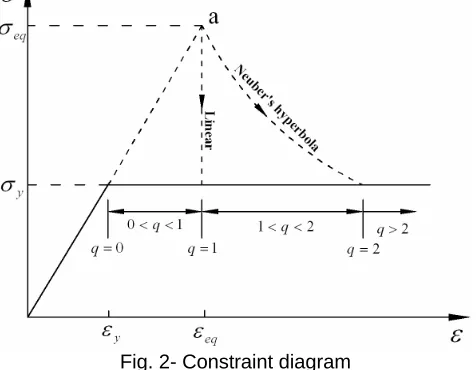
The aforementioned NSSC rules can be expressed as a general relation between initial modulus of elasticity (elastic state) and effective modulus of elasticity (inelastic state) as
Fig. 2- Constraint diagram
Due to high localized plasticity region in the notch root, the peak stress is high compared to the primary stresses; therefore, a reasonable estimation of local inelastic stresses and strains are possible using the NSSC rules.
Table 1- NSSC Rules
NSSC rule Parameter q
Linear [2] q=1
Neuber [8] q=2
ESED [9]
⎟ ⎟ ⎠ ⎞ ⎜ ⎜ ⎝ ⎛ ⎟ ⎟ ⎠ ⎞ ⎜
⎜ ⎝ ⎛
+ =
eq y
y eq
y
q
σ σ σ
σ σ
ln / 2 ln 2 2
2
3. REFERENCE STRESS
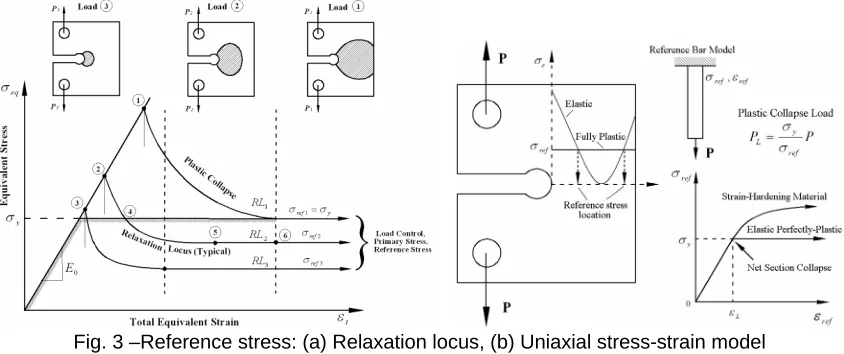
For the sake of discussion, consider a notched component subjected to a mechanical load. By increasing the load, the primary stress in the component increases and plastic zone becomes larger until net section yielding occurs. Figure 3-a is a plot of equivalent stress versus equivalent strain for an element in a given finite element discretization corresponding to the maximum stress location. The relaxation loci RL1, RL2 and RL3 correspond to the redistribution of stress corresponding to points 1, 2 and 3, respectively. The trajectory of the relaxation locus, RL2, is along 2-4-5-6. The initial portion of the locus (2-4) pertains to the redistribution of peak and secondary stresses. Referring to Fig. 3-a, the relaxation locus RL1corresponds to the plastic collapse process. If P1, P2 and P3 are the external loads at points 1, 2 and 3 on linear elastic-line, the respective reference stress is related to the limit load by the relationship.
= (k=1,2,3) P
P
L y k nk
σ
σ (5)
It follows that
3 3
2 2
1 1
ref ref ref
P P P
σ σ
σ = = (6)
where σref1, σref2, and σref3 are reference stresses (primary stresses) corresponding to P1, P2 and P3, respectively, and PL is the
Fig. 3 –Reference stress: (a) Relaxation locus, (b) Uniaxial stress-strain model
For statically determinate components, the formation of a single plastic hinge or hinge line will result in plastic collapse. The occurrence of a single reference stress location at plastic hinge cross-section is indicative of a load-controlled membrane mode of collapse. The formation of multiple hinges occurs in an indeterminate component structure. In Fig. 3-a, when bending action is dominant there are two reference stress location with equal magnitude across the cross-section, collapse occurs when σref= σy. As presented in Fig. 3-b, the elastic and fully plastic stress distributions in the notch cross section of
meet each other at the reference stress location.
Stresses in the component consist of the combination of primary stress, secondary stress and peak stress; however, after stress redistribution, secondary stress along with peak stress disappears and only primary stress remains. This means that the relaxation locus will reach asymptotically to primary stress (reference stress) line.
4. GENERAL PROCEDURE FOR NOTCH STRESS STRAIN CONVERSION
In this section, a general method for the assessment of inelastic behavior based on the overall relaxation locus is introduced. Consider an elastic-perfectly material behavior for which the stress is normalized as σ =σ/σy, and strain is
normalized asε =ε/εy(where εy =σy /E). Equation (4) can be rewritten in terms of any arbitrary point (σ ,ε) on the
relaxation locus as
q
eq s
E ⎟⎟
⎠ ⎞ ⎜ ⎜ ⎝ ⎛ =
σ
σ
(7)
where Es =Es/E0 and σeq =σeq/σy.
The relationship between stress and strain for an arbitrary point using Eq. (7) can be obtained from Eq. (15), which describes the relaxation locus based on the traditional method, Neuber and ESED.
q (1q) eq
−
=σ σ
ε (8)
Also, the slope of relaxation locus at an arbitrary point can be determined by differentiating Eq. (8). i.e.,
q eq
q d
d
⎟⎟ ⎠ ⎞ ⎜⎜ ⎝ ⎛ − =
σ σ σ
ε
) 1
( (9)
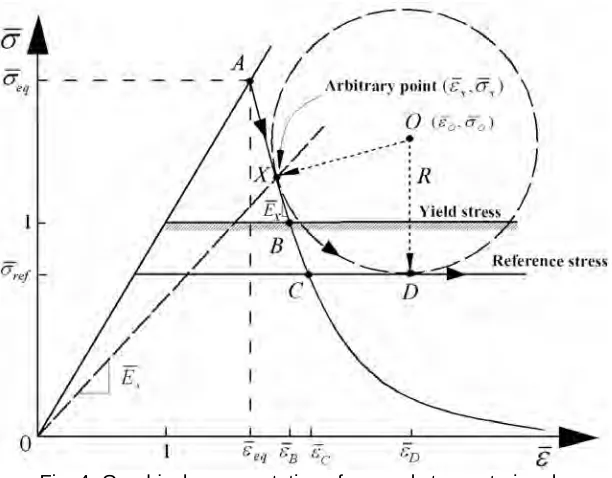
With reference to Fig. 4, point A is the location of elastic solution, point X is an arbitrary point on the curve, point B is intersection of relaxation locus and yield surface, point C is location of reference stress, and point D is the location where relaxation locus is tangential to reference stress line, for which the corresponding strain is as yet undefined. The values of stress, strain and curve slope at the four points are reviewed in Table 2. In order to estimate location of point D, we assume that there is a point , say point X (unknown yet), where part of the relaxation locus between point X and D is a circle with the centre of (εO,σO), point O, and radius of R, and circle is tangential to the points X and D. Therefore, the line between points X and O can be expressed as
) (
)
(σO−σX =−EX εO−εX (10)
where q
X eq
X q
E =(1− )(σ /σ ) (see Table 2).
Fig. 4- Graphical representation of general stress strain rule
Table 2- Values of relaxation locus parameters
Point
σ
ε
d
ε
/
d
σ
A σeq εeq=σeq (1−q)
X σX εX
q X eq
q)( / ) 1
( − σ σ
B 1
σ
eqqq eq
q)σ 1 ( −
C σref
) 1 (
/ q− ref q eq σ σ q ref eq
q)( / ) 1
( − σ σ
D σref εD ∞
The lengths of OX and OD (Fig. 4), are as follow:
2 2 2 2 ) ( ) ( ) ( ) ( D O D O X O X O OD OX σ σ ε ε σ σ ε ε − + − = − + − =
By equating OX and OD, and making use of Eq. (10), the circle centre can be obtained as
2 4 2 c b b D O − + − = =ε ε (11) X q X eq X O
O q σ σ
σ ε ε σ ⎟⎟ + ⎠ ⎞ ⎜⎜ ⎝ ⎛ − −
=( 1)( ) (12)
where
[
ref X X]
q
X eq
q
b σ σ σ
σ σ − − − ⎟⎟ ⎠ ⎞ ⎜⎜ ⎝ ⎛
=2 ( 1)( )
⎥ ⎥ ⎦ ⎤ ⎢ ⎢ ⎣ ⎡ ⎟⎟ ⎠ ⎞ ⎜⎜ ⎝ ⎛ − − − + − + = − q X eq X X X ref ref q X q eq X q c 2 2 ) 1 ( 2 2 2 ) 1 ( ) ( 2 σ σ σ σ σ σ σ σ σ σ
Considering the presence of primary stresses present, the relaxation locus goes through point D rather than point C; therefore, the new expression for q can be obtained by making use of Eq. (4) as
⎟ ⎟ ⎠ ⎞ ⎜ ⎜ ⎝ ⎛ ⎟ ⎟ ⎠ ⎞ ⎜ ⎜ ⎝ ⎛ = ′ ref eq ref D q σ σ σ ε ln /
Several points have been examined for the most appropriate location of point X; however, comparing the results with inelastic FEA, the best choice is point A. Therefore, Eq. (11) can be simplified as:
2 2 ) ( ) 1
( − + − 2 − +
−
=q eq q ref eq ref q q
D σ σ σ σ
ε (14)
Substituting Eq. (14) into Eq. (13), the modified value of q based on ESED [9] can be obtained as
) ln( ) 2 2 ) 1 ( ) 1 ( ln( 2 γ γ γ − − + − − + =
′ q q q q
q (15)
where γ =σeq/σref. And q is calculated using ESED rule given in Table 2.
Finally, the modified predicted elastic–plastic strain at notch root using Eq. (8) is given by:
q eq notch eq ′ =σ
ε (or q
y eq y notch eq E ′ =(σ / )(σ /σ )
ε ) (16)
5. RESULTS AND VALIDATION
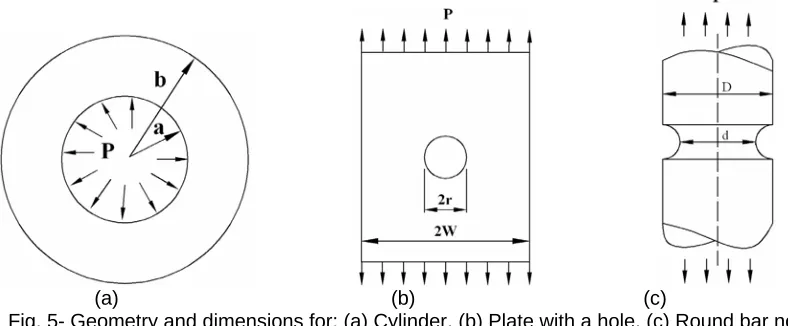
In this section, the method described in previous section is applied to several notch configurations, and the results are compared with the available NSSC rules and inelastic finite element analysis. Figure 5 depicts three geometries and dimensions that are analyzed. The material is assumed to be elastic-perfectly plastic in all cases. The various problems are modeled using the ANSYS software (university research version [23]). While modeling the notch components using FEA, it is necessary to use a fine mesh around the geometry discontinuity in order to simulate the high stress concentration at the notch. It should be mentioned that for cylinder the limit load is calculated using available analytical solutions; however, for the other two problems limit load is estimated using inelastic FEA
(a) (b) (c)
Fig. 5- Geometry and dimensions for: (a) Cylinder, (b) Plate with a hole, (c) Round bar notch
5.1. Thick-walled cylinder
To demonstrate the application of the proposed method, a closed ended thick-walled cylinder under internal pressure, Fig. 5-a, with inner radius of a and outer radius b is considered. Elastic-perfectly plastic material behavior model is assumed and material constants are E=200 GPa, ν=0.3 and σy=150 MPa.
The limit load and internal pressure to cause plastic radius of c are given in [24] as
⎟ ⎠ ⎞ ⎜ ⎝ ⎛ = a b PL yln
3 2 σ ⎥ ⎥ ⎦ ⎤ ⎢ ⎢ ⎣ ⎡ ⎟ ⎠ ⎞ ⎜ ⎝ ⎛ − ⎟ ⎠ ⎞ ⎜ ⎝ ⎛ + = 2 ln 2 1 3 2 b c a c Pi σy
The equivalent stress and total elastic plastic strain in internal portion of cylinder are given as [25], respectively
5.2 Plate with a hole
A plate with a hole (Fig. 5-b) with a uniform tensile load P is modeled in plane stress condition. The plate width is 2W =150 mm, the length is L=300 mm, and the notch diameter is 2r =40 mm. The modulus of elasticity is 200 GPa, and the yield stress is 150 MPa. The variation of elastic equivalent stress verses equivalent elastic-plastic strain predicted by NSSC rules and inelastic FEA for plane stress and plane strain conditions are presented in Figs. 6-a and 6-b, respectively.
It can be seen from these figures that the elastic-plastic strains predicted by the present method are in agreement with nonlinear finite element method (NFEM) results for both plane stress and plane strain conditions. On the other hand, Neuber’s rule overestimates the inelastic strains, and the ESED and Linear rules underestimate the inelastic strain at notch root.
Fig. 6- Plate with a hole- (a) Plane stress, (b) Plane strain
5.3 Round bar notch
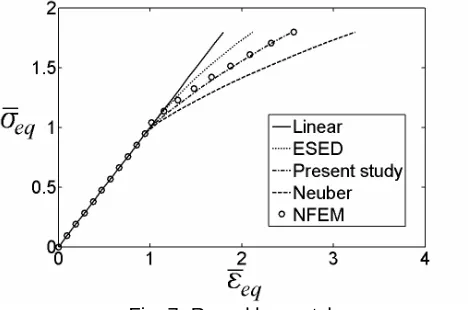
For a round bar notch configuration (Fig. 5-c), D=300 mm, r=25mm and overall length L=500 mm. The material is the same as for the plate with a hole. The variation of equivalent stress (elastically calculated) versus predicted elastic-plastic strain with different method including inelastic FEA is presented in Fig. 7.
CONCLUSION
Based on the entire relaxation locus, a new approach for the estimation of local behavior at notch root is presented. Notch root stresses and strains are calculated by employing the linear rule, Neuber’s rule, Glinka’s rule and the method suggested in this paper is compared with elastic–plastic finite element analysis predictions. The Neuber rule predicted conservative local strain amplitudes, especially when the local stress state is plane strain. The results from the ESED method are underestimates of the predictions compared to finite element analyses. The method proposed in this paper gives good estimation of strain and stress at the notch root.
REFERENCES
1. Pluvinage, G. “Fatigue and Fracture Emanating from Notch, the use of the Notch Stress Intensity Factor,” J. Nuclear Engineering. Design, Vol. 185, 1998, pp. 173–184.
2. Stephens, R. I., Fatemi, A., Stephens, R. R., and Fuchs, H. O. “Metal Fatigue in Engineering,” 2nd edition, 2000 (John Wiley, New York).
3. Penny, R. K., and Marriott, D. L., “Design for Creep,” 2nd edition, 1995 (Chapman and Hall, London).
4. Hyde, T. H., Sabesan, R., and Leen, S. B., “Approximate Prediction Methods for Notch Stresses and Strains under Elastic-Plastic and Creep,” J. Strain Analysis, Vol. 39, 2004, pp. 515–527.
5. Coffin Jr., L. F. A “Study of the Effects of Cyclic Thermal Stresses on a Ductile Metal,” Trans. ASME, 1954, 931–950. 6. Manson, S. S. “Behavior of Materials under Conditions of Thermal Stress,” NACA paper TN-2933, 1953.
7. Gowhari-Anaraki, A. R., and Hardy, S. J. “Low Cycle Fatigue Life Predictions for Hollow Tubes with Axially Loaded Axisymmetric Internal Projections,” J. Strain Analysis, Vol. 26, 1991, pp. 133–146.
8. Neuber, H. “Theory of Stress Concentration for Shear-Strained Prismatical Bodies with Arbitrary Non-linear Stress–Strain Law,” Trans. ASME, J. Appl. Mech., Vol. 28, 1961, pp. 544–550.
9. Molski, K., and Glinka, G., “A Method of Elastic-Plastic Stress and Strain Calculation at a Notch Root,” Mater. Sci. Engng, Vol. 50, 1981, pp. 93–100.
10. Leis, B. N., Gowda, C. V. B., and Topper, T. H., “Some Studies of the Influence of Localized and Gross Plasticity on the Monotonic and Cyclic Concentration Factors,” Journal of Testing and Evaluation, Vol. 1, 1973, pp. 341-348.
11. Conle, A., and Nowwack, H., “Verification of a Neuber based Notch Analysis by the Companion-Specimen Method,” Experimental Mechanics, Vol. 17, 1977, pp. 57-63.
12. Zeng, Z., and Fatemi, A., “Elastic-plastic Stress and Strain Behavior at Notch Roots under Monotonic and Cyclic Loading,” J. Strain Analysis, 2001, Vol. 36, pp. 287-300.
13. Hardy, S. J., and Gowhari-Anaraki, A. R. “Stress and Strain Range Predictions for Axisymmetric and Two-dimensional Components with Stress Concentrations and Comparisons with Notch Stress–Strain Conversion Rule Estimations,” J. Strain Analysis, Vol. 28, 1993, pp. 209–221.
14. Glinka, G., “Calculation of Inelastic Notch-tip Strain-Stress Histories under Cyclic Loading,” Engineering Fracture Mechanics, Vol. 22, 1985, pp. 839-854.
15. Seshadri, R., “The Generalized Local Stress Strain GLOSS Analysis— Theory and Applications,” ASME J. Pressure Vessel Technology, Vol. 113, 1991, pp. 219– 227.
16. Webster, G. A., and Ainsworth, R. A., “High Temperature Component Life Assessment,” 1994 (Chapman and Hall). 17. Hoffmann, M., and Seeger, T. A., “Generalized Method for Estimating Multiaxial Elastic–Plastic Notch Stresses and Strains, Part 1: Theory,” Trans. ASME, J. Engng Mater. Technol., Vol. 107, 1985, pp. 250– 254.
18. Hoffmann, M., and Seeger, T. “A Generalized Method for Estimating Multiaxial Elastic–Plastic Notch Stresses and Strains, Part 2: Application and General Discussion,” Trans. ASME, J. Engng Mater. Technol., Vol. 107, 1985, pp. 255–260. 19. Hutchinson, J.W., “Singular Behavior at the End of a Tensile Crack in a Hardening Material,” Journal of Mech. Phys. Solids, Vol. 16, 1968, pp. 13-31.
20. Walker, T.J., “A Quantitative Strain-and Stress State Criterion for Failure in the Vicinity of Sharp Cracks," Nuclear Technology, Vol. 23, 1974, pp. 189-203.
21. Sharpe Jr, W. N., Yang, C. H., and Tregoning, R. L. “An Evaluation of the Neuber and Glinka Relations for Monotonic Loading,” Trans. ASME, J. Appl. Mech., Vol. 59, 1992, pp. 50–56.
22. Adibi-Asl, R., Fanous, I. F. Z., and Seshadri, R., “Elastic Modulus Adjustment Procedures-Improved Convergence Schemes,” Int. J. Pressure Vessels Piping, Vol. 83, 2006, pp. 154-160
23. ANSYS, 2004, University Research Version, 7.1, SAS IP, Inc.
24. Kaliszky, S., “Plasticity-Theory and Engineering Applications,” 1989 (Elsevier).
25. Lazzarin P., and Livieri P., “Different Solution for Stress and Strain Fields in Autofrettaged Thick-Walled Cylinders,” International Journal of Pressure Vessels and Piping, Vol. 71, 1997, pp. 231-238.

![Di μ chlorido μ (dimethyl sulfide) bis{dichlorido[(dimethyl selenide κSe)(dimethyl sulfide κS)(0 65/0 35)]niobium(III)}(Nb—Nb)](data:image/gif;base64,R0lGODlhAQABAIAAAP///wAAACH5BAEAAAAALAAAAAABAAEAAAICRAEAOw==)