University of Windsor University of Windsor
Scholarship at UWindsor
Scholarship at UWindsor
Electronic Theses and Dissertations Theses, Dissertations, and Major Papers
3-24-2019
Texture Evolution of Non-Oriented Electrical Steels during
Texture Evolution of Non-Oriented Electrical Steels during
Thermomechanical Processing
Thermomechanical Processing
Mehdi Mehdi University of Windsor
Follow this and additional works at: https://scholar.uwindsor.ca/etd
Recommended Citation Recommended Citation
Mehdi, Mehdi, "Texture Evolution of Non-Oriented Electrical Steels during Thermomechanical Processing" (2019). Electronic Theses and Dissertations. 7648.
https://scholar.uwindsor.ca/etd/7648
This online database contains the full-text of PhD dissertations and Masters’ theses of University of Windsor students from 1954 forward. These documents are made available for personal study and research purposes only, in accordance with the Canadian Copyright Act and the Creative Commons license—CC BY-NC-ND (Attribution, Non-Commercial, No Derivative Works). Under this license, works must always be attributed to the copyright holder (original author), cannot be used for any commercial purposes, and may not be altered. Any other use would require the permission of the copyright holder. Students may inquire about withdrawing their dissertation and/or thesis from this database. For additional inquiries, please contact the repository administrator via email
Texture Evolution of Non-Oriented Electrical Steels during
Thermomechanical Processing
by
Mehdi Mehdi
A Dissertation
Submitted to the Faculty of Graduate Studies
through the Department of Mechanical, Automotive & Materials Engineering in Partial Fulfillment of the Requirements for
the Degree of Doctor of Philosophy at the University of Windsor
Windsor, Ontario, Canada
Texture Evolution of Non-Oriented Electrical Steels during
Thermomechanical Processing
by
Mehdi Mehdi
APPROVED BY:
K. Verbeken, External Examiner Ghent University
N. Kar
Department of Electrical Engineering
R. Riahi
Department of Mechanical, Automotive & Materials Engineering
V. Stoilov
Department of Mechanical, Automotive & Materials Engineering
Y. He, Co-Advisor
Department of Mechanical, Automotive & Materials Engineering
A. Edrisy, Co-Advisor
Department of Mechanical, Automotive & Materials Engineering
III
DECLARATION OF CO-AUTHORSHIP/PREVIOUS PUBLICATIONS
1. Co-Authorship Declaration
I hereby declare that this dissertation incorporates research results obtained by the author under
the co-supervision of Dr. Afsaneh Edrisy and Dr. Youliang He. I would also like to declare that
Dr. Erik J. Hilinski (formerly US Steel and now Tempel Steel, USA) played a vital role in
providing the materials used in Chapters 3-7 as well as contributing to the scientific discussion of
the obtained results and revising the final manuscripts. I certify that, with the above qualification,
this dissertation, and the research to which it refers, is the product of my own work. Dr. Leo
Kestens (Ghent University, Belgium) has also significantly contributed to the scientific discussion
that led to completion of the manuscripts of which Chapters 3 and 4 are based on.
2. Declaration of Previous Publications
This dissertation includes five original papers that have been published/submitted or to be
submitted in peer-reviewed journals as follows:
Chapter 3: M. Mehdi, Y. He, E. J. Hilinski, L. A. Kestens, A. Edrisy, The Formation of the Cube
({100}<001>) Texture in Non-oriented Electrical Steels (to be submitted).
Chapter 4: M. Mehdi, Y. He, E. J. Hilinski, L. A. Kestens, A. Edrisy, The Origins of the Goss
Orientation in a 2.8 wt% Si Non-oriented Electrical Steel, Journal of Steel Research International
(submitted).
Chapter 5: M. Mehdi, Y. He, E. J. Hilinski, A. Edrisy, Texture Evolution of a 2.8% Si
Non-oriented Electrical Steel and the Elimination of the <111>//ND Texture, Journal of
IV
Chapter 6: Mehdi, Mehdi, Youliang He, Erik J. Hilinski, and Afsaneh Edrisy, Effect of Skin Pass
Rolling Reduction Rate on the Texture Evolution of a Non-oriented Electrical Steel after Inclined
Cold Rolling. Journal of Magnetism and Magnetic Materials, 429 (2017): 148-160. (published)
Chapter 7: Mehdi, Mehdi, Youliang He, Erik J. Hilinski, and Afsaneh Edrisy, Non-oriented
Electrical Steel with Core Losses Comparable to Grain-oriented Electrical Steel, Journal of
Magnetism and Magnetic Materials (submitted).
I certify that I have obtained a written permission from the copyright owner(s) to include
the above published/to be published material(s) in my dissertation. I certify that the above material
describes work completed during my registration as graduate student at the University of Windsor.
I declare that, to the best of my knowledge, my dissertation does not infringe upon anyone’s
copyright nor violate any proprietary rights and that any ideas, techniques, quotations, or any other
material from the work of other people included in my dissertation, published or otherwise, are
fully acknowledged in accordance with the standard referencing practices. Furthermore, to the
extent that I have included copyrighted material that surpasses the bounds of fair dealing within
the meaning of the Canada Copyright Act, I certify that I have obtained a written permission from
the copyright owner(s) to include such material(s) in my dissertation. I declare that this is a true
copy of my dissertation, including any final revisions, as approved by my dissertation committee
and the Graduate Studies office, and that this dissertation has not been submitted for a higher
V
ABSTRACT
The aim of this research is to improve the magnetic properties of non-oriented electrical
steels (NOES) for magnetic cores used in electric motors. This was done by controlling the grain
size and the final texture of the electrical steel sheets, such that the magnetically favourable θ-fibre
(<100>//ND) components are promoted, while the magnetically unfavourable γ-fibre (<111>//ND)
components are suppressed. The origins of the magnetically favourable cube and Goss textures
were investigated through all thermomechanical processing stages using electron backscatter
diffraction (EBSD) techniques. Three types of Goss regions were found after cold rolling. The first
two types were embedded inside deformed {111}<112> grains, while the third type was located
at grain boundaries. Similarly, the cube texture was also retained at grain boundaries, as well as
inside the shear bands of deformed rotated Goss {110}<110> grains. Partial recrystallization led
to the preferential nucleation of the Goss and cube nuclei.
The effect of annealing time and grain growth on the texture evolution of NOES was
investigated. It was found that by simply changing the annealing time, the texture showed
significantly different features, i.e. depending on the annealing time, the Goss ({011}<100>), the
-fibre (<001>//normal direction, ND) or the -fibre (<111>//ND) may dominate the texture. The
formation of the various textures during annealing at different times was discussed against the
oriented growth theory based on a statistic analysis of the grain boundary misorientation and grain
size.
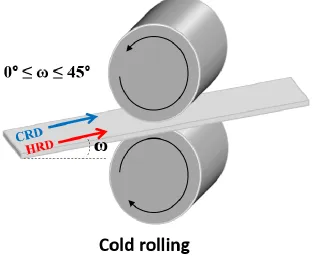
In order to improve the final texture in non-oriented electrical steel, an unconventional cold
rolling scheme was employed, in which the cold rolling was carried out at an angle (i.e. 30°, 45°,
60°, and 90°) to the hot rolling direction (HRD). It was found that cold rolling at an angle of 60°
VI
of skin pass rolling at various reduction rates from 5–20% on the texture evolution was
investigated.
Finally, the effect of annealing temperature on the microstructure and texture of 3.2% Si
steel was studied. It was found that having coarse grains after hot band annealing combined with
high temperature annealing can result in significantly weakened γ-fibre components, and
promoting the θ-fibre texture. The magnetic properties were measured using Epstein frame test
and magnetic Barkhausen noise analysis (MBN). It was found that the DC core losses and MBNrms
decreased with increasing grain size, due to the decrease in pinning sites. On the other hand, AC
measurements revealed that the optimized texture and grain size was achieved after annealing at
850C for 60 minutes, with AC core losses comparable to those obtained from commercially
VII
DEDICATION
I would like to dedicate this work primarily to the Prophet Muhammad and his Holy
purified household (Ahlul-bayt) peace be upon them. They certainly are the lanterns of darkness
and the treasures of knowledge. They are my shelter, my guide and the light that has always
given my life meaning. Everything I am, and everything I will ever be, I owe to them.
I would like to dedicate this work to my mother Rajaa Hassan, my father Alaa Mehdi, my
siblings, Raed Mehdi, Hiba Mehdi, Mariam Mehdi and Hossein Mehdi as well as my nephew
and nieces Mohammed Hadi, Zahraa, Zainab and Narjis (Anoos). You are the closest people to
my heart and I would not be here today if it was not for your endless love and support.
VIII
ACKNOWLEDGEMENTS
First and foremost, I would like to sincerely acknowledge and thank my wonderful
supervisors, Dr. Afsaneh Edrisy and Dr. Youliang He for their continuous support and
motivation throughout my journey. They have taught me most of what I know about materials
engineering and showed me the way great science research can be conducted. To them, I am
forever in debt.
I would also like to thank Dr. Erik Hilinski and Dr. Leo Kestens for their enormous help
with my research. I have benefited a lot from our discussions and your feedback and critical
comments were always mind opening and inspiring for me.
I am also grateful to Dr. Mark Kozdras for his continuous support, Maciej Podlesny for
his help in the Magnetic Barkhausen measurements, Michael Attard and Raul Santos for their
help on hot rolling, cold rolling and annealing, and to Renata Zavadil, Catherine Bibby, Pei Liu
and Dr. Jian Li for their assistance on EBSD characterization and sample preparation.
I am also very grateful for all the help that Dr. Kora Farokhzadeh has provided me with,
ever since joining the department. I have always found her extremely helpful and very patient in
dealing with her colleagues. I am also grateful to Dr. Mehdi Sanjari for the many productive
discussions concerning electrical steels.
Finally, I am also very thankful to my respected committee members, Dr. Reza Riahi, Dr.
Vesselin Stoilov, Dr. Narayan Kar and Dr. Kim Verbeken, for taking the time to review my work
IX
TABLE OF CONTENTS
DECLARATION OF CO-AUTHORSHIP/PREVIOUS PUBLICATIONS ……… III
ABSTRACT ………. V
DEDICATION ………. VII
ACKNOWLEDGEMENTS ………... VIII
LIST OF TABLES ……….. XIV
LIST OF FIGURES ………. XV
LIST OF ABBREVIATIONS/SYMBOLS ………. XXVIII
NOMENCLATURE ………. XXX
Chapter 1: Introduction ………. 1
Chapter 2: Literature review ………. 6
2.1 Introduction ………. 6
2.1.1 Magnetic materials ………6
2.1.2 Non-oriented electrical steel (NOES) ………...8
2.2 Fundamentals of Magnetism and Magnetic Properties ………. 13
2.3 Core losses ………. 15
2.3.1 Hysteresis losses ………. 15
2.3.2 The eddy current loss ……….. 17
2.3.3 The excess loss ………18
2.4 The effect of grain size ……….. 20
2.5 The effect of impurities ………. 24
X
2.6.1 Sheet thickness ……… 26
2.6.2 Residual stress ………. 27
2.7 The effect of Si content ……….. 27
2.8 Magnetocrystalline anisotropy ………... 31
2.9 The effect of crystallographic texture on magnetic properties ……….. 33
2.9.1 Crystallographic texture and its representation ………33
2.10 Texture evolution during thermomechanical processing ………. 40
2.10.1 Hot rolling textures ………... 41
2.10.2 Cold rolling textures ………. 44
2.10.3 Annealing textures ……… 47
2.11 Methods of improving the texture of NOES ……… 52
2.11.1 Cross-rolling ………. 52
2.11.2 Inclined rolling ……….. 53
2.11.3 Skew rolling ……….. 54
2.11.4 Surface textures ………. 55
2.11.5 Strip cast and warm rolling ………... 56
References ……… 57
Chapter 3: The Formation of the Cube ({100}<001>) Texture in Non-oriented Electrical Steels ……… 62
3.1 Introduction ……… 62
3.2 Experimental ……….. 65
3.3 Results ……… 68
XI
3.3.2 Hot band annealing ………. 69
3.3.3 Cold rolling ………. 72
3.3.4 Recrystallization ………. 78
3.3.5 Inclined rolling ……… 79
3.3.6 Partial recrystallization after inclined rolling ………. 86
3.4 Discussion ……….. 88
3.5 Conclusions ……… 93
References………. 95
Chapter 4: The Origins of the Goss Orientation in a 2.8 wt% Si Non-oriented Electrical Steel ………. 97
4.1 Introduction ……… 97
4.2 Materials and methods ………... 99
4.3 Results and discussion ………. 101
4.3.1 Hot rolling ………. 101
4.3.2 Hot band annealing ………... 104
4.3.3 Cold rolling ………... 106
4.3.4 Final annealing ……….. 115
4.5 Conclusions ……….. 121
References ……….. 122
Chapter 5: Texture Evolution of a 2.8% Si Non-oriented Electrical Steel and the Elimination of the <111>//ND Texture ………... 124
5.1 Introduction ……….. 124
XII
5.3 Results ……….. 128
5.3.1 Hot rolling texture ………... 128
5.3.2 Texture after hot band annealing ……….. 132
5.3.3 Cold rolling texture ………... 134
5.3.4 Final annealing texture ………... 137
5.4 Discussion ……… 144
5.5 Conclusions ……….. 154
References ……….. 156
Chapter 6: Effect of skin pass rolling reduction rate on the texture evolution of a non-oriented electrical steel after inclined cold rolling ……… 159
6.1 Introduction ……….. 159
6.2 Material and experimental procedures ………. 161
6.3 Results ……….. 163
6.3.1 Microstructure ………... 163
6.3.2 Texture before and after inclined cold rolling ……….. 168
6.3.3 Texture after inclined rolling and annealing ……… 169
6.3.4 Texture after skin pass rolling ……….. 173
6.3.5 Texture after final annealing ………. 178
6.4 Discussion ……… 185
6.5 Conclusions ……….. 188
References ……….. 190
XIII
7.1 Introduction ……….. 193
7.2 Material and experimental procedures ………. 194
7.3 Results ……….. 197
7.3.1 Hot rolling texture and microstructure ……….. 197
7.3.2 Microstructure and texture after hot band annealing ……… 199
7.3.3 Cold rolling microstructure and texture ……… 202
7.3.4 Microstructure and texture after final annealing ………... 203
7.3.5 Magnetic properties ……….. 207
7.3.5.1 DC core loss ………... 207
7.3.5.2 AC magnetic properties ………. 208
7.3.5.3 AC core loss compared to commercial GOES………... 210
7.3.5.4 Magnetic Barkhausen noise ………... 212
7.3.5.5 Magnetocrystalline anisotropy ………... 213
7.4 Discussion ……… 215
7.5 Conclusions ……….. 219
References ……….. 221
Chapter 8: Summary and conclusions ………... 224
8.1 Future work ……….. 226
8.2 Contributions ………... 227
APPENDIX A: COPYRIGHT RELEASES FROM PUBLICATIONS ………. 229
XIV
LIST OF TABLES
Table 2.1. The susceptibility or relative permeability values of some diamagnetic, paramagnetic,
ferromagnetic and ferrimagnetic materials ……….. 14
Table 2.2. The effect of sheet thickness on the core loss of fully processed NOES at 400 Hz and 2.5 kHz ………..………... 26
Table 2.3. The magnetocrystalline anisotropy energy for bcc single crystal ……….. 32
Table 2.4. The major texture fibres in BCC and FCC materials along with their directions ….. 37
Table 2.5. The major texture components in BCC and FCC alloys along with their common names, as well as their corresponding Euler angles and Miller indices ………... 37
Table 3.1.Chemical compositions of the investigated steels (wt%) ………... 67
Table 4.1. Summary of the volume fraction change of the Goss grains during thermomechanical processing ……….. 120
Table 6.1.Chemical composition of the investigated steel (wt%) ……… 162
Table 6.2. Average grain sizes of the annealed samples after inclined rolling ………. 166
Table 7.1.Chemical composition of the investigated steel (wt%) ……… 195
XV
LIST OF FIGURES
Chapter 2
Fig. 2.1. The types of magnetic materials and their market shares ………... 6
Fig. 2.2. The subclasses of soft magnetic materials and their market shares ……… 8
Fig. 2.3. Common processing steps for fully processed non-oriented electrical steels ………... 10
Fig. 2.4. Typical processing steps for semi-processed non-oriented electrical steels …………. 11
Fig. 2.5. Hysteresis loop showing the relationship between magnetizing field H and the flux
density B ……….. 17
Fig. 2.6. The variations in Wh, Wcl and Wexc with frequency for GOESat B=1.32 T ………… 19
Fig. 2.7. Variations of the total power loss, Wt, hysteresis loss, Wh, and eddy current losses, We,
with respect to grain diameter ……….. 21
Fig. 2.8. (a) Variation of hysteresis loss, Ph, with grain size (g), and (b) hysteresis loss plotted
against 1/√g ………. 22
Fig. 2.9. The relationship between power loss and grain size (g): (a) excess power loss (Pe) vs.
grain size (Pe∝√g), and (b) the total power losses Pt vs. grain size ……….. 22
Fig. 2.10. The variation of the total energy loss with respect to frequency for a 3.5 wt. % Si
non-oriented electrical steel with two grain sizes 55 μm and 190 μm ……… 23
Fig. 2.11. The relationship between the grain size and the sulfur content in a 3% Si steel ……. 25
Fig. 2.12. The effect of silicon content on the electrical resistivity (𝜌) and the magnetocrystalline
anisotropy constant (K1) of electrical steels ………. 30
Fig. 2.13. The effect of silicon content on maximum magnetic flux induction (Js) and yield
strength (𝜎𝑦) ……… 30
XVI
Fig. 2.15.The texture key showing the major texture components and fibres on the 2=45° section of
the ODFs (Bunge notation) for bcc materials
……….. 35
Fig. 2.16. The position of the major fibres and texture components in FCC and BCC materials in an Euler space unit cell ……… 36
Fig. 2.17. The fundamental zone of the Rodrigues-Frank space for cubic symmetry. Three typical angle axis pairs plotted are: A: 45° <110>, B: 60° <111> and C: 62.8° <1 1 (√2 − 1 >..39
Fig. 2.18. The colour key for EBSD orientation maps using an IPF representation …………... 40
Fig. 2.19. Hot rolling schemes for electrical steel that undergoes phase transformations …….. 43
Fig. 2.20. The evolution of cold rolling textures for Fe-Si with percentage reduction in the near surface region ………... 45
Fig. 2.21. The evolution of cold rolling textures for Fe-Si with percentage reduction in the central region ………... 46
Fig. 2.22. Orientation distribution density of cold rolled steel and different stages of recrystallization: (a) The α-fibre <110>//RD, and (b) the γ-fibre <111>//ND ……… 49
Fig. 2.23. Orientation distribution density of cold-rolled Si steel fully annealed after being cold rolling by different reductions ………. 50
Fig. 2.24. The texture evolution of non-oriented electrical steel during thermomechanical processing ……… 51
Fig. 2.25. A schematic representation of the cross-rolling process ………. 53
Fig. 2.26. A schematic representation of the inclined rolling process ………. 53
XVII
Chapter 3
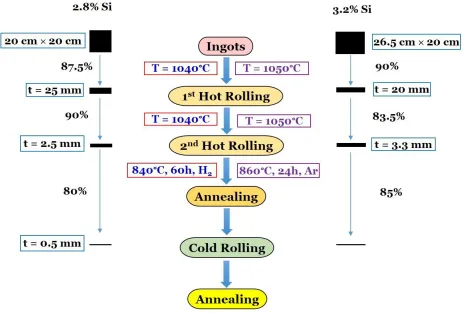
Fig. 3.1. Schematic illustration of the processing steps and parameters used for the two electrical
steels ………. 66
Fig. 3.2. Schematic illustration of the hot band textures and inclined rolling. (a) different textures
developed during hot rolling, (b) rotating the cold rolling direction by Φ= 55° from the hot
rolling direction (HRD) ………67
Fig. 3.3. The microstructures and textures of the hot-rolled 2.8% Si and 3.2% Si electrical steels:
(a) EBSD IPF and IQ maps of the cross-section of the 2.8% Si steel, (b) 2 =45° section of the
ODFs (Bunge notation) of the sample in (a), (c) EBSD IPF and IQ maps of the cross-section of
the 3.2% Si steel, (d) 2 =45° section of the ODFs of the sample in (c) ………. 69
Fig. 3.4. The microstructure and texture of the hot-rolled 2.8% Si steel after annealing: (a) EBSD
IPF map, (b) grain unique color map showing the location of the cube orientation, and (c) 2
=45° section of the ODFs (Bunge notation) of the sample ……….. 70
Fig. 3.5. The microstructure and texture of the hot-rolled 3.2% Si steel after annealing: (a) EBSD
IPF map, (b) grain unique color map showing the location of the cube and rotated Goss
orientations, (c) 2 =45° section of the ODFs (Bunge notation) of the sample ……….71
Fig. 3.6. The microstructure and texture of the cold-rolled 2.8% Si steel: (a) EBSD IPF map, (b)
IQ map showing the location of the cube and rotated Goss orientations, and (c) 2 =45° section
of the ODFs (Bunge notation) of the sample ………... 73
Fig. 3.7. An example of the cube {100}<001> orientation observed in the shear bands of a
XVIII
IPF map at a higher magnification, (c) grain unique color map showing the cube and rotated
Goss orientations, and (d) 2 =45° section of the ODFs (Bunge notation) ………74
Fig. 3.8. The microstructure and texture of cold-rolled 3.2% Si electrical steel: (a) EBSD IPF
map, (b) 2 =45° section of the ODFs (Bunge notation) of the sample ……….75
Fig. 3.9. A fine scan of Region A shown in Fig. 3.8: (a) EBSD IPF map , (b) grain unique colour
map, (c) 2 =45° section of the ODFs (Bunge notation) ………77
Fig. 3.10. A fine scan of Region B in Fig. 3.8: (a) EBSD IPF map , (b) grain unique colour map,
(c) 2 =45° section of the ODFs (Bunge notation) ………... 78
Fig. 3.11. Examples of cube grains at the grain boundaries during partial recrystallization in a
3.2% Si electrical steel: (a) and (b) EBSD IPF map of two different regions, (c) and (d) the
corresponding grain unique colour maps showing the formation of high angle grain boundaries
with respect to the surrounding matrix. Red grains are cube ………... 79
Fig. 3.12. The microstructure and texture of the top layer of the 2.8% Si sheet after hot rolling
and annealing: (a) EBSD IPF map, (b) ϕ2=45° section of the ODFs, (c) 2 =45° section of the
ODFs after rotation by 55° around ND ……… 81
Fig. 3.13. The microstructure and texture of incline cold rolled 2.8% Si electrical steel after 50%
thickness reduction: (a) EBSD IPF map of the full cross-section (RD-ND plane), (b) grain unique
color map showing the locations of the cube and rotated Goss orientations, (c) 2 =45° section of
the ODFs of the sample ……… 82
Fig. 3.14. Region C of Fig. 3.13 showing a deformed rotated Goss grain after 50% cold rolling
reduction: (a) EBSD IPF map, (b) grain unique color map showing the locations of the cube and
XIX
Fig. 3.15. Region D of Fig. 3.13 showing a second deformed rotated Goss grain after 50%
inclined cold rolling reduction: (a) EBSD IPF map, (b) grain unique colour map showing the
locations of the cube and rotated Goss orientations, (c) 2 =45° section of the ODFs (Bunge
notation) ………... 84
Fig. 3.16. High resolution EBSD scans (steps size =50 nm) around shear bands: (a), (b) EBSD
IPF maps, and (c), (d) grain unique color map showing the locations of the cube and rotated Goss
orientations ………... 85
Fig. 3.17. Nucleation of cube grains inside the shearbands of rotated Goss grains during partial
recrystallization of the 2.8% Si steel after inclined cold rolling: (a) EBSD IPF maps, and (b)
grain unique color map showing the locations of the cube and rotated Goss orientations …….. 87
Fig. 3.18. Example of the nucleation of the cube grains at grain boundary of a rotated Goss
grains during partial recrystallization of a 2.8% Si steel after inclined cold rolling: (a) EBSD IPF
map, (b) 2 =45° section of the ODFs ………... 88
Fig. 3.19. The calculated Taylor factors (under plane strain compression) superimposed on the 2
=45° section of the ODFs (Bunge notation) ………. 91
Fig. 3.20. The change of the Taylor factor (M) when the rotated Goss orientation changes to the
cube ……….. 92
Chapter 4
Fig. 4.1. Experimental setup for the tracking of individual crystal rotation during cold rolling
………. 100
Fig. 4.2. Hot rolling texture and microstructure of a 2.8 wt% Si non-oriented electrical steel: a)
XX
distribution functions (2 = 45 sections, Bunge notation) of different regions, and c) location of
the Goss grains in the hot-rolled plate (with a 20° tolerance) ………. 102
Fig. 4.3. Surface region (top of 1050 µm of the sample) of hot rolled steel: a) inverse pole figure
map and the texture, and b) location of the {110}<001> orientation showing both deformed and
equiaxed Goss grains ……….. 103
Fig. 4.4. Microtexture and microstructure after hot rolling and annealing: a) inverse pole figure
map, b) Goss grains present within the microstructure, and (c) textures at the surface and center
regions ………105
Fig. 4.5. The rotation of a Goss grain during cold rolling: a) before rolling, b) after 10% reduction
(first pass), and c) after 20% reduction (second pass). The deformation rotates the Goss grains
about the <110> axis toward {11 11 8}<4 4 11> and {111}<112> ……… 107
Fig. 4.6. Goss grains observed in a 2.8 wt% Si electrical steel after cold rolling: (a) and (b) image
quality maps showing the contrast in dislocation density, (c) and (d) inverse pole figure maps
showing the variation in grain orientations for Type I and Type II Goss grains, respectively, (e)
Rodrigues space showing the misorientations between the Goss orientation and the {111}<112>
neighbouring grains ………109
Fig. 4.7. Goss grains in a cold-rolled 2.8 wt% Si electrical steel: (a) IPF map showing the Type III
Goss grains at the grain boundary, (b) image quality map illustrating the variation of dislocation
density, and (c) kernel average misorientation map showing the inhomogeneity of deformation and
the variation of stored energy ……….. 112
Fig. 4.8. Type III Goss orientation observed in a cold-rolled 2.8 wt% Si electrical steel: (a)
XXI
(b) a schematic illustration of the crystallographic relations between {110}<001> and its
{113}<361> and {111}<112> neighbours ………. 114
Fig. 4.9. Goss grains nucleating at the shear bands of the <111>//ND deformed grains after
annealing at 750 °C for 5 minutes followed by water quenching. The Goss grains are formed at
20°-35° to the rolling direction (RD) ………... 116
Fig. 4.10. Goss grains nucleating at the grain boundaries after annealing at 750 °C for 5 minutes
followed by water quenching. The Goss grains are formed along the boundaries parallel to the
rolling direction ……….. 117
Fig. 4.11. Texture of the 2.8 wt% Si steel after annealing at 750 °C for 10 minutes: (a) EBSD IPF
map, (b) ODF at the 2 =45° section of the Euler space, (c) the texture key showing the locations
of major texture components and fibres including <001> //ND (θ fibre), <111 > //ND (γ-fibre), and
< 110 > //RD (α-fibre) ………. 119
Chapter 5
Fig. 5.1. EBSD inverse pole figure (IPF) map showing the cross-section microstructure and
microtexture of the 2.8% Si non-oriented electrical steel after hot rolling. The ND-RD section
shows banded microstructures and apparent texture inhomogeneity across the sheet thickness
………. 129
Fig. 5.2. φ2=45° sections of the orientation distribution functions (Bunge notation) showing the
textures after hot rolling: (a) texture of the surface regions, (b) texture of the central region, (c)
overall texture across the thickness, (d) texture key showing the major fibres and components, (e)
an area close to the surface showing the grain orientation spread and the textures associated with
XXII
Fig. 5.3. Texture after hot band annealing: (a) EBSD IPF map showing the microstructure and
variation of crystal orientations, (b) overall texture across the thickness, (c) texture of the surface
regions, and (d) texture of the central region ………. 134
Fig. 5.4. Microstructure and texture after cold rolling: (a) EBSD IPF map showing the
microstructure and orientations of the deformed grains, (b) 2 =45° section of the ODF, (c)
comparison of the volume fractions of various components along the -, - and -fibres ……136
Fig. 5.5. EBSD IPF maps after annealing at 750 °C for different times: (a) 10 minutes, (b) 30
minutes, (c) 60 minutes, (d) 90 minutes, (e) 120 minutes, (f) grain size vs. annealing time …. 137
Fig. 5.6. Textures after annealing at 750 °C for different times: (a) 10 minutes, (b) 30 minutes,
(c) 60 minutes, (d) 90 minutes, (e) 120 minutes, (f) texture key for the φ2=45° section of the
ODF ………... 138
Fig. 5.7. An example of the {001}<350> deformed grain observed at the {112}<351> grain
boundary: (a) inverse pole figure map, (b) grain unique color map ……….. 140
Fig. 5.8. Variations of the main texture components on the common texture fibres during the
annealing process: (a) θ-fibre <001>//ND, (b) α-fibre <110>//RD, (c) γ-fibre <111>//ND, (d)
overall volume fractions of the three fibres vs. annealing time ………. 143
Fig. 5.9. Clustering of the Goss ({110}<001>) grains after annealing at 750 °C for 10 minutes:
(a) schematic showing the nucleation of the Goss grains in shear bands, (b) the growth of the
Goss nuclei, (c) EBSD IPF map showing the cluster of the Goss grains, (d) grain unique color
map ………. 147
Fig. 5.10. Variations of the volume fraction of the main recrystallization texture components vs.
annealing time: (a) high-angle boundaries, (b) CSL boundaries. The CSL boundaries include Σ5,
XXIII
Fig. 5.11. Comparison of the average grain sizes of the Goss grains and their neighbours at
different annealing times ……… 149
Fig. 5.12. Variations of grain boundary character of the {001}<350> grains and the other grains:
(a) high-angle boundaries, (b) CSL boundaries ………. 150
Fig. 5.13. Comparison of the average grain sizes of the {001}<350> grains and their neighbours
grains at different annealing times ………. 151
Fig. 5.14. Variations of grain boundary character of the {111}<112> grains and the other grains:
(a) high-angle boundaries, (b) CSL boundaries ………. 152
Fig. 5.15. Comparison of the average grain sizes of the {111}<112> grains and their neighbours
at different annealing times ……… 153
Chapter 6
Fig. 6.1. Schematic of inclined cold rolling and sample cutting from the hot band with angles 0
to 90 to the hot rolling direction (HRD) ………. 162
Fig. 6.2. Optical micrographs showing the microstructures of samples cold-rolled at various angles
to the hot rolling direction: (a) 0, (b) 30, (c) 45, (d) 60, and (e) 90 ……… 164
Fig. 6.3. Optical micrographs of the electrical steel samples (cold rolled at various angles to the
HRD) after annealing at 1023 K (750 C) for 5 minutes followed by furnace cooling ………. 165
Fig. 6.4. Inverse pole figure maps of the electrical steel after annealing at 750C for 5 minutes.
The angle shown in each map was the angle between CRD and HRD during cold rolling ….. 167
Fig. 6.5. Variation of the grain size distribution with respect to the angle between CRD and
HRD. The average grain sizes for the 0, 30, 45, 60, and 90 samples are, 26.7, 23.6, 24.3,
XXIV
Fig. 6.6. Annealing (750C for 5 minutes) textures of the electrical steel cold rolled at various
angles with respect to the HRD. φ2 = 45 sections of the Euler space (Bunge notation). The texture
key shows the locations of major texture components and fibres: C (Cube), G (Goss), B (Brass),
Co (Copper), RC (Rotated cube), RG (Rotated Goss), <001>//ND (θ fibre), <111>//ND (γ-fibre),
and <110>//RD (α-fibre) ………. 171
Fig. 6.7. Variation of the major texture fibres and components with respect to the angle between
the CRD and HRD during cold rolling: (a) typical fibres, (b) texture components. The samples
were annealed at 750C for 5 minutes after cold rolling ………. 173
Fig. 6.8. IPF maps (left) and calculated ODFs (right) of the 45 sample after skin pass rolling at
different thickness reduction rates: (a) 5%, (b) 10%, (c) 15%, and (d) 20%. 2=45 sections of the
ODF’s (Bunge notation) ………. 175
Fig. 6.9. IPF maps (left) and calculated ODFs (right) of the 60 sample after skin pass rolling at
different thickness reduction rates: (a) 5%, (b) 10%, (c) 15%, and (d) 20%. 2=45 sections of the
ODF’s (Bunge notation) ………. 176
Fig. 6.10. Variations of the main texture components (a) and fibre textures (b) with respect to the
reduction rate during skin pass rolling ……… 178
Fig. 6.11. Final annealing textures of the 45 sample after skin pass rolling at different thickness
reduction rates: (a) 5%, (b) 10%, (c) 15%, and (d) 20%. 2=45 sections of the ODF’s (Bunge
notation) ………. 179
Fig. 6.12. Final annealing textures of the 60 sample after skin pass rolling at different thickness
reduction rates: (a) 5%, (b) 10%, (c) 15%, and (d) 20%. 2=45 sections of the ODF’s (Bunge
XXV
Fig. 6.13. Comparison of the changes of volume fractions of the main texture components after
initial annealing (before skin pass rolling), after skin pass rolling, and after final annealing with
(a) 5%, (b) 10%, (c) 15%, and (d) 20% reduction during skin pass rolling ………. 182
Fig. 6.14. Comparison of the changes of volume fractions of the fibre textures after initial
annealing (before skin pass rolling), after skin pass rolling, and after final annealing with (a) 5%,
(b) 10%, (c) 15%, and (d) 20% reduction during skin-pass rolling ……… 184
Fig. 6.15. Maps of the 60 sample after 15% skin-pass rolling: (a) EBSD IPF map, (b)
distribution of the grains with typical fibre textures, and (c) Taylor factor map of the deformed
sample ……… 187
Fig. 6.16. Maps of the 60 sample after 20% skin-pass rolling: (a) EBSD IPF map, (b)
distribution of the grains with typical fibre textures, (c) grain orientation spread map ………. 188
Chapter 7
Fig. 7.1. Schematic illustration of the MBN measurements: (a) measurement locations along the
rolling direction, (b) schematic of the MBN sensor and the magnetization of the sample ……197
Fig. 7.2. Microstructure and microtexture of the 3.2% Si non-oriented electrical steel after hot
rolling: (a) EBSD IPF map of the RD-ND cross section (b) texture of the surface regions, (c)
texture of the central region, (d) texture of the transition region, (e) overall texture across the
thickness, using ϕ2=45° sections of the ODFs (Bunge notation) ………. 198
Fig. 7.3. Microstructure and microtexture after hot rolling and annealing: (a) EBSD IPF map of
the cross section (RD-ND plane), (b) 2 =45° section of the ODFs (Bunge notation) showing the
XXVI
Fig. 7.4. Schematic illustration of the nucleation and growth of new grains in the central region
of the hot-rolled plate during hot band annealing. The preferential growth in the rolling direction
leads to elliptical-shaped grains as seen in Fig. 7.3a ………. 202
Fig. 7.5. Microstructure and texture of the cold-rolled 3.2% Si electrical steel: (a) EBSD IPF
map of the RD-ND cross section, (b) 2 =45° section of the ODFs (Bunge notation) showing the
overall texture across the thickness ……… 202
Fig. 7.6. Microstructure and texture of final annealed steel: (a)-(e) EBSD IPF maps showing the
microstructure after annealing at 750 °C for 180min, 850 °C for 60 min, 950°C for 30 min, 1050
°C for 10 min and 1150 °C for 2 min, (f)-(j) the corresponding textures. The EBSD scans were
performed on the sheet plane at the middle thickness ………... 205
Fig. 7.7. Variations of the texture with respect to the annealing temperature: (a) volume fractions
of the three major texture fibres (α, θ and γ), (b) the ratio of the <100>//ND volume fraction to
the <111>//ND volume fraction ………. 206
Fig. 7.8 Relation between the annealing temperature and the DC core loss ………. 208
Fig. 7.9 The variations of AC core losses at a magnetizing frequency of 50 Hz and 250 Hz with
respect to annealing conditions ……….. 209
Fig. 7.10. The variation of maximum saturation flux and relative permeability with annealing
conditions. (a) Maximum saturation flux at DC conditions (Bs) and maximum flux at 50 Hz (B50)
and (b) relative permeability (µr) ………... 210
Fig. 7.11. Magnetic properties of the 3.2% Si non-oriented electrical steel produced in this study
compared to commercial grain-oriented electrical steel: (a) core losses at different magnetic flux
densities and directions (with a fixed frequency of 125 Hz), (b) core losses at various frequencies
XXVII
Fig. 7.12. The average MBNrms values measured in the rolling direction of the steel strips: (a)
relation between MBNrms and annealing temperature, (b) relation between MBNrms and the
average grain size (d) ……… 212
Fig. 7.13. Schematic illustration of the texture factor Aθ (g) defined as the minimum angle
between the magnetization vector (𝑀⃗⃗ ) and the crystal easy magnetization axes [100], [010] and
[001]. Since 1 is the minimum angle in this example (1< 2< 3) , Aθ (g) would be equal to
1 ……… 214
Fig. 7.14. The texture factors at various directions to the RD (0°) for steel sheets annealed under
different conditions: (a) 750 °C for 180 min, (b) 850 °C for 60 min, (c) 950 °C for 30 min, (d)
XXVIII
LIST OF ABBREVIATIONS/SYMBOLS
AC Alternating current
ASTM American Society for Testing and Materials
BCC Body centered cubic
CRD Cold rolling direction
CSL Coincident site lattice
DC Direct current
EBSD Electron backscatter diffraction
EV Electric vehicles
FCC Face Centered Cubic
GND Geometrically necessary dislocations
GOES Grain oriented electrical steel
GOS Grain orientation spread
HRD Hot rolling direction
IPF Inverse pole figure
IQ Image quality
KAM Kennel average misorientation
K-S Kudjomov-Sachs
MBN Magnetic Barkhausen noise
ND Normal direction
NOES Non-oriented electrical steel
XXIX
ODF Orientation distribution function
OIM Orientation imaging microscopy
RD Rolling direction
RMS Root mean square
RF Rodrigues-Frank space
SEM Scanning electron microscopy
TD Transverse direction
XXX
NOMENCLATURE
H Magnetizing field (A/m)
B Flux density (T)
µ Permeability (H/m)
𝜇0 Permeability of free space (H/m)
χ Magnetic susceptibility
J Magnetic polarization (T)
I Current (A)
Φ𝐵 Magnetic flux (Wb)
ℰ Electromotive force, EMF (V)
Wt Total energy core loss (J m⁄ 3)
Wh, Hysteresis energy loss (J m⁄ 3)
Wcl Classical eddy current energy loss (J m⁄ 3)
Wexc Excess energy loss (J m⁄ 3)
Pt Total power loss (W/Kg)
Ph Hysteresis power loss (W/Kg)
Pe Excess power loss (W/Kg)
K1 Magnetocrystalline anisotropy constant ((J m⁄ 3)
µB Bohr magneton
𝜌 Electrical resistivity (Ω · m)
d Grain size (μm)
𝜎𝑦 Yield strength (MPa)
ϕ1 First Euler angle (°)
Φ Second Euler angle (°)
ϕ2 Third Euler angle (°)
XXXI Aθ Texture factor (°)
α <110>//RD fibre
γ <111>//ND fibre
θ <100>//ND fibre
Bs Saturation flux (T)
µr Relative permeability
f Magnetizing frequency (Hz)
𝑀⃗⃗ Magnetization vector (A/m)
𝐸 Magnetocrystalline energy (J m⁄ 3)
𝑓(𝑔) Orientation distribution function
𝑉𝑓 Volume fraction
𝑅 Rodrigues vector
1
Chapter 1 Introduction
Non-oriented electrical steel (NOES) is an indispensable soft magnetic material for
applications in rotating machines, generators, electric vehicles, actuators, alternators, etc.
Although a specific crystallographic orientation, like the Goss ({011}<100>) in grain-oriented
electrical steel, is not designated to be produced in the material, the crystal axes of the final steel
sheets are actually desired to be aligned to the magnetization directions of the magnetic core, in
order to reduce core loss and increase permeability. Thus, crystallographic textures that can
enhance the magnetic properties of the lamination are highly demanded. Although it has long been
recognized that optimizing the crystallographic texture of non-oriented electrical steel can improve
the efficiency of the electric motors, limited improvement of the magnetic quality of the steel has
been achieved through texture optimization. This is because the final texture of the steel sheet is
affected by all the thermomechanical processing steps used to produce the thin sheets, and the
metallurgical mechanisms that govern the evolution of texture during thermomechanical
processing have not been completely understood.
The objective of this research is to improve the magnetic properties of non-oriented
electrical steels through the optimization of crystallographic texture. Focus was placed on the final
annealing process to understand the formation mechanisms of specific textures and how to control
them. In addition to changing the operational parameters during conventional rolling and annealing
processes, a special rolling scheme, i.e. inclined rolling, has been used to investigate the formation
mechanisms of the cube texture – a texture of particular interest for non-oriented electrical steels.
Electron backscatter diffraction (EBSD) techniques were employed as the main characterization
2
important for the understanding of nucleation and grain growth. The magnetic properties of the
produced steel sheets were measured by standard Epstein frame method and compared to
commercially available electrical steel grade. Local magnetic response of the electrical steel was
also investigated by magnetic Barkhausen noise (MBN) analysis. A texture factor was utilized to
evaluate the anisotropy of the steel sheets in various directions. Non-oriented electrical steels with
silicon concentrations varying from 0.9 to 3.2 wt% were studied. All the steel processing was
carried out using pilot-scale facilities under controlled conditions, the results obtained may be
directly utilized in industrial mass production after validation tests.
The findings of this dissertation were presented in scientific journal publication formats in
Chapters 3 to 7, and a summary of the contributions to knowledge was given at the end of the
dissertation (Chapter 8). A literature review was presented in Chapter 2 to introduce background
information about this research. The following summarizes the structure of the dissertation and
briefly introduces the content of each Chapter.
Chapter 2: A literature review that introduces the material to be studied and the history of related
research in this field. It also includes discussion on the different types of core losses in
non-oriented electrical steels and their relations to the material’s chemistry, dimension, microstructure
and texture, which provides background information and motivation for the current research.
Chapter 3: The formation mechanisms of the cube ({001}<001>) texture during annealing of high
silicon (2.8-3.2 wt%) non-oriented electrical steels were investigated under conventional rolling
and inclined rolling conditions. Two origins of the cube orientations were identified, either at the
3
Goss) grains. The formation of the cube volumes within the deformed matrix was attributed to the
partial retention of the original cube grain during plane-strain compression (cube at grain
boundaries), or to the geometric softening of the rotated Goss through the formation of shear bands
(cube at shear bands). The formation of recrystallized cube grains after annealing was due to the
nucleation of the small low-stored-energy cube volumes in the deformed matrix after cold rolling.
These mechanisms provide potential technical routes to producing the cube texture in non-oriented
electrical steels.
Chapter 4: The origins of the Goss grains in a cold-rolled non-oriented electrical steel (2.8 wt%
Si) were investigated using electron backscatter diffraction (EBSD) techniques. Three locations of
the Goss grains were observed in the deformed matrix, i.e. those within the shear bands of two
symmetrically equivalent {111}<112> grains, those embedded in the microbands of one of the
{111}<112> grains, and those at the grain boundaries between the {111}<112> and {113}<361>
grains. The formation mechanisms of these three types of Goss grains during plane-strain
deformation were explained using the transition band model and the rigid inclusion model by
considering their specific crystallographic orientation relationships with respect to the surrounding
deformed matrix. The formation of the clusters of Goss grains in the recrystallized steel was
explained by an oriented growth theory due to the Goss nuclei formed at the {111}<112> and
{113}<361> grain boundaries having special ~35<110> misorientations with respect to their
neighbours and having high mobility.
Chapter 5: A 2.8 wt% Si non-oriented electrical steel was thermomechanically processed using
4
of texture during these processes was investigated. The final annealing was conducted at 750C
for various times (10 to 120 minutes), and it was found that by simply changing the annealing
time, the texture showed significantly different features, i.e. depending on the annealing time, the
Goss ({011}<100>), the -fibre (<001>//normal direction, ND) or the -fibre (<111>//ND) may
dominate the texture. Annealing for 60 or 90 minutes can essentially eliminate the magnetically
unfavourable <111>//ND texture while promoting the desired <001>//ND texture. On the other
hand, annealing at the same temperature for 30 or 120 minutes, the <111>//ND texture is
strengthened and the favorable <001>//ND texture is weakened. The formation of the typical
textures observed in each process was examined with respect to known mechanisms existing in
the literature. The formation of the various textures during annealing at different times was
discussed against the oriented growth theory based on a statistic analysis of the grain boundary
misorientation and grain size. It is seen that during annealing at different times, the grain boundary
character (e.g. mobility) and the grain size may determine the growth of certain orientations, which
give rises to the different textures after annealing for different times.
Chapter 6: In order to promote the magnetically favourable <001>//ND texture (θ-fibre) and
minimize the unfavourable <111>//ND fibre (γ-fibre) in non-oriented electrical steel, an
unconventional cold rolling scheme was employed in this study, in which the cold rolling was
carried out at an angle (i.e. 30, 45, 60, and 90) to the hot rolling direction (HRD). After
annealing, two steel sheets (i.e. those after cold rolling at 60 and 45 to the HRD) were found to
have considerably different textures from other sheets, i.e. showing the strongest and the weakest
-fibre textures, respectively. These two sheets were then subjected to skin pass rolling to various
5
texture. It was found that during skin pass rolling, the cube texture ({001}<100>) was gradually
weakened and the rotated cube orientation ({001}<110>) was strengthened. With the increase of
the reduction rate, the {112}<110> orientation on the -fibre became a major component. Upon
final annealing, the cube texture was slightly restored, but the volume fraction was considerably
lower than that before skin pass rolling.
Chapter 7: A 3.2% Si non-oriented electrical steel (NOES) was processed using conventional
rolling routes. The hot-rolled plate was annealed at 860C for 24 hours and cold rolled to a
thickness of 0.35 mm. The cold-rolled sheets were subjected to final annealing at various
temperatures ranging from 750 C to 1150 C. The evolution of texture during all the
thermomechanical processing stages was investigated by electron backscatter diffraction
techniques (EBSD). It was found that the annealing temperature had a profound effect on the
texture. At higher temperatures and shorter holding times, the desired <100>//ND texture was
promoted while the detrimental <111>//ND texture was weakened. The magnetic properties of the
steel sheets were measured by Epstein frame method, and it was found that the AC core loss of the
NOES annealed at 850C for 60 minutes was comparable to grain-oriented electrical steel (GOES)
with the same silicon content, even in the rolling direction.
6
Chapter 2 Literature Review
2.1 Magnetic materials
Magnetic materials can be classified into three major groups (Fig. 2.1): 1) hard magnetic
materials, 2) soft magnetic materials, and 3) magnetic recording materials. Hard magnetic
materials are a class of materials that are hard to magnetize and demagnetize. These materials have
high coercivity and hysteresis, and can be used to make permanent magnets. Soft magnetic
materials are materials that are easy to magnetize and demagnetize, and have substantially lower
coercivity and hysteresis. Soft magnetic materials are also distinguished from other magnetic
materials by their high permeability and low energy loss [1-5]. Their coercivity is of the order of
~40 A/m (close to the earth’s magnetic field strength) [5]. Magnetic recording materials are a
subclass of hard magnetic materials and are sometimes referred to as “semi-hard magnets”.
7
Soft magnetic materials have been widely used for more than 100 years for the generation,
conversion, and distribution of electricity. They have been employed in heavy-duty flux
multipliers as the core material for transformers, motors and generators. Additionally, they have
also been used as light-duty flux multipliers for small transformers and inductors. The approximate
market value of soft magnetic steels was €20 billion in 2015, with an approximate annual growth
rate of 5% [5].
Soft magnetic materials can be further divided into several subclasses such as: Fe-Si steels,
amorphous soft magnets, soft ferrites, nickel-iron (Permalloy), cobalt-iron, etc. (Fig. 2.2). Fe-Si
alloys are the most widely used soft magnetic materials in the market today. They are referred to
as electrical steels or silicon steels, and are subdivided into non-oriented electrical steel (NOES)
and grain-oriented electrical steel (GOES) [1-5]. GOES became the material of choice for
transformers after the development of the Goss process in the 1930s [5, 6]. This steel exhibits
remarkable magnetic properties (high permeability, high flux saturation and low core loss) in the
rolling direction (RD), but is highly anisotropic and expensive to process, which is not ideal for
rotating machine applications. On the other hand, non-oriented electrical steels are much more
suitable for rotating machines (motors and generators) due to their much more isotropic magnetic
properties. NOES is the focus of this thesis, and the final applications include conventional electric
8
Fig. 2.2. The subclasses of soft magnetic materials and their market shares [5].
2.1.1 Non-oriented electrical steel (NOES)
Non-oriented electrical steels come in a variety of grades and their specifications are
defined in several standards, including ASTM A677 [9], IEC 60404-8-4, IEC 60404-8-6, and IEC
60404-8-8 [5]. The material designation is given based on the steel sheet’s thickness as well as the
alternating current (AC) power loss (in W/kg) at a frequency of 50 Hz and a peak induction of 1.5
T. For example, a non-oriented electrical steel sheet with a designation of M250-35A has a sheet
thickness of 0.35 mm and a power loss of 2.50 W/kg at a frequency of 50 Hz and a peak induction
of 1.5 T. The American standards and designations [9] are slightly different. The core loss
according to the ASTM A677 is measured at 1.5 T and a frequency of 60 Hz, and the loss is
reported in W/lb. The same non-oriented steel mentioned earlier would have the designation of
36F145, which means a thickness of 0.36 mm and a power loss of 1.45 W/lb at 60 Hz and a peak
9
Non-oriented electrical steels can either be fully processed (higher grades) or
semi-processed (lower grades with Si < 2 wt %). The fully semi-processed NOES are usually hot rolled to a
thickness of ~2.5 mm, and then cold rolled to an intermediate gauge. This is followed by an
intermediate anneal and a second cold rolling process to obtain the required thickness. The
two-stage cold rolling procedure and the intermediate anneal are the main defining features of the fully
processed NOES [5-8, 10]. The steel sheets are then subject to decarburization annealing and grain
growth annealing to obtain the required grain size. An insulating coating is finally applied to the
steel sheets before punching and core assembly. The fully processed NOES generally does not
undergo stress-relief heat treatment after punching. On the other hand, semi-processed NOES is
processed through single-stage cold rolling followed by annealing and skin pass rolling (temper
rolling) with a reduction between 4% and 12% [10]. The steel sheets are coated by the steel
producer, but the punching and the final stress relief annealing are left to the customer. The final
stress-relief annealing is vital in achieving the required grain size and the desired final magnetic
properties [5-8, 10]. The typical thermomechanical procedures for fully processed and
10
Fig. 2.3. Common processing steps for fully processed non-oriented electrical steels.
Melting, degassing and casting
Reheating and hot rolling
Pickling and hot band annealing
First cold rolling and intermediate annealing
Final cold rolling
Decarburization and final annealing
Insulation coating
Punching
11
Fig. 2.4. Typical processing steps for semi-processed non-oriented electrical steels.
The major alloying element in non-oriented electrical steel is silicon, with a concentration
varying between 0 and ~3.5 wt %. Silicon has a substantial effect on the electrical, magnetic and
mechanical properties of the electrical steel, which is discussed separately in the following
Melting, degassing and casting
Reheating and hot rolling
Pickling and hot band annealing
Cold rolling and intermediate annealing
Skin pass rolling (temper rolling)
Insulation coating
Punching (by customer)
Annealing (by customer)
12
sections. Other minor alloying elements include: aluminum (0.2-0.8 wt%), manganese (0.1-0.3 wt
%), and sometimes antimony. The top commercial grades of NOES has ~4.0 wt % (Al + Si) if it
is processed conventionally. The addition of Si, Al and Mn increases the material’s electrical
resistivity and thus reduces the eddy current loss. On the other hand, aluminum prevents magnetic
aging through N precipitation, and lowers the primary recrystallization temperature. Manganese is
used to capture the residual sulfur impurities from thermomechanical processing through the
formation of MnS precipitates. The magnetic and mechanical properties of NOES are also strongly
affected by impurities, thus the steel is required to maintain very low levels of C, O, N and S
[5-8].
Despite what the name might suggest, the magnetic properties of non-oriented electrical
steels are actually NOT isotropic. The magnetic properties of NOES vary by 10-20% along
different directions due to the magnetocrystalline anisotropy of bcc iron and the final
crystallographic texture of the steel sheet. They are preferred for high efficiency applications that
involve high power rotating machines. The semi-processed sheets have a typical thickness between
0.50 mm and 0.65 mm, while the fully processed grades range from 0.10 mm to 0.65 mm. The
reduction in sheet thickness is necessary for high efficiency applications, since it leads to a
decrease in eddy current loss. The decrease of eddy current loss may be limited by the Si
concentration (usually up to 3.5%), since Si addition lowers the ductility of the material, and the
final sheet thickness that can be achieved by cold rolling is limited. Thus, the competing effects of
the chemical composition, texture, microstructure as well as mechanical properties on the final
magnetic properties require an optimized process to obtain the desired magnetic properties for a
13
2.2 Fundamentals of magnetism and magnetic properties
The magnetic flux density, or sometimes referred to as magnetic induction B, is measured
in Tesla (T), and is related to the magnetic field strength H (measured in Am-1), through the
permeability µ (H m-1), of the material. The relationship between the magnetic induction and the
magnetic excitation is expressed as [1-4]:
𝑩 = 𝜇 𝑯 (2.1)
It should be noted that both H and B are vectors, and in free space (vacuum or air) they have the
same direction. The permeability in free space is a constant, 𝜇𝑜 = 1.257 10-6 Hm-1, thus 𝑩 =
𝜇0 𝑯.
If there is a ferromagnetic material in the free space, the application of a magnetic field H
results in the creation of a magnetization M in the ferromagnetic material by the realignment of
the magnetic domains, i.e. a magnetic polarization (with an intensity of J) is created:
𝑱 = 𝜇𝑜𝑴 (2.2)
Thus the overall magnetic flux density is calculated as:
𝑩 = 𝜇𝑜𝑯 + 𝑱 = 𝜇𝑜(𝑯 + 𝑴) (2.3)
Magnetic susceptibility, χ, is another constant that measures the extent to which a material
can be magnetized by an external magnetic field, i.e.
𝜒 =𝑀
𝑯 (2.4)
Thus
𝑩 = 𝜇𝑜(𝑯 + 𝑴) = 𝜇𝑜(1 + 𝜒)𝑯 = 𝜇𝑜𝜇𝑟𝑯 (2.5)
where µ𝑟 = 1 + 𝜒 is the relative permeability of the material, thus
14
Both relative permeability and susceptibility are material properties, based on which a
material can be classified into diamagnetic, paramagnetic, ferromagnetic, ferrimagnetic, or
antiferromagnetic, etc. [1-4]. Table 2.1 shows the relative susceptibility of various materials and
their classifications.
Table 2.1. The susceptibility or relative permeability values of some diamagnetic, paramagnetic,
15
2.3 Core losses
Core loss is also known as iron loss, which is the energy loss caused by the alternating
magnetization of the magnetic core usually made of iron (electrical steel). The total iron loss at
every cycle of magnetization for a given frequency f can be written as [1-5, 14]:
𝑊(𝑓) = 𝑊ℎ+ 𝑊𝑐𝑙(𝑓) + 𝑊𝑒𝑥𝑐(𝑓) (2.7)
where 𝑊ℎ is the static (DC) hysteresis core loss which is independent of frequency f, 𝑊𝑐𝑙(𝑓) is the
classical eddy current loss, and 𝑊𝑒𝑥𝑐(𝑓) is the excess loss. The area of the hysteresis loop
represents the energy loss during the magnetization and demagnetization process [5, 14].
2.3.1 Hysteresis loss
Before magnetization, the electrical steel is magnetically neutral, i.e. there is no magnetic
field in the material. This is due to the fact that the magnetic domains are randomly oriented in the
material, and their overall magnetic effects cancel each other. This is referred to as the
demagnetized state in which the current (I) is I=H=0. As the material is magnetized through an
external magnetic field (H), the domains that have their magnetic axis aligned with the external
magnetic field direction grow at the expense of those that are misaligned along the magnetization
direction.
Fig. 2.5 shows a typical hysteresis loop (B-H curve) corresponding to the magnetization
and demagnetization processes. The initial magnetization follows the OABC route until the
material reaches saturation (point C), where a maximum magnetic flux density Bm is reached [13].
If now the magnetizing force is reduced to zero (I = 0), the material will not return to the initial
neutral state, i.e. a residual flux density Br will remain in the material, which is called remnant
16
in the opposite direction has to be applied. The magnitude of H required to remove the residual
flux density is referred to as coercivity (or coercive force), Hc (point E). Furthermore, when the
magnetization force is applied in the opposite direction, the material becomes magnetized with an
opposite polarity until saturation is reached again (point F). The closed loop CDEFGC is called a
hysteresis loop and the enclosed area is proportional to the energy loss. The equation for the
hysteresis loss can thus be written as [13]:
𝑊ℎ = ∮ 𝐻𝑑𝐵 (2.8)
which can be estimated using the following empirical formula [13]:
𝑊ℎ = 𝐾ℎ(𝐵𝑚)𝑥 (2.9)
17
Fig. 2.5. Hysteresis loop showing the relationship between magnetizing field H and the flux
density B [13]
2.3.2 The eddy current loss
Non-oriented electrical steels are often used under alternating current (AC) conditions,
meaning that the magnetic properties have to be quantified under time-varying magnetic flux
density (often in sinusoidal format). Therefore, using Faraday’s law the magnetic flux can be
18
Φ𝐵 = ∬ 𝐵(𝑟, 𝑡) ∙ 𝑑𝐴 1
Σ(𝑡)
(2.10)
where Φ𝐵 is magnetic flux, dA is an element of a moving surface Σ(𝑡), and B(r, t) is the magnetic
flux density. Faraday’s law of induction indicates that with any change in the magnetic flux over
time an electromotive force, EMF, will be induced in the coil. The EMF (ℰ) can be written as
[1-4]:
ℰ = −𝑑Φ𝐵
𝑑𝑡 (2.11)
This EMF results in circulating current known as eddy current that flows inside the material, which
in turn results in eddy current loss. This energy loss can thus be calculated from the
Maxwell-Faraday equation by assuming a very thin, infinite sheet with a constant permeability as well as a
time-varying alternating flux. The eddy current loss can be written as [5, 14]:
𝑊𝑐𝑙(𝑓) = 𝜋 2
𝑘 𝜎𝑑 2𝐵
𝑚2𝑓 = 𝜋2 𝑘𝜌𝑑
2𝐵
𝑚2𝑓 (𝐽 𝑚⁄ 3) (2.12)
where d is the sheet thickness, 𝜎 is the electrical conductivity, 𝜌 is electrical resistivity, Bm is the
peak flux density, f is frequency, and k is a constant depending on the magnetization waveform,
which is often taken to be 6 if the wave has a sinusoidal form for an infinitely wide sheet.
2.3.3 The excess loss
The excess loss is also known as the anomalous loss. The exact origin of the excess loss
remains a subject of debate in the literature. It is generally accepted that the excess loss arises from
motion of large domains. Since the excess loss arises from the motion, creation and annihilation
of magnetic domains, some researchers have suggested that 𝑊ℎand 𝑊𝑒𝑥𝑐might be caused by the
![Fig. 2.1. The types of magnetic materials and their market shares [5].](https://thumb-us.123doks.com/thumbv2/123dok_us/1498737.1183516/38.612.124.518.425.662/fig-types-magnetic-materials-market-shares.webp)
![Fig. 2.2. The subclasses of soft magnetic materials and their market shares [5].](https://thumb-us.123doks.com/thumbv2/123dok_us/1498737.1183516/40.612.85.530.98.320/fig-subclasses-soft-magnetic-materials-market-shares.webp)


![Fig. 2.24. The texture evolution of non-oriented electrical steel during thermomechanical processing [61]](https://thumb-us.123doks.com/thumbv2/123dok_us/1498737.1183516/83.612.79.531.277.556/fig-texture-evolution-oriented-electrical-steel-thermomechanical-processing.webp)