ABSTRACT
LINING DONG, Graphic User Interface Design and Rule-based Home Energy Manage-ment Algorithm DevelopManage-ment for Home Energy ManageManage-ment Systems. (Under the direc-tion of Dr. Ning Lu)
This research focuses on the development of graphic user interface as well as a
rule-based peak-shaving algorithm for the FREEDM smart home energy management
(HEM) system. The HEM system consists of a Matlab-based home appliance modules
database, an algorithm engine, and a graphical parameter input and output display
inter-face. The designing and implementation of a graphical user interface which considers
both technical constraints and customer usability is critical because the parameters
input-ting process are not intuitive for homeowners and the visualization of home energy use
helps to inform the homeowners’ energy decisions. It is critical that a user friendly
graph-ical interface is designed and implemented considering both the techngraph-ical necessity and
the customer usability. The contributions of the thesis are three-fold. First, a graphical
us-er intus-erface is designed and implemented to support the algorithm development. Second, a
rule-based HEM algorithm is developed for dynamically managing the home energy
consumption. Third, a HEM architecture is developed to host the development of future
HEM algorithms rather than the one developed in this thesis. The HEM graphical
inter-face and the rule-based HEM algorithm are currently in use to support the FREEDM
© Copyright 2015 by Lining Dong
Graphic User Interface Design and Rule-based Home Energy Management Algorithm Development for Home Energy Management Systems
by Lining Dong
A thesis submitted to the Graduate Faculty of North Carolina State University
in partial fulfillment of the requirements for the degree of
Master of Science
Electrical Engineering
Raleigh, North Carolina 2015
APPROVED BY:
_______________________________ _______________________________
Dr. Aranya Chakrabortty Dr. David Lubkeman
________________________________
Dr. Ning Lu
ii
DEDICATION
To my parents and my future family.
To teachers who nourished me with knowledge.
BIOGRAPHY
Lining Dong was born in Hohhot, Inner Mongolia, China. He received his Bachelor of
Engineering degree in Electrical Engineering and Automation from South China
Univer-sity of Technology in May 2013. He started to pursue a Master of Science degree in
Elec-trical Engineering at North Carolina State University in August 2013. His research
inter-ests include design and developing home energy management algorithms and modeling
ACKNOWLEDGEMENTS
This research was supervised by Dr. Ning Lu at North Carolina State University. I am
very grateful for her guidance in defining the research topics, developing the
methodolo-gies, and analyzing the results. I am also immensely grateful to Jiahong Yan for his
self-less help to work with me implementing and testing control algorithms and developing
the interface of the graphical user interface for the FREEDM smart house test system. I
want to show my gratitude to Dr. David L. Lunkeman at North Carolina State University
for sharing his pearls of wisdom with me during the course of this research. I also want to
thank my fellow graduate students: Gonzague Henri, David Mulcahy, Xiangqi Zhu, and
Jian Lu for reviewing the thesis and providing me with many valuable comments that
TABLE OF CONTENTS
LIST OF TABLES……….………..………..…vi
LIST OF FIGURES……….………..………..…vii
CHAPTER 1 INTRODUCTION ... 1
1.1 Background ... 1
1.2 Requirements for the HEM GUI Design ... 2
1.3 Requirements for the HEM Software Architecture ... 2
1.4 Requirements for the Rule-Based Control Algorithm ... 3
1.5 Data Preparation ... 4
CHAPTER 2 HEM GUI DESIGN AND IMPLEMENTATION ... 5
2.1 Input Parameters ... 6
2.2 Output and Operation Status Display ... 11
CHAPTER 3 HEM SOFTWARE ARCHITECTURE... 15
3.1 Database Design of the HEM ... 15
3.2 Information Flows in the HEM System ... 18
CHAPTER 4 RULE-BASED CONTROL ALGORITHM ... 20
4.1 Problem Formulation ... 20
4.2 Modeling Approach and Algorithm Design... 21
4.3 Simulation Results for One Simulation Run ... 30
4.4 Simulation Results for Multiple Simulation Runs ... 32
LIST OF TABLES
Table 4.1. Probability of use for appliances for weekend ... 22
Table 4.2. Results for evaluation influence on power grid and appliances ... 34
LIST OF FIGURES
Figure 1.1. The software architecture of the FREEDM HEM GUI ... 3
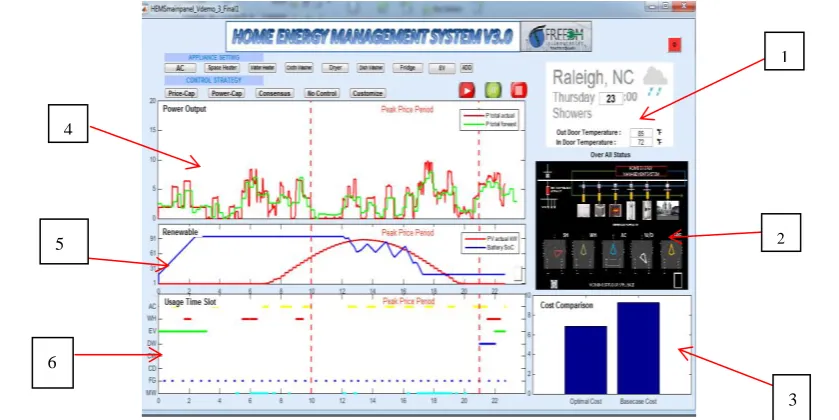
Figure 2.1. The main window of the FREEDM HEM GUI ... 5
Figure 2.2. Air Conditioner modeling parameters [31] ... 6
Figure 2.3. Air Conditioner parameters setup interface ... 7
Figure 2.4. Space heater parameters setup interface ... 7
Figure 2.5 The temperature profile of a water heater unit ... 8
Figure 2.6 Water heater parameters setup interface ... 8
Figure 2.7 Fridge parameters setup interface ... 9
Figure 2.8 Electric vehicle parameters setup interface ... 10
Figure 2.9 Parameters setup interface for adding appliances ... 10
Figure 2.10 Time schedule setup interface for controllable loads ... 11
Figure 2.11 Control strategy selection interface ... 11
Figure 2.12 General information display ... 12
Figure 2.13 Appliance Operation Status ... 12
Figure 2.14 Cost comparison window ... 13
Figure 2.15 Power output monitoring ... 13
Figure 2.16 Battery output and solar generation output window ... 13
Figure 2.17 Appliance operation status ... 14
Figure 3.1. Configuration of a HEM system ... 15
Figure 3.2. Input database structure for HEM system ... 16
Figure 3.3. Output database structure for HEM system ... 17
Figure 3.4. Input preference database structure for HEM system ... 18
Figure 3.5. Information flow between HEM system and GUI ... 19
Figure 4.1. The operation of a range surface unit between 6:00 a.m. and 7:00 a.m. . 22
Figure 4.2. Thermal behavior of space heater [34] ... 24
Figure 4.3. Thermal behavior of water heater [33] ... 25
an example of the daily load profile in winter season ... 25
Figure 4.5. Switch status of the appliances in HEM system for 24 hours ... 27
Figure 4.6. Control logic for rule-based control algorithm ... 28
Figure 4.7. Temperature profiles of the cold, mild, and warm days... 30
Figure 4.8. Load profiles without control and with control ... 31
Figure 4.9. Temperature profiles of appliances without control and with control ... 31
Figure 4.10. Switch Status of appliances without control and with control ... 31
Figure 4.11. Duration and Peak Power distribution for a cold day with heavy loading (8kW power cap) ... 36
INTRODUCTION
CHAPTER 1
1.1 Background
In recent years, environmental awareness and the limitation in fossil fuel storage greatly encouraged the development of renewable generation resources. In 2020, the renewable penetration in many states in the United States are expect to reach 20% or higher. Rooftop photovoltaics (PVs) are expected to be affordable to many residential home owners, as well as the advanced home-automation devices. In addition, the wide deployment of smart meters has enabled the utilities to implement variable electricity prices at retail lev-el. Thus, the consumers are going to be charged at different rates depending when and how much they use electricity at different time of the day. Therefore, it is important for home owners to have a home energy management system that can track and automatically schedule the energy use and inform the consumer what the options are for different con-sumption patterns.
At the FREEDM center in North Carolina State University, a smart house test system is developed. The hardware implementation of the smart house includes a number of con-trollable and non-concon-trollable home appliances supplied by an ac/dc mixed power source. The smart home can be connected to rooftop PVs and energy storage devices (ESD). A HEM system [1] is used to control the operation of the controllable load resources and the distributed energy resources such as the PV and ESD. A software test system is imple-mented in Matlab. HEM algorithms will first be developed and tested on the software test bed and then implemented in the hardware test bed.
Because the algorithms and the parameter settings are all coded in Matlab, it is hard for the HEM users to understand and change the appliance and control algorithm settings. The output of the HEM has to be processed by Matlab and there is no standardized way to compare results obtained by different algorithms or under different operation conditions. Therefore, the design and implementation of a graphical user interface becomes critical for the further development of the FREEDM smart home test system.
1.2 Requirements for the HEM GUI Design
This section introduces the design requirements for the HEM GUI.
In recent years, HEM has drawn great attentions from researchers all over the world be-cause of the potential of controlling loads for energy savings and improved efficiency. However, little has been done in the area of graphical interface design. In [37-39], the authors described a few methodologies of graphic user interface design and its functional-ity but the focus of the GUI is not on home-level energy management and the developed GUI cannot be used as a common platform for algorithm design and testing. Therefore, in my thesis, I focused my effort on design and implement a Matlab-based GUI that can be used by algorithm developers for testing their algorithms and comparing results between algorithms. The general settings of the HEM include the following. The house is a sin-gle-family home that powered by a solar PV with an energy storage device and an electric vehicle. Each operation period is 24 hours, starting from the midnight today to the mid-night the next day. The time step is 1-minute. There are three rate structures considered: flat rate, time-of-use, and critical-peak-price.
The requirements for the HEM GUI design are:
Provide a parameter setting interface for HEM controllable appliance modules. The HEM controllable appliance database is categorized into two categories based on the appliance characteristic: thermostatic controllable appliance (TCA) and thermostatic non-controllable appliance (non-TCA). The TCA loads include an air conditioning unit, a space heating unit, a water heater and a refrigerator. The non-TCA loads in-clude cloth washer, dryer, and dishwasher.
Provide a parameter setting interface for distributed energy resource (DERs) [4] modules. The DEM DER modules include a rooftop PV, a battery, and an electricity vehicle.
Provide an input module that receives the utility prices, weather information (e.g. outdoor temperatures and humidity), and utility control signals (peak-shaving, etc.)
Provide output displays that highlight the actual and forecasted house energy con-sumption, utility rates and payments, the status reports for controllable and observa-ble appliances and distributed generation resources, the healthiness report of the de-vices.
Select algorithms and make comparisons for different what if scenarios.For example: when running an EMS algorithm, the user can compare the cost savings with the base case (the no-control case) through a side-by-side chart provided by the GUI.
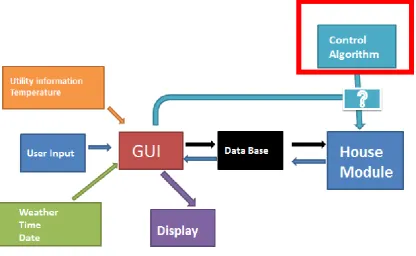
1.3 Requirements for the HEM Software Architecture
response commands), the weather service provider (e.g. temperature, humidity, wind speed, solar radiation), and the consumer’s input settings (e.g. the appliance settings) will be stored in the HEM database [5]. A house module contains the appliance models and the simulation engine. The parameters of the appliance models can be changed through the GUI and sent back to the HEM database. Algorithms are the engines of the HEM system and algorithm selections are made through the GUI.
Once an algorithm is selected, the user can hit the run button to call the appliance model parameters from the data base, run the algorithm, and generate simulation results, which are saved and sent back to the data base. Next, the GUI will display the results by reading data from the data base. This process allows the algorithm developers to develop and im-plement their algorithm independently to the HEM system and compare the results gener-ated by their algorithms through monitoring the results displayed by the GUI.
Figure 1.1. The software architecture of the FREEDM HEM GUI
1.4 Requirements for the Rule-Based Control Algorithm
The HEM system could simulate power consumption status of a residential house, how-ever, in daily life the house owner will not pay much attention about how to reduce un-necessary energy use or avoid high electricity use during high electricity market price
simulated houses have some spike during the day, which represents that several ap-pliances are operating at that time. These high density energy use will not only cost house owner more money but also make the transformer suffer more stress. Thus an algorithm is developed to reduce the spike for high density electricity use.
The requirements for the rule-based control algorithm [6] are:
Reduce the spike occurring during the day to a specific power limit. Reduce the influence of comfort level for residents in the house.
Test the robustness of algorithm by implementing it in house load with different characteristics.
Generate and evaluate the simulation results and find the most optimal scenarios.
1.5 Data Preparation
The HEM system needs specific data inputs to initialize the simulation. The main data Inputs include:
Utility information including a flat-rate electricity price, hourly time-of-use prices (predefined), real-time critical-peak prices (updated every 5 minutes), and peak pow-er control signals.
Weather information including hourly temperature profiles, humidity, and solar radia-tion.
Predefined appliance power ratings in the current HEM system design
The appliance operation status such as the minimum run time, minimum down time, probability of use [7], etc. are predefined so that the comparison of algorithms can be carried out on a fair basis.
HEM GUI DESIGN AND IMPLEMENTATION
CHAPTER 2
This chapter presents design considerations and basic functionalities of the HEM GUI. The HEM system processes input information ranging from consumer-determined appli-ance parameters to utilities pricing and control commands as well as setup parameters of HEM control algorithms. The HEM serves as not only as an energy use dashboard that provides customers cost and billing information but also a situation awareness tool that alerts customers possible malfunctions of home appliances and home-owned distributed energy resources. Different from interfaces used by algorithm developers who understand how the system operates, a customer HEM GUI needs to be visually pleasant, easy to use, and compact so that even users with little knowledge about the HEMS can quick under-stand how to set up the HEM and interpret HEM results through a limited number of dis-play windows. Because the users of the HEM GUI for the FREEDM smart house are a mixed group of HEM algorithm developers and students who serve as customers for test-ing the HEM algorithm setttest-ings, the HEM GUI needs to accommodate both kinds of us-ers. Therefore, I designed a HEM GUI system that includes three kinds of window: the main window, the input selection windows, and the output display windows.
As shown in Figure 2.1, the main window allows the users to monitor the operation status of the home and navigate through different setting buttons to select and input the appli-ance parameter settings, HEM algorithms, and compare results [8]. In the following sec-tions, I am going to introduce the functionalities and design considerations of the three types of windows.
Figure 2.1. The main window of the FREEDM HEM GUI 4
5
6
1
2
2.1 Input Parameters
As shown in Figure 2.1, under APPLIANCE SETTING, there are eight appliance param-eter setting buttons for the following eight controllable devices: air conditioning unit AC, space heater, water heater, cloth washer, dishwasher, dryer, fridge and electric vehicle.
a) Setup Parameters for the Air Conditioning Unit
The main parameters of the AC models [9] include the set point temperature and accepta-ble temperature upper and lower limits, as shown in Figure 2.2 [31]. The button labeled with ‘AC’ links to the input interface for setting up the parameters of the air conditioner unit. As shown in Figure 2.3, a user can set three different temperature settings for three different time periods during the day, or a user can set a desired temperature range within which the AC can operate. After finishing setting up the temperature settings, user can select the button labeled as ‘SAVE OPTIONS’ to save the parameters as a default setting in the database. The button labeled with ‘DEFAULT’ gives user an option to use
pre-selected parameters. The user also hit the FINISH button to save all settings to the database or select the ‘CANCEL’ button to cancel the action.
Figure 2.3. Air Conditioner parameters setup interface
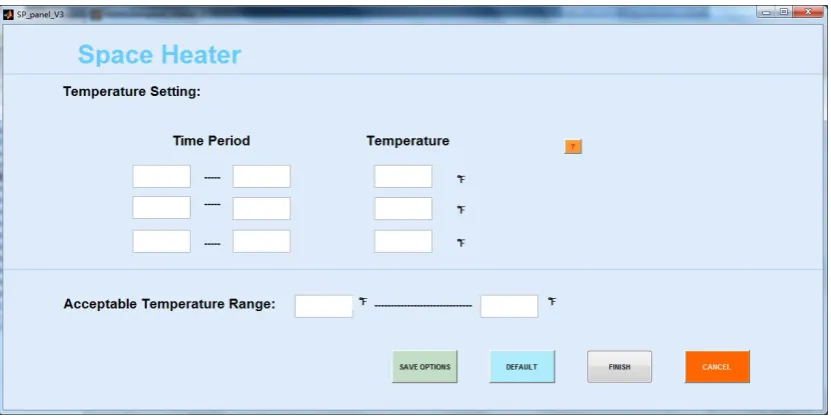
b) Setup Parameters for the Space Heating Unit
The main parameters of the space heating models are similar to those of the AC model and also include the set point temperature and acceptable temperature upper and lower limits.
The button labeled with ‘Space Heater’ [10] links to an input interface to set parameters for the space heater. As shown in Figure 2.4, a user can set three different temperature settings for three different time periods during the day. Also, user could set a desired temperature range. After finishing setting these parameters, user could select the button labeled with ‘SAVE OPTIONS’ to save the parameters as default setting into the data-base. The button labeled with ‘DEFAULT’ gives user an option to use default parameters retrieved from the database. User also could select the button labeled with ‘FINISH’ to save settings to database directly or select the button labeled with ‘CANCEL’ to cancel the action.
c) Setup Parameters for the Water Heater Unit
The button labeled with ‘Water Heater’ links to input interface to set parameters for water heater. As shown in Figure 2.6, user can set three different temperature settings for three different time periods during the day. Also, user could set their desired temperature range. After finishing setting these parameters, user could select the button labeled with ‘SAVE OPTIONS’ to save the parameters as default setting into the database. The button labeled with ‘DEFAULT’ gives user an option to use default parameters. User could also select the button labeled with ‘FINISH’ to save settings to the database or select the button la-beled with ‘CANCEL’ to cancel the action.
The difference between the water heater model and the space heating and air conditioner models are the modeling of hot water consumptions. As shown in Figure 2.5 [36], small hot water consumptions will result in small temperature drops and large consumptions such as taking shower and washing clothes or dishes will cause a large temperature drop. The timing and amount of the hot water consumption will be modeled internally so there will be no parameters needed for the consumers to set up from the HEM GUI.
Figure 2.5 The temperature profile of a water heater unit
Figure 2.6 Water heater parameters setup interface
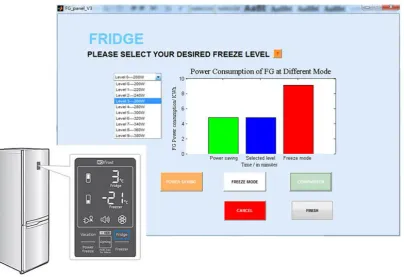
The button labeled with ‘Fridge’ [11][12] links to input interface to set parameters for the refrigerator. As shown in Figure 2.7, user could select different operation levels in a drop box. The levels range from level 0 to level 10 with corresponding power rate from 200W to 380W. Here we offer user an option to let refrigerator work in the ‘power saving’ mode, in which the refrigerator consumes less energy. The button labeled with ‘COM-PARISION will call for the function that compares the energy consumption between dif-ferent selected levels or between the power saving modes and the “freeze” mode. The re-sults will be displayed in the monitor window. Users can also select the ‘FINISH’ button save the settings to database or select the ‘CANCEL’ button to cancel the action.
Figure 2.7 Fridge parameters setup interface
e) Setup Parameters for the Electric Vehicles
Figure 2.8 Electric vehicle parameters setup interface
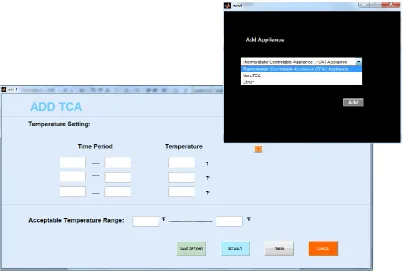
f) Adding Appliances to the HEMS GUI
The button labeled with ‘ADD’ links to an empty interface which allows the user to add in other appliances. User could select different types of appliances from drop box in the panel. A thermostatic controllable appliance customized interface is shown in Figure 2.9. The basic function for this panel is the same as TCA appliance like air conditioner intro-duced before.
g) Set up Operational Periods for Controllable Appliances
The buttons labeled with Cloth Washer, Dishwasher, Dryer link to another type of input interface, the time schedule inputs. It allows the user to schedule the appliance operation time periods. For example, when do they want to wash their cloth washer, when will they wash dishes? As shown in Figure 2.10, the user could save the settings into database by clicking the button labeled with FINISH.
Figure 2.10 Time schedule setup interface for controllable loads
h) Control Strategy Selection
Under CONTROL STRATEGY, there are five buttons for five existing control strategies developed for the FREEDM smart home: Price-Cap, Power-Cap, Consensus, No Control, and Customize. The button labeled with ‘Customize’ links to an interface that allows the user to add other control strategies. Once a strategy is selected, the user can hit the button to run the algorithm based on the selected appliance settings.
Figure 2.11 Control strategy selection interface
2.2 Output and Operation Status Display
There are six screens (labeled from no.1 to no.6) that used as a home energy consumption dashboard [16]. The consumption data are generated by the background simulation mod-ule in real-time and accessed through the HEM database by the GUI.
smart house located in Raleigh, NC and it is a rainy Thursday at 23:00, and the outdoor temperature is 85F and the indoor temperature is 72F.
Figure 2.12 General information display
Screen No.2 displays the current working status of each appliance [17] inside the HEMS. By clicking the button attached in the screen to the right-lower corner, a detailed interface will pop out as shown in Figure 2.13. By clicking button labeled with “GO”, the interface will show the current working status of each appliance inside the smart home, there are five different working statuses: ON, OFF, STANDBY, MAINTAINANCE and OFFLINE. STANDBY means the appliance is loaded and is waiting for the HEM “on” command to be turned on. For example, at 3:00 p.m., a user puts his wet clothes into the dry and set the dryer as “standby”. Then, the HEM control algorithms will know that the dryer can be turned on any time after 3.00 pm. MAINTAINANCE means that the appliance consump-tion is abnormal and it may need to be maintained or replaced. OFFLINE means that the HEMS cannot detect the appliance and the user needs to check the web connection of the appliance. Thus, the operation status of each appliance can be readily accessed through the display.
Figure 2.13 Appliance Operation Status
right).
Figure 2.14 Cost comparison window
Screen No.4 shows the daily power consumption of the smart house. In the results shown in Figure 2.15, the power-cap control strategy is selected. The green line shows the fore-casted power consumption of the house and the red line shows real time power consump-tion of the house.
Figure 2.15 Power output monitoring
Screen No.5 displays the status of distributed energy resources such as PVs and energy storage units. As shown in Figure 2.16, the power output of a roof top PV system (red line) and the state of charge for the energy storage unit of the PV system (blue line) can be displayed so that the user can observe the available storage capacity for storing extra PV generation outputs.[18]
Screen No.6 shows the daily working status of six major appliances in the smart. The color bars show the working periods of the appliances. For example, in Figure 2.17, the yellow bars represent the working status of the air conditioner unit, as shown; the air con-ditioner is on between 0-2am, 3-4am, 6-7am. Noted that for screen No.4, 5, 6, there are two vertical dash lines showing the high price periods in a day.
HEM SOFTWARE ARCHITECTURE
CHAPTER 3
An HEM system is an energy management system that has all or some of the following main functionalities: monitoring energy use, storing and analyzing data, forecasting and scheduling energy use, controlling loads and preparing customer reports. An example of the HEM system is shown in Figure 3.1.
Figure 3.1. Configuration of a HEM system
The HEM monitors the status of the energy use for forecasting or fault detection purpos-es. Sensors installed at major appliances such as stoves, washers, dishwashers, or air con-ditioning units can help the HEM disaggregate the energy uses and analyze the status of each device. Advanced data analytics can use the acquired data to derive load models that forecast future energy use under different operating conditions. Scheduling algorithms are at the heart of the HEM because they can schedule the operation of controllable appli-ances and coordinate with home-owned distributed energy resources to minimize cost, integrate more renewable energy and improve system reliability. Note that each HEM will need to communicate energy prices, billing data, and other information through wired or wireless networks to utilities, load aggregators, and retail electricity markets. In this sec-tion, the design and implementation of the software architecture [19] of the HEM system will be discussed in detail.
3.1 Database Design of the HEM
The database for HEM system [20] can be categorized into three parts based on the func-tion of GUI and the results generated by simulafunc-tion program: input, output and prefer-ence.
saved automatically in the sheet using the format shown below.Then the data will be used as the input settings by HEM simulation program.
The input parameters are (row by row):
1) Set point for temperature for air conditioner and space heater; 2) Dead band for air conditioner and space heater;
3) Working status of air conditioner and space heater; 4) The temperature set point for water heater;
5) Dead band for water heater; 6) Working status of water heater; 7) Set point for temperature for fridge; 8) Dead band for fridge;
9) Working status of fridge;
10) Working status of cloth washer; 11) Working status of dryer;
12) Working status of dishwasher;
13) The lower temperature setting regards to temperature set point for air conditioner and space heater;
14) The upper temperature setting regards to temperature set point for air conditioner and space heater;
15) The lower temperature setting regards to temperature set point for water heater; 16) The upper temperature setting regards to temperature set point for water heater; 17) The lower temperature setting regards to temperature set point for fridge; 18) The upper temperature setting regards to temperature set point for fridge;
Figure 3.2. Input database structure for HEM system
The output data sheet is shown in Figure 3.3, the results generated by system simulation modules will be automatically saved into the sheet using the format shown below.
1. Current room temperature;
2. Current power output of air conditioner; 3. Current water temperature for water heater; 4. Current power output for water heater; 5. Current temperature for fridge;
6. Current power output for fridge; 7. The power output for washer; 8. The power output for dryer; 9. The power output for dish washer; 10.The power output for entire house; 11.The working status of appliances; 12.Current marker electricity price; 13.Current power output of solar panel; 14.Energy Storage State of Charge 15.Electric Vehicle charging rate;
Figure 3.3. Output database structure for HEM system
Figure 3.4. Input preference database structure for HEM system
3.2 Information Flows in the HEM System
In this section, an example is given which illustrates the information flow [21] of HEM system to indicate how information transport from the beginning as input to the end as the output that display on the GUI monitors.
The HEM system needs lots of data inputs to initialize the simulation for different appli-ances modules included in the system. The data input will be gathered and saved into the database through the GUI, then the appliance modules will use the settings from database to carry out a simulation, and the appliance modules will generate the simulation results and save the correlated data into database, finally the GUI will display the results by reading the data from database.
Figure 3.5. Information flow between HEM system and GUI
RULE-BASED CONTROL ALGORITHM
CHAPTER 4
The Matlab-based HEM system can simulate the energy consumption of home appliances considering outside temperature and consumer behavioral factors such as
probabil-ity-of-use. Those capabilities make the HEM system a suitable test bed for new algorithm development. In this chapter, a rule-based control algorithm for controlling the peak power consumption of a household is developed. Then, a sensitivity analysis is conducted to evaluate the impact of the input parameter changes on the robustness of the algorithm performance for different loading conditions.
4.1 Problem Formulation
Although behaviors of a residential house owner can be hard to predict, they do usually follow a few routines [22-23]. For example, when people get up in the morning, they normally will take a shower, cook some breakfast, make themselves a cup of coffee, and watch some TV or listen to the radio. The electricity consumption can be high during the morning hours, because everything needs to be done in an hour or so. Then, after the breakfast, kids will go to school and adults will go to work. The energy consumption will drop significantly. For those families who will have lunch at home, there will be a short peak at noon for cooking load. Because of the time limit, the period of load peak will be normally tens of minutes. For those families who do not go home for lunch, the consump-tion will remain low till late afternoon when people return home from work or school. The main loads will be food processing and cooking load that related with preparing din-ner. After dinner, the family members may wash dishes, watch TV, use their computers, etc. They may also wash clothes, vacuum the floor, or do some housework. However, those usages are normally not part of their daily routines.
Therefore, residential load consumption follows a time-of-the-day pattern. When people are at home, energy consumptions are high. Peak power of the house can reach 15-20 kW when all the energy consumptions happen in a short period of time [23]. When people are sleeping and resting, not at home, or on vacation, energy consumption can drop below 1 kW most of the time. When the peak load periods of several houses supplied by the same transformer coincide with each other, the aggregation of peak power can cause the equipment to be overloading and causes higher losses. Moreover, if the high energy use period is within a period which the electricity price is high, the energy bill will be high.
4.2 Modeling Approach and Algorithm Design
In this section, the modeling approach of the HEM system and the algorithm design pro-cess as well as simulation results generated by HEM system will be introduced. First, a simulation environment to simulate the base load power consumption of a house without control will be introduced. Then, a rule-based priority-list appliance control algorithm will be introduced. The robustness of the algorithm is validated by Monte Carlo simula-tion of different operasimula-tion condisimula-tions.
1. HEM System Modules Introduction
The Home Energy Management System (HEMS) testing environment is developed by Dr. Ning Lu’s research group at the FREEDM center at North Carolina State University (NCSU). The system is developed on Matlab platform and consists of different appliances modules; the system simulates the energy consumption of a single-family residential house load. There are 19 appliances included in the system, which can be categorized into two categories: thermostatically controllable appliance and non-thermostatically control-lable appliance. For thermostatically controlcontrol-lable appliances, modules for air conditioner, space heater, water heater and fridge are included. For non-thermostatically controllable appliances, modules for dishwasher, cloth washer and dryer, TV, lights, range and micro wave oven are included.
a. Non- Thermostatically Controllable Appliances
The non-thermostatically controllable appliances are modeled using a probabil-ity-of-use (POU) method. The working status of an appliance is determined by the likelihood it will be operated based on historical data collected at the home. At each hour, there is a POU associated with small random energy use. The higher the POU, the more frequently the appliance will be turned on at that hour. To make the simula-tion more realistic, two types of POU were developed based on different consumpsimula-tion routines: POU for weekend and POU for weekday.
Table 4.1. Probability of use for appliances for weekend
CW=cloth washer; DY=dryer; DW=dishwasher; TV=television; RG=range; LT=lights; OW=micro oven
Figure 4.1. The operation of a range surface unit between 6:00 a.m. and 7:00 a.m.
1 2 3 4 5 6 7 8 9 10 11 12 13 14 15 16 17 18 19 20 21 22 23 24
CW 0 0 0 0 0 0 0 0 0 0 0 0 0 0 0 0.1 0.1 0.7 0.7 0.7 0.1 0.1 0.1 0
DY 0 0 0 0 0 0 0 0 0 0 0 0 0 0 0 0 0 0.1 0.1 0.7 0.7 0.7 0 0
DW 0 0 0 0 0 0 0 0 0.1 0.1 0.1 0.1 0.8 0.8 0 0 0 0 0 0.8 0.8 0.8 0.1 0
TV 0 0 0 0 0 0 0 0 0 0.1 0.1 0.8 0.8 0.5 0.1 0.1 0.1 0.1 0.7 0.8 0.8 0.8 0.8 0.1
RG 0 0 0 0 0 0.7 0.7 0.7 0.1 0 0 0.5 0.5 0 0 0 0 0.8 0.8 0.8 0.1 0 0 0
LT 0 0 0 0 0 0 0.7 0.9 0.1 0 0 0 0 0 0 0 0 0.5 0.6 0.6 0.9 0.9 0.9 0.2
b. Thermostatically Controllable Appliances
The thermostatically controllable appliances include air conditioners, space heaters, water heaters and refrigerators. The operation mechanism of the air conditioner and space heat-er modules are described in [24][25]. For the space heatheat-er unit, its thheat-ermal behavior is shown in Figure 4.2. There is a temperature set point,Tset, for space heater that represents
the user desired room temperature. An upper room temperature limit, T, and a lower
room temperature limit, T, represent the higher and lower room temperatures a user
can tolerate around Tset.
Then, we have the following equations illustrate the behavior of a space heating unit:
deadband
T TT (4-1) When the space heater is working, the room temperature will rise based on the equation:
1 1 1 /
( ) e
t t t t t RC
room o o room
T T QR T QR T (4-2) When the space heater is not working, the room temperature will drop based on the equa-tion:
1 1 1 /
( ) e
t t t t t RC
room o o room
T T T T (4-3) Where:
C equivalent heat capacity(J/ C)o ,
R equivalent thermal resistant( C/ W)o ,
Q
equivalent heat rate (W).t
time step (1 min) ando
T ambient temperature.
For time between t1 andt2, t3andt4, the space heater unit starts to work and the room
temperature starts to rise. At timet2, the room temperature reaches the upper limit,T,
For air conditioners, the operating theory is similar to space heaters; on the contrary while the air conditioner starts to work, the room temperature will drop and when it stops to work the room temperature will rise.
Figure 4.2. Thermal behavior of space heater [34]
For water heater, its thermal behavior is shown in Figure 4.3; there is a temperature set point for water heater that represents for the user desired temperature. When the water heater is working, the water temperature will rise based on the equation:
1 1 ( 1 ) e /
t t t t t RC
water o o water
T T QR T QR T (4-4)
When the water heater is not working, the water temperature will drop based on the equa-tion:
1 1 1 /
( ) e
t t t t t RC
water o o water
T T T T (4-5)
Where:
C equivalent heat capacity(J/ C)o ;
R equivalent thermal resistant( C/ W)o ;
Q equivalent heat rate (W);
t
time step (1 min);
o
Figure 4.3. Thermal behavior of water heater [33]
For a refrigerator, the working theory is similar to that of an HVAC system introduced before. However, the refrigerator is usually not controlled by a user. Normally, it cannot be switched off, because it needs to maintain a specific temperature dead band to keep the food fresh.
For both the TCA and non-TCA appliances inside a household, we assign a pre-set rated power. Thus, once an appliance is working, the HEM system will consider it is working at the rated power. This allows a load profile be generated based on the appliance working status. We can see from Figure 4.4 (a) that the space heater and water heater are the two TCA appliances that have the highest power rating. As shown in Figure 4.4 (b), the daily load profile of a residential household in winter shows that there are two peak power consumption periods during 17:00-19:00 and 21:00-22:00. Thus, the control objective of the rule-based control algorithm developed in this thesis is to shave the peak by im-plementing power cap-controls.
(a) (b)
Figure 4.4. (a) A list of rated powers for different residential household appliances, (b) an example of the daily
load profile in winter season
0 2 4 6 8 10 12 14 16 18 20 22 0
2 4 6 8 10 12 14
2. Design and Implementation of a Rule-Based Control Algorithm
Demand response (DR) [27] is defined as: “Changes in electric usage by end-use custom-ers from their normal consumption patterns in response to changes in the price of electric-ity over time, or to incentive payments designed to induce lower electricelectric-ity use at times of high wholesale market prices or when system reliability is jeopardized.” Peak shaving is a technique that is used to reduce electrical power consumption during period of max-imum demand on the power utility for energy savings. [26]
In this thesis, the goal is to reduce the peak power consumption during peak load periods without compromising the customer’s comfort. To design a control algorithm for control-ling the power consumption during the peak hours, we started with analyzing why the peak happens and what choices a consumer has to reduce the consumption without sacri-ficing his comfort.
As shown in Figure 4.4 (b), there are several power spikes in a day. The first power spike happens between 6:00-8:00 and the second happens between 17:00-19:00. By analyzing the switching status [28] of appliances shown in Figure 4.5, between 6:00-8:00, the fridge, four lights, space heater and water heater have working periods that overlap with each other, causing the first spike. Between 17:00-19:00, the fridge, cloth washer, the range unit, dishwasher, water heater, space heater, four lights, and two TVs are all work-ing heavily, causwork-ing a peak load period with higher power and longer duration than those of the morning peak.
As listed in Figure 4.4(a) [29], the rated power for both the space heater and the water heater is 4.5KW. The lights and TVs are only a few hundreds of W. Thus the peak load reduction by those types of load is negligible. Furthermore, keeping the lights on are for both safety and comfort reasons and leaving the TV on is also crucial for entertainment reasons. Thus, only the two TCA appliances are the ones to be controlled for reducing the peak loads.
Figure 4.5. Switch status of the appliances in HEM system for 24 hours
(there will be a colored dot if the appliance is ON)
To strictly define the priority of operation, a rule-based control algorithm is developed. Figure 4.6 shows the control logic of the algorithm. The time step of the simulation is 1 minute and the duration is 24 hours.
After initialization, at each time step, we will update the appliances’ status and get the current total power consumption of the house. Then, comparison is made to see if the power cap is exceeded. If not, we maintain the same operation status for the space heater and water heater. If the power cap is exceeded, the program will get the current room temperature and water temperature; compare them with the upper and lower limit of temperature settings to decide which of the four scenarios it will go into.
1) Both the room temperature and the water temperature are within the dead band of set-ting.
2) The room temperature is within the dead band but the water temperature is out of the dead band.
3) The water temperature is within the dead band but the room temperature is out of the dead band.
4) Both water temperature and room temperature are out of dead band.
In Scenario 2, the water heater will need to work to maintain the water in the acceptable range. Then, the space heater will be shut down.
In Scenario 3, the space heater will need to work to maintain the room temperature in the acceptable range. Then, the space heater will be shut down.
In Scenario 4, both will need to work to maintain the temperature in the acceptable range. Both space heater and water heater will be turned on.
A countdown timer will be triggered once a selection is made to maintain the determined working status of the space heater and the water heater for a specific duration (e.g.
5-minute, 10-minute, or 15-minute). During that period, the program will not compare the total power consumption with the power cap. This will reduce the communication needs between the device and the central controller to save the bandwidth and avoid frequent switching behaviors to prolong the appliance lifetime. When the specified duration is reached, the controller will once again examining the total power to see if it exceeds the threshold. Then, the controller may enter on of the four loops again for capping the ener-gy consumptions in the household.
Figure 4.6. Control logic for rule-based control algorithm
of the performance of the control algorithm, six operation conditions are designed for sensitivity analysis.
1. Low power threshold and low interference time: power threshold equals to 8KW, counter ceiling equals to 5.
2. Low power threshold and middle interference time: power threshold equals to 8KW, counter ceiling equals to 10.
3. Low power threshold and high interference time: power threshold equals to 8KW, counter ceiling equals to 15.
4. High power threshold and interference time: power threshold equals to 10KW, counter ceiling equals to 5.
5. High power threshold and interference time: power threshold equals to 10KW, counter ceiling equals to 10.
6. High power threshold and interference time: power threshold equals to 10KW, counter ceiling equals to 15.
In order to test the robustness of the algorithm, three different temperature (see Figure 4.7) profiles in a winter season were selected. Under each temperature scenarios, there are three set of probability of use table implemented representing the low, medium, and high occupancy days. This setting may also represent for households in three different loca-tions with three different load consumption patterns. We simulated 90 cases for each de-fined scenarios to generate a statistically stable results for evaluating the performance of the developed rule-based control algorithm.
Thus, we define one simulation run in a scenario as: 1) One of the three temperature pro-files (cold, mild, and warm day in winter) is used; 2) one of the three probability of use settings (light use, regular use, and heavy use) is selected. In each scenario, we will run 90 times to represent 90 different load patterns generated for the same weather condition and the same loading pattern. In total, 6480 daily load profiles can be generated including 90 cases for each of the 72 scenarios including 3 day-types (cold, mild, warm), 3 energy consumption patterns (regular-probability1, light-probability2, heavy
load-ing-probability3).
To evaluate the performance of this algorithm, three evaluation criteria were selected. 1. The first criterion is the time for total power consumption of the house to exceed
the power threshold.
2. The second criterion is the maximum peak power of the house.
3. The third criterion is the number for space heater to change its switch status.
(a) A cold day in winter (b) A mild day in winter
(c) A warm day in winter
Figure 4.7. Temperature profiles of the cold, mild, and warm days
4.3 Simulation Results for One Simulation Run
The results from one simulation run are presented in Figure 4.8-Figure 4.10. The left fig-ure in Figfig-ure 4.8 shows the load profile without using the rule-based control algorithm for the cold day and regular load condition. There are three spikes that exceed a threshold of 10KW. The longer peak load period occurs between 17:00 to 19:00. The left figure in Figure 4.8 reveals that the reason for the spike to occur is the use of hot water during cooking. When the water heater unit is in use together with the range, dishwasher, cloth washer and TVs (See the left figure in Figure 4.8), the power spikes happen more often and last longer.
The right figure in Figure 4.8 shows the load profile with the rule-based control algorithm implemented (Cold/probability1/15-min Timer). As shown in the right figure in Figure 4.9, a huge water use occurs at around 8:00 p.m. and there are multiple appliances work-ing durwork-ing that period too (see Figure 4.10). However, once the total power consumption [30] exceeds 10KW, the control algorithm will intervene and regulate the consumption of the total load to be below the cap immediately. We can observe from the right figure in Figure 4.9 that the room temperature is not violated when the control is implemented.
0 5 10 15 20 25
20 40 60 80 100 120 140 160 TroomAC TroomSP Twaterheater Fridge Tout
0 5 10 15 20 25
20 40 60 80 100 120 140 160 TroomAC TroomSP Twaterheater Fridge Tout
0 5 10 15 20 25
Figure 4.8. Load profiles without control and with control
Figure 4.9. Temperature profiles of appliances without control and with control
Figure 4.10. Switch Status of appliances without control and with control
Because results of a single run can only demonstrate that the performance of the proposed control algorithm is effective for this specific day and load pattern. To validate the algo-rithm performance under a range of operation conditions and evaluate the robustness of the algorithm, different house load patterns under different weather conditions will be needed for algorithm testing.
0 2 4 6 8 10 12 14 16 18 20 22 0 2 4 6 8 10 12 14
load profile in a day/ kw
0 2 4 6 8 10 12 14 16 18 20 22 0 2 4 6 8 10 12
load profile in a day/ kw
0 5 10 15 20 25
20 40 60 80 100 120 140 160 TroomAC TroomSP Twaterheater Fridge Tout
0 5 10 15 20 25
20 40 60 80 100 120 140 160 TroomAC TroomSP Twaterheater Fridge Tout
1 2 3 4 5 6 7 8 9 10 11 12 13 14 15 16 17 18 19 20 21 22 23 24 AirCon SPH WaterH DishWas Dryer Range Clothwas Ventfan MicrW TV1 TV2 LT1 LT2 LT3 LT4 LT5 LT6 LT7 Fridge
Time of the day
A p p lia n c e N o switch status
1 2 3 4 5 6 7 8 9 10 11 12 13 14 15 16 17 18 19 20 21 22 23 24 AirCon SPH WaterH DishWas Dryer Range Clothwas Ventfan MicrW TV1 TV2 LT1 LT2 LT3 LT4 LT5 LT6 LT7 Fridge
Time of the day
4.4 Simulation Results for Multiple Simulation Runs
As described before, 6480 daily load profiles are created to conduct 90 runs for each of the 72 scenarios. There are 3 day-types: cold, mild, and warm, as shown in Figure 4.7. There are three energy consumption patterns: regular-loading/probability1,
light-loading/probability2, and heavy-loading/probability3). For each loading condition, we tested three timer settings: 5-min, 10-min, and 15-min.
The simulation results are summarized in Table 4.2 and Table 4.3. The following observa-tions are made:
1. For the same day-type and loading-level, the algorithm performs very well when the power cap value is high. When power cap is low, the algorithm still performs much better than the no-control case but the violation duration and peak are increasing dras-tically, showing the capability of shifting energy consumption is weakened signifi-cantly.
2. The setting of the timer is very important. The 15-minute timer gives the best perfor-mance in nearly all the cases. This is because the average load consumption lasts longer than five minutes but shorter than 15 minutes.
3. The probability distribution plots show the actual distribution of the duration of the power cap being exceeded. It can show us how robust the algorithm is. As shown in Figure 4.11, if using a 8kW power cap, for the cold day with heavy-loading case, the duration of power cap violation can be very long if using a 5-minute timer, for the case with no control, the duration that power cap is exceeded ranges between 100 minutes to 290 minutes, while for the controlled cases, it is between 50 to 100 minutes, a 50% reduction by controlling only two appliances in the home.
4. As we can see that the range for distribution of peak power for worst case with con-trol and no concon-trol are the same, however for with concon-trol cases the distribution be-tween 15KW to 16KW are smaller than without control, which means that most houses with control have lower peak power than with no control algorithm scenario. 5. As shown in Figure 4.11 and Figure 4.12, even in the worst case, if with control, the
average time of violation is 83.97 minutes, which is much smaller than 174.42 minutes of the no control case. The only drawback is that the peak power is 0.5KW higher than that of the no control case. However, the duration of the peak is normally very short. Therefore, considering the reduction in duration, especially knowing that the acceptable tolerate time for transformer to sustain an overloading condition is normally in the range of 5-10 minutes, the performance of the control algorithm is consistently better than the no-control case.
6. As we can see from Table 4.3, the average time for room temperature to violate the dead band are all zero for each case, showing that the algorithm does not compromise the customer comfort. The maximum and minimum average room temperatures are the same for with control implemented and with no control implemented.
con-trol, showing no additional lifetime depreciation due to the implementation of the rule-based control algorithm performs.
8. Because we use timer for locking the appliance operation in a period of time instead of frequently checking the end device status, the communication time between the HEM controller and the end device is also minimized.
Table 4.2. Results for evaluation influence on power grid and appliances
Temperature1---Cold days Temperature2---Mild days Temperature3---warm days
Timer
Setting
(Minute)
POU 1 - regular POU 2 - Light POU 3 - Heavy POU 1 - regular POU 2 - Light POU 3 - Heavy POU 1 - regular POU 2 - Light POU 3 - Heavy
AVE v
T PpAVE NSW
AVE v
T PpAVE NSW
AVE v
T PpAVE NSW
AVE v
T PpAVE NSW
AVE v
T PpAVE NSW
AVE v
T PpAVE NSW
AVE v
T PpAVE NSW
AVE v
T PpAVE NSW
AVE v
T PpAVE NSW
Cap
8
(KW) No
control
160 12.7 14 147.5 12.8 14 174.4 13.7 14 111.4 12 9.9 108.2 11.8 10 109.9 11.9 9.9 102.4 13.1 5.9 93.6 12.6 5.9 101.2 13.3 5.9
5
70.9 13.5 14 65.6 13.3 14 84 14.2 14 42.4 12.2 10 37.5 12.1 9.9 37.2 12.5 10 49.9 12.9 5.9 46 12.3 5.9 48.8 13.2 5.9
10
57.9 13.6 14 52.2 13.1 14 57.4 13.4 14 30.8 12.3 9.9 26.2 12.2 9.9 25 12.3 9.9 44.2 12.9 5.9 39 12.2 5.9 43.3 13.3 5.9
15
51.8 13.2 14 50.7 13.1 14 53 13.3 14 26.1 12.1 10 23.6 11.6 9.9 23.2 11.9 10 39.9 12.3 5.9 36.8 11.9 5.9 39.5 12.7 5.9
Cap
10
(KW) No
control
42.2 12.9 14 38.1 12.8 14 52.6 13.3 14 26.4 12 9.9 17.7 12 9.9 27.9 12 9.9 38.2 13.1 5.9 18.6 12.7 5.9 31.6 13.2 5.9
5
11.6 12.8 14 7.7 12.8 14 14.7 13.4 14 4.4 11.7 10.0 2.4 11.6 10 5.8 11.9 9.9 7.8 12.7 5.9 3.5 12.6 5.9 7.7 12.9 5.9
10
10.6 12.8 14 5.7 13 14 11.4 13.0 14 4.1 11.9 9.9 1.8 11.4 9.9 4.1 11.8 9.9 6.3 12.7 5.9 2.4 12.3 6 5.1 13 5.9
15
6.9 12.6 14 4.1 12.6 14 10.6 13.3 14 2.7 12 10 1.6 11.5 10 2.9 11.4 9.9 5.0 12.4 5.9 2 12.1 5.9 4.7 13 5.9
SW
Table 4.3. Influence on customer comfort
Temperature1---Cold days Temperature2---Mild days Temperature3---warm days
Timer (Minute)
POU 1 - regular POU 2 - Light POU 3 - Heavy POU 1 - regular POU 2 - Light POU 3 - Heavy POU 1 - regular POU 2 - Light POU 3 - Heavy
AVE v
T Temmax Temmax
AVE v
T Temmax Temmax
AVE v
T Temmax Temmax
AVE v
T Temmax Temmax
AVE v
T Temmax Temmax
AVE v
T Temmax Temmax
AVE v
T Temmax Temmax
AVE v
T Temmax Temmax
AVE v
T Temmax Temmax
Cap
8
(KW) No
control
0 70.1 66.3 0 70.1 66.3 0 70.1 66.3 0 70.1 66.3 0 70.1 66.3 0 70.1 66.3 0 70.1 66.3 0 70.1 66.3 0 70.1 66.3
5
0 70.1 66.3 0 70.1 66.3 0 70.1 66.3 0 70.1 66.3 0 70.1 66.3 0 70.1 66.3 0 70.1 66.3 0 70.1 66.3 0 70.1 66.3
10
0 70.1 66.3 0 70.1 66.3 0 70.1 66.3 0 70.1 66.3 0 70.1 66.3 0 70.1 66.3 0 70.1 66.3 0 70.1 66.3 0 70.1 66.3
15
0 70.1 66.3 0 70.1 66.3 0 70.1 66.3 0 70.1 66.3 0 70.1 66.3 0 70.1 66.3 0 70.1 66.3 0 70.1 66.3 0 70.1 66.3
Cap
10
(KW) No
control
0 70.1 66.3 0 70.1 66.3 0 70.1 66.3 0 70.1 66.3 0 70.1 66.3 0 70.1 66.3 0 70.1 66.3 0 70.1 66.3 0 70.1 66.3
5
0 70.1 66.3 0 70.1 66.3 0 70.1 66.3 0 70.1 66.3 0 70.1 66.3 0 70.1 66.3 0 70.1 66.3 0 70.1 66.3 0 70.1 66.3
10
0 70.1 66.3 0 70.1 66.3 0 70.1 66.3 0 70.1 66.3 0 70.1 66.3 0 70.1 66.3 0 70.1 66.3 0 70.1 66.3 0 70.1 66.3
15
0 70.1 66.3 0 70.1 66.3 0 70.1 66.3 0 70.1 66.3 0 70.1 66.3 0 70.1 66.3 0 70.1 66.3 0 70.1 66.3 0 70.1 66.3
AVE v
T stands for average time to violate room temperature dead band, Temmax stands for average maximum room temperature, Temmin stands for average minimum room
Figure 4.11. Duration and Peak Power distribution for a cold day with heavy loading (8kW power cap)
Figure 4.12. Average criterions for cold location POU3 with low power threshold 50 100 150 200 250 300
0 10
20 base
50 60 70 80 90 100 110 0
10 20
c5p8
40 50 60 70 80
0 10 20
c10p8
30 40 50 60 70 80
0 10 20 t P>P CAP (min) c15p8
10 12 14 16 18
0 10 20
base
11 12 13 14 15 16 17
0 20 40
c5p8
11 12 13 14 15 16 17
0 20 40
c10p8
11 12 13 14 15 16
0 20 40 P Peak(kW) c15p8
Base0 c5p8 c10p8 c15p8
100 200
t vio average (1,174.42)
(2,83.97) (3,57.43) (4,52.97)
Base c5p8 c10p8 c15p8
13 14 15
P peak average
(1,13.69) (2,14.16) (3,13.43)
(4,13.34)
Base0 c5p8 c10p8 c15p8
0.01 0.02
t vio teperature average
(1,0.01) (2,0.01)
(3,0.00) (4,0.00)
Base c5p8 c10p8 c15p8
13.98 13.99 14
# of switch for SP average
(1,13.99) (2,13.99)
CONCLUSION AND FUTURE WORK
CHAPTER 5
In this thesis, a graphic user interface (GUI) for home energy management system is de-veloped. Then, the software architecture of the HEM system is introduced. Finally, a rule-based control algorithm is developed, tested and evaluated.
The main contributions of this thesis are summarized as follows:
Developed a graphic user interface (GUI) for the FREEDM smart home test sys-tem. The use of the GUI has substantially simplified the input of parameter set-tings and the display of simulation results. It is now being used as the main GUI for algorithm development and hardware testing.
A HEM system software architecture is developed. The architecture design allows the algorithm development to be separated from the test system. Thus all the al-gorithms can be evaluated using the same simulation environment, offering a common simulation platform for HEM algorithm developers to implement and test their control algorithms on a standardized test bed.
A rule-based control algorithm is developed for optimizing the energy consump-tions of the HEM system by capping the home energy consumpconsump-tions below a tar-get power peak.
Our future work will focus on following directions:
Develop the graphic user interface using Java or C/C++ to enhance the function-alities of the GUI interface and make it visual appealing.
Extend the HEM system software architecture to multiple homes
REFERENCES
[1] Asare-Bediako, Ballard, Paulo F. Ribeiro, and Wil L. Kling. "Integrated energy opti-mization with smart home energy management systems." In Innovative Smart Grid Technologies (ISGT Europe), 2012 3rd IEEE PES International Conference and Ex-hibition on, pp. 1-8. IEEE, 2012.
[2] Xie, Qing, and Atif M. Memon. "Model-based testing of community-driven
open-source GUI applications." In Software Maintenance, 2006. ICSM'06. 22nd IEEE International Conference on, pp. 145-154. IEEE, 2006.
[3] Liu, Qi, Hong Wei Qian, Bao Wei Wang, Jian Shen, and Nigel Linge. "An enhanced routing algorithm for congestion control in a home energy management system." In Consumer Electronics (GCCE), 2013 IEEE 2nd Global Conference on, pp. 438-439. IEEE, 2013.
[4] Ali, Dallia Morsi. "Energy capacity and economic viability assessment of the renewa-ble hydrogen energy storage as a balancing mechanism in addressing the electric sys-tem inte-gration issues inherent with variable renewable energy resources." (2011): 51-51.
[5] Welch, David, and Mohamed H. Shwehdi. "An energy reading and bill generation da-tabase for use in nonintrusive load management." InTransmission and Distribution Conference, 1991., Proceedings of the 1991 IEEE Power Engineering Society, pp. 342-347. IEEE, 1991.
[6] Liu, Baoshi, and Qi Wei. "Home energy control algorithm research based on demand re-sponse programs and user comfort." In Measurement, Information and Control (ICMIC), 2013 International Conference on, vol. 2, pp. 995-999. IEEE, 2013.
[7] Adika, Christopher O., and Lingfeng Wang. "Autonomous appliance scheduling based on time of use probabilities and load clustering." In IPEC, 2012 Conference on Power & Energy, pp. 42-47. IEEE, 2012.
[9] QIU, Haitao, and Yan WU. "Green Air-Conditioner Design." Ecological Economy 4 (2010): 038.
[10]Bates, E. "Development of transportable thermal-storage space heaters."Proceedings of the IEE-Part A: Power Engineering 104, no. 17 (1957): 415-423.
[11]Sun, Xiaofeng, and Xinjun Zhao. "Research on user experience design of household fridge." In Computer-Aided Industrial Design & Conceptual Design, 2009. CAID & CD 2009. IEEE 10th International Conference on, pp. 1244-1248. IEEE, 2009.
[12]Keding, Holger, Markus Willems, Martin Coors, and Heinrich Meyr. "FRIDGE: a fixed-point design and simulation environment." In Proceedings of the conference on Design, automation and test in Europe, pp. 429-435. IEEE Computer Society, 1998.
[13]Wang, Zhanle, and Raman Paranjape. "An Evaluation of Electric Vehicle Penetration under Demand Response in a Multi-Agent Based Simulation." InElectrical Power and Energy Conference (EPEC), 2014 IEEE, pp. 220-225. IEEE, 2014.
[14]Keoun, Bradley C. "Designing an electric vehicle conversion." In Southcon/95. Con-ference Record, pp. 303-308. IEEE, 1995.
[15]Klontz, K. W., A. Esser, R. R. Bacon, D. M. Divan, D. W. Novotny, and R. D. Lo-renz. "An electric vehicle charging system with'universal'inductive interface." In Power Conversion Conference, 1993. Yokohama 1993., Conference Record of the, pp. 227-232. IEEE, 1993.
[16]Ali, Shady, and DoHyeun Kim. "Visualization methodology of power consumption in homes." In Open Source Systems and Technologies (ICOSST), 2013 International Conference on, pp. 55-59. IEEE, 2013.
[17]Zhi-Gang, Liu, and Huang Wei. "The design of smart home system based on Wi-Fi." In Computational Problem-Solving (ICCP), 2012 International Conference on, pp. 454-456. IEEE, 2012.
[19]Guo, Jiang. "An approach for modeling and designing software architecture." InEngi-neering of Computer-Based Systems, 2003. Proceedings. 10th IEEE Interna-tional Conference and Workshop on the, pp. 89-97. IEEE, 2003.
[20]Jiang, Xuedong, and Guoji Song. "The database design for the control equipment man-agement system." In System Science, Engineering Design and Manufacturing Informatization (ICSEM), 2012 3rd International Conference on, vol. 2, pp. 261-264. IEEE, 2012.
[21]Lahti, Juha P., Petri Helo, and Ahm Shamsuzzoha. "Information flows and
ICT-system interconnections in electricity supply chain wind power modelled." InICT and Knowledge En-gineering (ICT & Knowledge Engineering), 2012 10th Interna-tional Conference on, pp. 175-181. IEEE, 2012.
[22]Kashimoto, Yukitoshi, Kanayo Ogura, Seiichi Yamamoto, Kiyotoshi Yasumoto, and Mi-nora Ito. "Saving energy in smart homes with minimal comfort level reduction." In Pervasive Computing and Communications Workshops (PERCOM Workshops), 2013 IEEE International Conference on, pp. 372-376. IEEE, 2013.
[23]Fung, C. C., S. C. Tang, and K. P. Wong. "A proposed study on the use of ICT and smart meters to influence consumers' behavior and attitude towards Renewable Ener-gy." In Power and Energy Society General Meeting, 2010 IEEE, pp. 1-5. IEEE, 2010.
[24]Lu, Ning, and Yu Zhang. "Design considerations of a centralized load controller us-ing thermostatically controlled appliances for continuous regulation reserves." Smart Grid, IEEE Transactions on 4, no. 2 (2013): 914-921.
[25]Du, Pengwei, and Ning Lu. "Appliance commitment for household load sched-ul-ing." Smart Grid, IEEE Transactions on 2, no. 2 (2011): 411-419.
[26]Nutter, Roy S., Y. V. Reddy, John M. Atkins, Ravi S. Raman, Alan W. Butcher, and David F. Tuthill. "An Expert System Design for Ventilation, Emergency Rescue, and Power Peak Shaving." Industry Applications, IEEE Transactions on 1 (1986): 97-101.
![Figure 2.2. Air Conditioner modeling parameters [31]](https://thumb-us.123doks.com/thumbv2/123dok_us/1485072.1181696/16.595.109.496.342.679/figure-air-conditioner-modeling-parameters.webp)