ABSTRACT
WESTLANDER, MEGHAN JOANNE. The Issues Framework: Situating Graduate Teaching Assistant-Student Interactions in Physics Problem Solving. (Under the direction of Robert Beichner.)
Interactive engagement environments are critical to students’ conceptual learning gains,
and often the instructor is ultimately responsible for the creation of that environment in the
classroom. When those instructors are graduate teaching assistants (GTAs), one of the primary
ways in which they can promote interactive engagement is through their interactions with
students.
Much of the prior research on physics GTA-student interactions focuses on GTA training
programs (e.g. Ezrailson (2004); Smith, Ward, and Rosenshein (1977)) or on GTAs’ specific
actions and beliefs (e.g. West, Paul, Webb, and Potter (2013); Goertzen (2010); Spike and
Finkelstein (2012a)). Research on students’ ideas and behaviors within and surrounding those
interactions is limited but important to obtaining a more complete understanding of how GTAs
promote an interactive environment.
In order to begin understanding this area, I developed the Issues Framework to examine
how GTA-student interactions are situated in students’ processes during physics problem
solv-ing activities. Ussolv-ing grounded theory, the Issues Framework emerged from an analysis of the
relationships between GTA-student interactions and the students procedures and expressions
of physics content in and surrounding those interactions.
This study is focused on introducing the Issues Framework and the insight it can provide
into GTA-student interactions and students’ processes. The framework is general in nature and
has a visually friendly design making it a useful tool for consolidating complex data and quickly
pattern-matching important pieces of a complex process.
Four different categories of Issues emerged spanning the problem solving process: (1) Getting
Started, (2) Solution Approach, (3) Unit Conversions, and (4) Other. The framework allowed
common stories of students’ processes and how the interactions were situated in those processes
in each category.
Through the stories, the Issues Framework revealed processes in which students often
fo-cused narrowly on procedures with the physics content expressed through their procedures and
only sometimes through conceptual discussions. Interactions with the GTA affected changes
in students’ processes, typically leading students to correct their procedures. The interactions
often focused narrowly on procedures as well but introduced conceptual discussions more often
than students did surrounding the interactions. Comparing stories across GTAs instead of across
categories revealed one GTA who, more often than other GTAs, used conceptual discussion and
encouraged students’ participation in the interactions.
The Issues Framework still needs continued refinement and testing. However, it represents
a significant step toward understanding GTA-student interactions from the perspective of
©Copyright 2014 by Meghan Joanne Westlander
The Issues Framework: Situating Graduate Teaching Assistant-Student Interactions in Physics Problem Solving
by
Meghan Joanne Westlander
A dissertation submitted to the Graduate Faculty of North Carolina State University
in partial fulfillment of the requirements for the Degree of
Doctor of Philosophy
Physics
Raleigh, North Carolina
2014
APPROVED BY:
David Haase Laura Clarke
Margaret Blanchard Robert Beichner
DEDICATION
BIOGRAPHY
Meghan Joanne Westlander grew up in a suburb of San Francisco, attending Catholic school
through high school. While she was always interested in relationships and communication among
people, her interest in physics began blossoming her senior year of high school. She became
fascinated with special relativity and astrophysics, reading a slew of books from the local library.
Beginning college at the University of California, San Diego, she did not know which
in-terest to follow first, changing majors several times. She eventually majored in Physics with a
specialization in Astrophysics while minoring in Math and Psychology.
Upon graduating college in 2004, Meghan pursued her interest in physics, interning at
NASA Goddard Space Flight Center and working temporarily for General Atomics. In 2005,
she changed course and joined Teach for America, teaching physics and physical science to high
school seniors and freshman in St. Louis, MO. Teaching solidified a desire to pursue a career
that encompassed her interest in human relationshipsand physics combined with a new interest
in educational reform.
Through previous contacts, Meghan connected with Tom Foster at Southern Illinois
Univer-sity, Edwardsville and worked with him on a pilot study in Physics Education Research. This
fueled her interest in continuing research in the field, and she applied to graduate programs
across the country. She was accepted to North Carolina State University beginning in Fall 2008.
Prior to entering graduate school, Meghan took some time to enjoy the California mountains
with her husband, spending her final three months before graduate school hiking a portion of
the Pacific Crest Trail.
While at school at NC State, Meghan continued expanding her teaching experience as well
as developing research experience. Three influential teaching experiences were opportunities to:
co-design and co-lead a professional development workshop in physics for in-service elementary
school teachers, assist in teaching the Physics in Everyday Thinking curriculum to pre-service
experience fueled a deeper interest in helping her students connect with physics conceptually.
Her research reflects her desire to better understand human relationships in physics
class-rooms. Her interest in this research is also personal, born from continuous reflection on her own
experiences with her students. She hopes her project will be helpful both to future researchers
interested in studying teacher-student interactions and to teachers who share an interest in
ACKNOWLEDGEMENTS
Many people have helped me on this journey, contributing in valuable ways to my education,
my progress, and my sanity. I am consistently inspired by the love and support I have received
and am eternally grateful for the amazing people in my life.
Each of my committee members has encouraged and challenged me in different ways, for
which I am grateful. I thank Laura Clarke for guiding me to continuously think about the
future: how I might use my research, publish it, and extend it. I thank David Haase for his
discussions on teaching and encouragement in refining my analysis. I thank Jason Swarts for his
guidance to think about and build an argument for the details of the design and analysis. I thank
Meg Blanchard for her empathy and for prompting me to embrace the messiness of qualitative
data along with the rigor of research. I want to especially thank Bob Beichner for mentoring
me to become independent. While the ability to choose my own path was overwhelming and
frightening at times, I am a better person and a better researcher for having to find my own
way. His faith in me has helped me build faith in myself. I also thank him for his support and
advice along the way. His availability to help, gentle honesty, and wisdom made him a great
advisor, for which I am eternally grateful.
I am also grateful to Ruth Chabay for her guidance as I first developed a research project.
She was both encouraging and inspiring and helped me jump into the data and get messy with
it. I greatly appreciate the long talks we had and will always welcome her guidance.
I am grateful to all the NC State PER grad students, past and present. I am blessed to
be able to call you all friends and colleagues. Mary Bridget Kustusch, Brandon Lunk, Jeff
Polak, Shawn Weatherford, and Evan Richards introduced me to the wonderful community of
Physics Education Researchers. I am grateful for their research guidance, emotional support,
and friendship. Bin Xiao, Ted Horton, Will Sams, and Colleen Lanz contributed to Agreement
and Validity of different parts of the research. I am especially grateful to Katie Foote for her
and her insight. Also, her enthusiasm, and energy were delightful, and I am truly grateful for the
opportunity to work with her. And finally, Jon and Amy Gaffney (Amy being an honorary group
member) offered wonderful mentorship, guiding me to let go of ideas that weren’t fruitful and
to follow the ones that impassioned me. Their guidance and friendship will always be treasured.
Finally, I’d like to thank my family for their continued support and encouragement: to my
amazing husband, Brian, for his love, assistance, encouragement and patience, without which
I might not have made it this far; to my parents, Jack and Joan, for their unconditional love
and faith in my ability to do this; to my sisters, brothers-in-law and nieces for their empathetic
support and encouragement, but especially for their comedy; to the Sweet-Friedlander and
Sweet-Hurni clan whose kind and motivating words are always uplifting and welcomed; and to
TABLE OF CONTENTS
LIST OF TABLES . . . xi
LIST OF FIGURES . . . .xiii
Chapter 1 Introduction and Overview . . . 1
1.1 Motivation . . . 3
1.1.1 Implications for GTA Professional Development . . . 8
1.2 The GTA’s Role . . . 9
1.3 Research Questions . . . 10
Chapter 2 Review of the Literature . . . 11
2.1 Introduction . . . 11
2.2 GTA-student Interactions . . . 12
2.2.1 Studies with GTA-student Interactions - Support . . . 12
2.2.2 Studies with GTA-student Interactions - Direct . . . 18
2.2.3 Students’ Responses . . . 28
2.2.4 Sample Study Including Multiple Interaction Elements . . . 33
2.2.5 In Summary . . . 34
2.3 Teacher-Student Interactions . . . 35
2.3.1 Teacher-Student Interaction Patterns . . . 37
2.3.2 Students’ Responses . . . 41
2.3.3 Connections to Content . . . 44
2.3.4 Sample Study Including Multiple Interaction Elements . . . 48
2.3.5 In Summary . . . 51
2.4 Conclusion and Research Questions . . . 52
Chapter 3 Methodology . . . 55
3.1 Qualitative Research Methods . . . 55
3.1.1 A Qualitative Approach . . . 57
3.2 Data Collection . . . 58
3.2.1 Choosing a Setting . . . 58
3.2.2 Matter & Interactions Curriculum . . . 58
3.2.3 Matter & Interactions Lab . . . 60
3.2.4 Data Sampling within Matter & Interactions Labs . . . 62
3.2.5 Selected Matter & Interactions Lab Activities . . . 64
3.2.6 Participants . . . 74
3.2.7 Video Recording and Processing . . . 81
3.3 Partitioning the GTA-Student Interactions . . . 85
3.4 Transcription . . . 86
3.5 Data Segmentation . . . 89
3.5.1 Data Segmentation Process . . . 89
3.6.1 Grounded Theory . . . 97
3.6.2 Use of Grounded Theory and Methodological Variations . . . 100
Chapter 4 Analysis: The Issues Framework . . . .102
4.1 Development of the Issues Framework . . . 103
4.1.1 What are Issues . . . 105
4.1.2 Pre-Interaction: How Issues Are Created . . . 125
4.1.3 During an Interaction: The GTA’s Focus and Address of the Issue . . . . 134
4.1.4 Post-Interaction: Issue Resolution and Other Student Actions . . . 154
4.1.5 Characteristics of the Interaction . . . 161
4.1.6 Issue Content Category . . . 176
4.1.7 Influences on the Issues Framework . . . 180
4.1.8 Complex Example . . . 184
4.1.9 Framework Limitation: Problem Type . . . 221
4.1.10 Using the Issues Framework . . . 222
4.2 Coding . . . 226
4.3 Agreement . . . 235
4.3.1 Agreement Results . . . 238
4.3.2 Summary of Agreement . . . 250
Chapter 5 Results . . . .252
5.1 Typical Story - All Data Together . . . 253
5.2 Construction Issues . . . 259
5.2.1 Getting Started (6 Issues): The Typical Story . . . 260
5.2.2 Getting Started: An Atypical Case - Encouragement of Student Input . . 272
5.2.3 Solution Approach (23 Issues): The Typical Story . . . 281
5.2.4 Solution Approach: An Atypical Case . . . 318
5.3 Execution Issues . . . 328
5.3.1 Unit Conversions (8 Issues): The Typical Story . . . 328
5.3.2 Unit Conversion: Two Atypical Cases . . . 339
5.3.3 Other (5 Issues): The Typical Story . . . 349
5.3.4 Other: Example 1 - Active Diagnosis . . . 351
5.3.5 Other: Example 2 - Listening Diagnosis . . . 356
5.3.6 Reflections on Execution Issues . . . 362
5.4 No Issue (5 Non-Issues) . . . 364
5.4.1 The Typical Non-Issue Story: Solution Approach . . . 365
5.4.2 Non-Issue: Other . . . 373
5.5 Review of Features Across Issue Content Categories . . . 374
5.5.1 Typical Stories . . . 374
5.5.2 Creation of the Issue . . . 375
5.5.3 Diagnoses . . . 376
5.5.4 AI and TAFI Mismatches . . . 381
5.6 Review of Features Across GTAs . . . 382
5.6.2 TAFI Components . . . 384
5.6.3 Sinput and Prompt . . . 385
5.6.4 Student Responses . . . 387
5.7 Limitations of the Issues Framework . . . 389
Chapter 6 Conclusions. . . .395
6.1 The Issues Framework as a Tool . . . 395
6.2 Results . . . 397
6.2.1 Implications for GTA Professional Development . . . 403
6.3 Future Work . . . 405
6.3.1 State of the Issues Framework . . . 405
6.3.2 Framework Limitations . . . 406
6.3.3 Future Research Suggested by the Framework . . . 409
6.4 Final Remarks . . . 411
References. . . .413
Appendices . . . .423
Appendix A Problem Solving Activities . . . 424
A.1 Young’s Modulus . . . 424
A.1.1 Purpose . . . 424
A.1.2 Questions to Explore . . . 424
A.1.3 Background . . . 425
A.1.4 Experimental Setup . . . 426
A.1.5 Measurements . . . 428
A.2 Throw a Ball Up in the Air (Ball Toss) . . . 434
A.2.1 Purpose . . . 434
A.2.2 Experimental Observations . . . 435
A.2.3 Analysis of Experimental Observations (on Whiteboards) . . . 435
A.2.4 Comparison and Reflection . . . 437
A.3 Fission Problem . . . 438
A.4 Spectra Problem . . . 443
Appendix B Coding Task Materials . . . 449
B.1 Issue Component Matching Task Materials - Students . . . 449
B.2 Issue Component Matching Task Materials - TA . . . 452
B.3 Issue Content Category Sorting Task Materials . . . 454
B.4 Characteristics of the Interaction Sorting Task Materials . . . 458
B.5 Issues Features Coding: Survey . . . 468
B.5.1 Coding Instructions . . . 468
B.5.2 Survey Format . . . 474
B.5.3 The Survey . . . 475
B.5.4 Feature Descriptions . . . 520
Appendix C Agreement Results . . . 528
Appendix E Background Questionnaires . . . 567
E.1 GTA Background Questionnaire . . . 567
E.2 Student Background Questionnaire . . . 570
Appendix F Data Collection and Processing Methods . . . 572
F.1 Data Collection Methods . . . 572
F.1.1 In Vivo Data Collection (2010 and 2012 Spring Semesters) . . . 572
F.1.2 In Vitro Data Collection (Fall 2010 Semester) . . . 575
F.2 Video Data Processing . . . 577
LIST OF TABLES
Table 3.1 GTA population 2012 . . . 75
Table 3.2 Background information on student participants and the class population in 2012. Numbers in both rows are averages. . . 76
Table 3.3 Background information on GTAs from 2012 (GTA 1, GTA 2, GTA 3) and Fall 2009 (GTA 4). *Gender of general population was not asked on the survey. 77 Table 3.4 All lab activities from which data was used for selected GTA participants in their respective years. . . 79
Table 3.5 Sample Transcript: GTA-Student Interaction . . . 90
Table 3.6 Sample Transcript: Before the GTA-student interaction, students only . . . . 91
Table 3.7 Sample Transcript: Beginning the GTA-student interaction . . . 92
Table 3.8 Sample Transcript: Ending the GTA-student interaction . . . 94
Table 3.9 Sample Transcript: Complete condensed version . . . 96
Table 4.1 Sample Transcript for coding Interaction Characteristics . . . 228
Table 4.2 Issue Content Category Reliability Results. Bold under “Sample Size N” columns indicates necessary sample size was exceeded in this study. Bold un-der “Reliability Results” columns indicatesαK ≥0.667 or Simple Agreement ≥0.8 for adequate sample size. . . 241
Table 4.3 Characteristics of the Interaction Reliability Results. The “*” denotes αK values that may be lower than expected due to prevalence. Bold under “Sample Size N” columns indicates necessary sample size was exceeded in this study. Bold under “Reliability Results” columns indicates αK ≥ 0.667 or Simple Agreement ≥0.8 for adequate sample size. . . 244
Table 4.4 Issue Coding Survey Reliability Results. Bold under “Sample Size N” columns indicates necessary sample size was exceeded in this study. Bold under “Re-liability Results” columns indicates αK ≥0.667 or Simple Agreement ≥0.8 for adequate sample size. The “*” denotesαK values that may be lower than expected due to prevalence. . . 248
Table 4.5 Framework features with acceptableαK values. . . 251
Table 5.1 All Solution Approach Issues sorted by diagnosis and by the number of AI components mismatched with their respective TAFI components. *See foot-note 24 . . . 316
Table 6.1 Framework features with acceptableαK values. . . 398
Table B.1 All Issues Framework Features and Descriptions . . . 520
Table C.2 Issue Content Category Reliability Results. Bold under “Sample Size N” columns indicates necessary sample size was exceeded in this study. Bold un-der “Reliability Results” columns indicatesαK ≥0.667 or Simple Agreement
≥0.8 for adequate sample size. . . 537 Table C.3 Characteristics of the Interaction Reliability Results. The “*” denotes αK
values that may be lower than expected due to prevalence. Bold under “Sample Size N” columns indicates necessary sample size was exceeded in this study. Bold under “Reliability Results” columns indicates αK ≥ 0.667 or Simple
Agreement ≥0.8 for adequate sample size. . . 538
Table D.1 This table shows frequency results for all framework features by Issue Content Category. Bolded numbers indicate those features considered typical - occur-ring 65% of the time or more. “*” indicates daughter features that are present 65% of the times the parent features is present (only when the parent feature is bolded) and over 50% of the total times. “**” indicates features that are present at least 65% of the time when added together (e.g. SPI -P same + SPI - P diff). “†” appears once and indicates that 65% of unique diagnoses are Work, even though Work diagnoses account for only half of all Unit Con-version Issue diagnoses. In the section of the SPI During the interaction only rows for which the SPI component is different from the AI component are displayed (all gray). When the components are the same, those features only get counted in the AI rows to avoid double counting. . . 539 Table D.2 Frequency results for all framework features by GTA. In the section of the
LIST OF FIGURES
Figure 3.1 Fission Problem Statement includes the problem story, the story diagram (the correct order of events is c, a, b), and the first four questions asked of the students. Focus is on the last of these questions, but may take dialog and interactions concerning the first three questions as they appropriately
pertain to the last question. . . 66
Figure 3.2 Spectra problem statement . . . 71
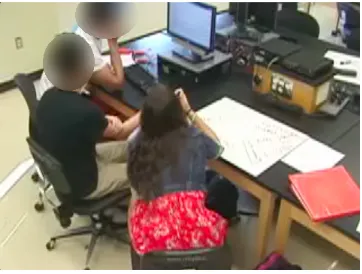
Figure 3.3 The group as captured by the over-the-shoulder camera. . . 81
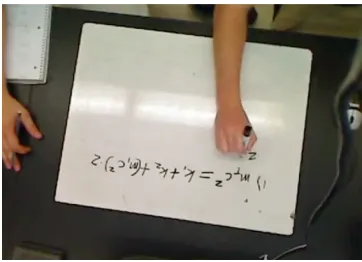
Figure 3.4 The whiteboard work as captured by the overhead camera. . . 82
Figure 3.5 The PC work as captured by the screen capture software - BBFlashback. . . 82
Figure 3.6 The group as captured by the webcam. . . 83
Figure 3.7 The entire class gathered in the in vitro study. This was used only if the face capture failed. The group observed in this image is the one at the bottom, closest to the camera. . . 83
Figure 3.8 Final video after processing was completed. . . 84
Figure 3.9 Final video from the in vitro data after processing was completed. . . 85
Figure 3.10 A sample of transcription. Each actor is listed along the top. Cells with expressions or actions in them are colored blue along with containing text. The gray region marks the interaction with the GTA. . . 88
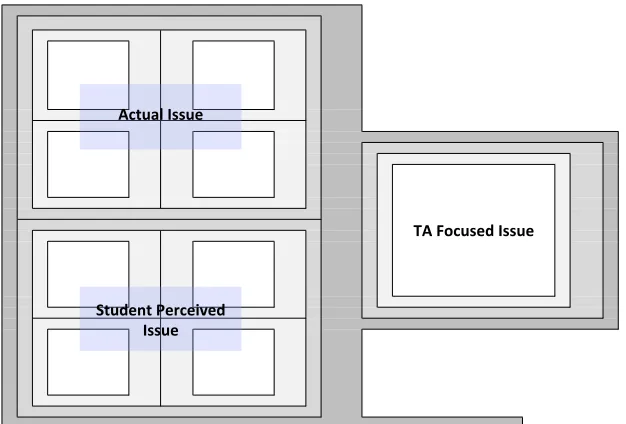
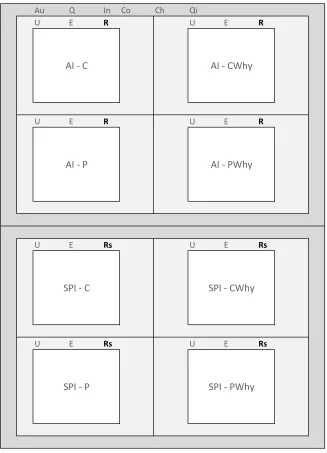
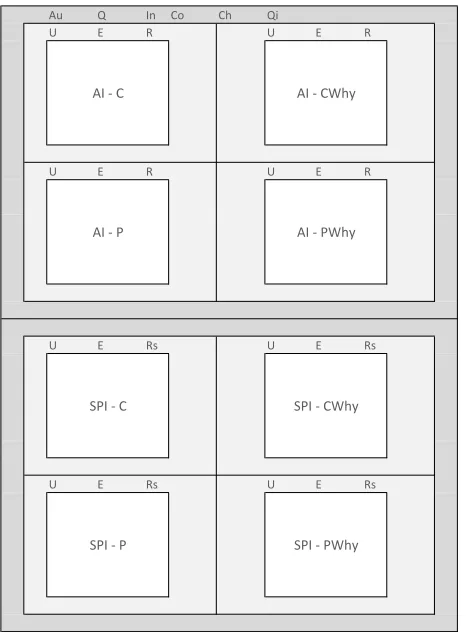
Figure 4.1 An outline of the framework diagram shows the location of the three kinds of Issues identified in the framework as well as the basic structure of the framework diagram. The four innermost white squares at the top left make up the Actual Issue. Those at the bottom left make up the Student Perceived Issue. The inner white square on the right is the GTA Focused Issue. Features will wrap around these squares in the different gray layers. Time will be indicated by the location of the features along the top of layers (before the interaction), the side of the layers (during the interaction) and the bottom of the layers and the bottom extended arm (after the interaction). . . 104
Figure 4.2 The innermost layer of the diagram, the four components of the Issue, are shown. They are labeled accordingly: C - Conceptual, CWhy - Conceptual Why, P - Procedural, and PWhy - Procedural Why. . . 107
Figure 4.3 The inner layer of the example Issue has the P component filled in with its respective contents. Other components not yet filled in remain labeled accordingly. . . 110
Figure 4.4 The inner layer of the example Issue is completely filled in with the contents of each component. The components locations remain the same with C (upper left), CWhy (upper right), P (lower left), and PWhy (lower right) . . . 112
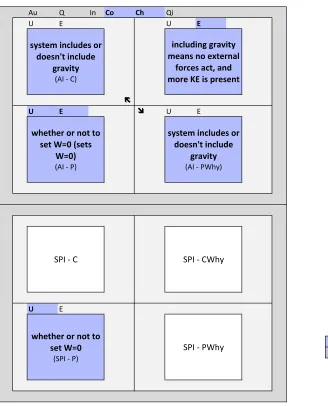
Figure 4.6 The inner layer of the framework for the first example Issue has all compo-nents of the AI and SPI filled in. Blank compocompo-nents remain uncolored and labeled only. The AI is always blue. The SPI is blue in this example, as it is the same as the AI. The key differentiates between the AI (blue) and the SPI (purple), should the SPI ever differ from the AI. . . 118 Figure 4.7 A second layer is added around each component of the inner layer of the
example Issue diagram. This layer displays Uncertainty (U) and Error (E) for each component of the AI and SPI. . . 121 Figure 4.8 A second layer is added around each component of the inner layer of the
example Issue diagram. This layer displays Uncertainty (U) and Error (E) for each component of the AI and SPI. U and/or E are highlighted above components in which they are present AI P, AI CWhy, and SPI P -in the example Issue. Additionally, the presence of the diagonal arrow -in the center of the AI indicates that the C and PWhy components share the same contents . . . 124 Figure 4.9 A third layer is added around the second layer. This layer enwraps all
compo-nents within each, the AI and SPI. This layer displays the creation features - Automatically (Au), Independent (I), Question Generation (Qa,na),
Chal-lenge (Ch), Question (Qi), Collaborate (Co) - for the AI. . . 127 Figure 4.10 A third layer is added around the second layer in the example Issue diagram.
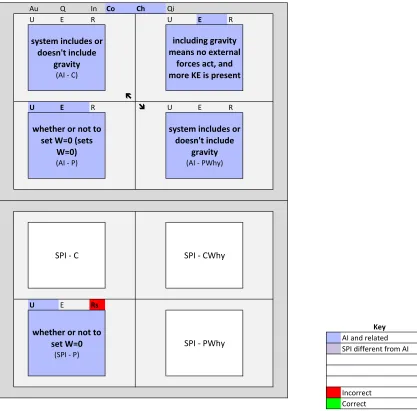
This layer enwraps all components within each, the AI and SPI. This layer displays the creation features for the AI. The highlighted features - Co and Ch - are present in the example Issue. . . 130 Figure 4.11 The Resolve feature (R) has been added above each component of the AI
and SPI in the second layer of the diagram. . . 132 Figure 4.12 The Resolve feature (R) has been added above each component of the AI and
SPI in the second layer of the example Issue diagram. It is highlighted red in the SPI - P component indicating an incorrect Resolution by the students before the interaction. The key now includes two more colors to distinguish between correct (green) and incorrect (red) Resolutions. . . 134 Figure 4.13 The TAFI components have been added to the diagram. They are placed off
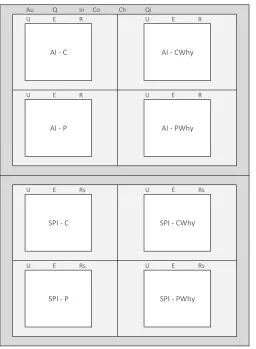
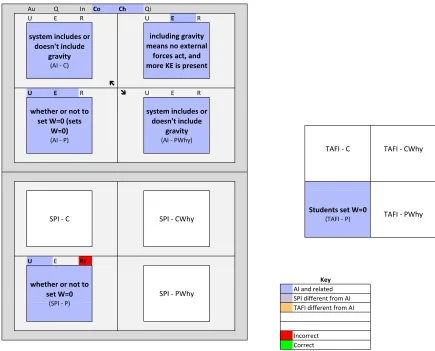
to the side to indicate they are only present during the interaction. . . 137 Figure 4.14 The TAFI components have been added to the example Issue diagram. The
contents of each component are filled in according to their presence in the example. Blank components remain uncolored with a label only. The TAFI is blue, indicating it is the same as the AI. The key now contains a new color (orange) to differentiate between the AI and TAFI, should the TAFI ever be different from the AI. . . 139 Figure 4.15 A second and third layer have been added around the TAFI. No features
pertain to the specific components of the TAFI, so the second layer is blank. The third layer contains the features that concern the TAFI as a whole - Go (crossed out in the diagram as it is no longer used16), Get, Rectify, Redirect,
Figure 4.16 A second and third layer have been added around the TAFI of the example Issue diagram. No features pertain to the specific components of the TAFI, so the second layer is blank. The third layer contains the features that concern the TAFI as a whole. The features present in the example Issue - Get and R - are highlighted. Get is blue to match the TAFI. R is green to indicate a correct resolution of the TAFI. . . 143 Figure 4.17 The Issue Address features - Address, Conceptual (Conc), Procedural (Proc),
Resolve (R), Functionally Resolve (Rf), and Shift - have been added to the side of each component of the AI and SPI in the second layer of the diagram. 146 Figure 4.18 The Issue Address features have been added to the side of each component
of the AI and SPI in the second layer of the diagram. Features are high-lighted next to components in which they are present - AI - P and SPI - P - in the example Issue. Features are blue in accordance with their respective components. R is green indicating the component is resolved correctly. . . 148 Figure 4.19 The fourth and outermost layer is added enwrapping the AI, SPI, and TAFI.
This layer contains features concerning the Issues most generally. I-Start is added here to indicate the Issue beginning the interaction - AI, SPI, TAFI, or other. . . 150 Figure 4.20 The fourth and outermost layer is added to the Issue example diagram. This
layer contains features concerning the Issues most generally. AI is added as the Issue that began the interaction. It is colored blue in accordance with its components. . . 151 Figure 4.21 The list of other actions students may do during an interaction - Restart,
Move, Demo, Feel - is added to the outermost layer. . . 153 Figure 4.22 Features concerning the resolution of the Issue after the interaction - R, Rf,
Shift - are added accordingly along the bottom of the second layer of each component of the AI and SPI. . . 156 Figure 4.23 The list of other actions students may do after an interaction - M/R (Move or
Restart), Disc, Demo, Feel - is added to the outermost layer in an extension along the bottom of the diagram. . . 158 Figure 4.24 Other actions students may do during an interaction have been added to the
outer layer, middle column of the example Issue diagram. Resolution features after the interaction have been added along the bottoms of each component of the AI and SPI in the second layer. None are highlighted as none were found to be present. The list of other actions students may do after an interaction is added to the outermost layer in an extension along the bottom of the diagram. The feature found to be present - Move - is highlighted in yellow. Yellow is added to the key and indicates student behaviors that are not Issue specific. . . 160 Figure 4.25 Two features indicating who began the interaction - iStart (GTA or Students)
Figure 4.26 Two features indicating who began the interaction - TAStart - and who began the Issue topic - TATopic - have been added to the middle column of the outermost layer and highlighted pink helping indicate the GTA was responsible for these two things. Pink is added to the key and indicates GTA behaviors that are not Issue specific. . . 163 Figure 4.27 The Diagnosis feature - Active, Listen, Work, Abbrev - has been added to
the middle column of the outermost layer. . . 165 Figure 4.28 The Diagnosis feature - Work - has been added to the middle column of the
outermost layer indicating a diagnosis done by reviewing students work. It is colored pink as it is a GTA behavior. . . 167 Figure 4.29 The features concerning who directs the interaction - Directs (GTA or
Stu-dents) - and how they direct the interaction - HowD (Sinput or not for the GTA; Question, State, Disengage for the students) - is added to the middle column of the outermost layer. . . 170 Figure 4.30 The features concerning who directs the interaction - TAdirect - and how
they direct the interaction - Sinput - is added to the middle column of the outermost layer. The features show the GTA directs the interaction and en-courages student input. The features are highlighted pink, marking them as GTA behaviors. . . 171 Figure 4.31 The feature indicating students sharing ideas - SShare - is added to the middle
column of the outermost layer. . . 172 Figure 4.32 The full diagram for the example Issue shows all features with present features
highlighted. The feature indicating students sharing ideas - SShare - is added to the middle column of the outermost layer. . . 173 Figure 4.33 The completed diagram for the example Issue shows all features with case
specific redundant features SPI (Address, Conc, Proc, R) and TAFI (R) -removed. Features found present in the example are highlighted. . . 175 Figure 4.34 A sample of one component surrounded by its second layer. Time is indicated
going clockwise around the diagram. All features along the top come out before the interaction (U, E, R). All features along the side come out during the interaction (Address, Conc, Proc, R, Rf, Shift). All features along the bottom come out after the interaction (R, Rf, Shift). All layers of the diagram are mapped in this way. . . 176 Figure 4.35 The complete diagram frame is shown including the label for its Issue content
category in the upper right. . . 179 Figure 4.36 The complete diagram of the example Issue is shown including the label for
its Issue content category - Construction: Solution Approach - in the upper right. . . 180 Figure 4.37 Student whiteboard work shows an attempt at solving for U withk(92e)/(blank)
filled in with numbers. It reads 8.98755e9(92(1.60218e−19)/. Students lack a
Figure 4.38 Student whiteboard work shows a more developed strategy with Ei = RE
and Ef = RE+U. The formula for U is substituted in for K. Rest energy
is dealt with in a different Issue. Line 1: Ei = 233.99c2and Line 2: Ef =
233.99c2+ 8.98755e9(2(92(1.60218e−19))/ . . . 190
Figure 4.39 Fission Problem Statement includes the problem story, the story diagram (the correct order of events is c, a, b), and the first four questions asked of the students. Focus is on the last of these questions, but may take dialog and interactions concerning the first three questions as they appropriately pertain to the last question. . . 191 Figure 4.40 The AI (blue) and SPI (purple) are shown filled in with their respective
contents. The SPI is a different color from the AI because its contents are different from those of the AI. This is the first and innermost layer of the diagram. . . 199 Figure 4.41 The second and third layer have been added to the diagram. The second
layer surrounds each component of the AI and SPI. It contains Uncertainty (U), Error (E), and Resolve (R). These are highlighted above components for which they are present. The third layer contains all features of the creation of the AI. Those present are highlighted. All components highlighted sur-rounding the AI are blue to indicate association with the AI. All highlighted components surrounding the SPI are purple to indicate association with the SPI. The key includes red and green to indicate possible coloring of the R feature, though it is not present here. The diagonal arrows in the center of the AI indicate that the C and PWhy components share the same contents. . 203 Figure 4.42 The first, second, and third layer of the TAFI have been added to the diagram.
The contents of the TAFI fill their respective components in the first layer. It is highlighted orange to indicate it is different than the AI. The third layer is added with all student response features. None are highlighted indicating none exist in this example. Orange is added to the key to differentiate the TAFI from the AI when they are different. All TAFI specific features would get highlighted orange. . . 207 Figure 4.43 The diagram now contains the fourth and outermost layer. Features have
Figure 4.44 The diagram now shows all features possible after the interaction. The resolve features - R, Rf, and Shift - are added beneath each component of the AI and SPI. None are highlighted as none are present. The other action features have been added in the extension of the outer layer at the bottom of the diagram. Of the four possible, Demo and Feel are highlighted to show their presence. These are yellow indicating they are behaviors by the students. . . 215 Figure 4.45 The final complete diagram shows the rest of the interaction features filling
the middle column of the outermost layer. Who started the interaction and topic shows S iStart and S iTopic and are colored yellow indicating they are students behaviors. The diagnosis is Work, colored pink indicating a GTA behavior. Who directs and how show TAdirects and Sinput to show the GTA directs the interaction and includes student input. The feature indicating whether or not students share ideas shows Prompt indicating the students shared an idea after being prompted by the GTA to do so. These are all pink indicating they are GTA behaviors. Pink is also added to the key showing all features with that color as GTA behaviors. The Issue content label shows that this example Issue is one of Construction: Solution Approach. . . 219 Figure 4.46 Six Issues Framework diagrams from the Unit Conversion content category. . 223 Figure 4.47 A sample survey question as it appears to the coder. The survey section
headings are on the far left. The current section title, survey question, and possible responses are in the green box in the middle. Examples are below the box, and question instructions and definitions are on the far right. . . 232 Figure 4.48 Part of a data segment to be coded using the survey. Transcription from the
raw data is on the left while a description of the Issue is on the right. . . 233 Figure 4.49 A sample scene from the video data used alongside the transcript when coding
with the survey. . . 234
Figure 5.1 Issues diagram for the entire dataset. Features common to at least 65% of the dataset (or 65% of a parent feature and 50% of the dataset) are highlighted in this diagram. . . 254 Figure 5.2 A simple Issue diagram from the No Issue content category. It is considered
simple due to its scarcity of features. . . 257 Figure 5.3 A complex Issues diagram from the Solution Approach content category. It
is considered complex due to its greater number of features. . . 258 Figure 5.4 The Issue diagram for a typical Getting Started Issue. Features that are
present in at least four of six Issues are highlighted. . . 261 Figure 5.5 The Issue diagram for a typical Getting Started Issue. Highlighted, bolded
features are those present before the interaction begins. Other common fea-tures are muted. . . 262 Figure 5.6 An example Issue diagram showing a typical Getting Started Issue from the
Figure 5.8 The Issue diagram for a typical Getting Started Issue. Highlighted, bolded features are those present during the interaction. Other common features are muted. . . 266 Figure 5.9 The Issue diagram for a typical Getting Started Issue. Highlighted, bolded
features are those present after the interaction. Other common features are muted. . . 269 Figure 5.10 An example Issue diagram showing an atypical Getting Started Issue from
the Spectra Lab Problem 2. This diagram contains onlysomefeatures present in the typical story (AI, U, Address, Procedural talk, SPI, Abbrev, TAdirect, TAFI - P, Get, TAFI - R, Move). While the U, Address, and Proc features do exist in the typical story, note that the features in this example concern the AI - C component, which is atypical. The remaining features are unique to the example. All features present are highlighted. . . 274 Figure 5.11 Students’ whiteboard work shows S2’s drawing of the ball and spring model
of a quantized harmonic oscillator of a nitrogen molecule. . . 278 Figure 5.12 The Issue diagram for a typical Solution Approach Issue. Features that are
present in at least 15 of 23 Issues are highlighted. The TAFI - P is colored both orange and blue as neither was dominant. . . 283 Figure 5.13 The problem statement for finding vi of the ball using the energy principle
in the Ball Toss Lab. . . 285 Figure 5.14 The Issue diagram for a typical Solution Approach Issue. Highlighted, bolded
features are those present before the interaction begins. Other common fea-tures are muted. . . 286 Figure 5.15 An example Issue diagram for a typical Solution Approach Issue from the Ball
Toss lab. This diagram includes most features of the typical story (excluding Qi) as well as many features unique to the example. Highlighted, bolded features are those present during the interaction. Other features are muted. AI - P, U, E, Co, SPI - P, U are also present in the typical story Issue creation diagram. The two diagonal arrows indicate the C and PWhy components are identical. . . 287 Figure 5.16 The Issue diagram for a typical Solution Approach Issue. Highlighted, bolded
features are those present during the interaction. Other common features are muted. . . 290 Figure 5.17 An example Issue diagram for a typical Solution Approach Issue from the Ball
Toss lab. This diagram includes most features of the typical story as well as many features unique to the example. Highlighted, bolded features are those present during the interaction (All AI and SPI components are bolded re-gardless of whether they are Addressed during the interaction. Other features are muted. AI - P - Address, Proc, R; TAdirect, TAFI - P, and Sinput are also present in the typical story diagram. The two diagonal arrows indicate the C and PWhy components are identical. . . 291 Figure 5.18 The Issue diagram for a typical Solution Approach Issue. Highlighted, bolded
Figure 5.19 An example Issue diagram for a typical Solution Approach Issue from the Ball Toss lab. This diagram includes most features of the typical story as well as many features unique to the example. Highlighted, bolded features are those present after the interaction. Other features are muted. Move is also present in the typical story diagram. The two diagonal arrows indicate the C and PWhy components are identical. . . 294 Figure 5.20 Fission Problem Statement includes the problem story, the story diagram
(the correct order of events is c, a, b), and the first four questions asked of the students. Focus is on the last of these questions, but may take dialog and interactions concerning the first three questions as they appropriately pertain to the last question. . . 297 Figure 5.21 The Issue diagram for a typical Solution Approach Issue. Highlighted, bolded
features are those present before the interaction begins. Other common fea-tures are muted. . . 301 Figure 5.22 An example Issue diagram for a typical Solution Approach Issue from the
Fission Lab. This diagram includes most features of the typical story (ex-cluding Co) as well as many features unique to the example. Highlighted, bolded features are those present before the interaction begins. Other fea-tures are muted. AI - P, U, E, SPI - P, U, and Qi are present in the typical story as well. The two diagonal arrows indicate the C and PWhy components are identical. . . 302 Figure 5.23 The Issue diagram for a typical Solution Approach Issue. Highlighted, bolded
features are those present during the interaction. Other common features are muted. . . 304 Figure 5.24 An example Issue diagram for a typical Solution Approach Issue from the
Fission Lab. This diagram includes most features of the typical story as well as many features unique to the example. Highlighted, bolded features are those present during the interaction. Other features are muted. AI - P, Address, Proc, R, SPI - P, SiStart, TAdirect, TAFI - P, and Sinput are present in the typical story as well. The two diagonal arrows indicate the C and PWhy components are identical. . . 305 Figure 5.25 The Issue diagram for a typical Solution Approach Issue. Highlighted, bolded
features are those present after the interaction. Other common features are muted. . . 308 Figure 5.26 An example Issue diagram for a typical Solution Approach Issue from the
Fission Lab. This diagram includes most features of the typical story as well as many features unique to the example. Highlighted, bolded features are those present after the interaction. Other features are muted. Move is present in the typical story as well. The two diagonal arrows indicate the C and PWhy components are identical. . . 309 Figure 5.27 Spectra problem statement . . . 319 Figure 5.28 The Issue diagram for a typical Solution Approach Issue. Features that are
Figure 5.29 An example Issue diagram showing an atypical Solution Approach Issue from the Spectra Lab Problem 1. This diagram contains onlysomefeatures present in the typical story (AI, E, U, SPI, U, Co, Qi, Address, Proc, R, SiStart, SiTopic, TAFI, and Move).(While the E, U, Address, Procedural talk, R, and TAFI features do exist in the typical story, I note that the features in this example concern the AI - C component, which is atypical.) The remaining features are unique to the example. All features present are highlighted. . . . 323 Figure 5.30 Students’ whiteboard work shows S3’s drawing of the energy levels of a
hy-drogen atom. The ground state is labeled “ground.” To the left of the lines, the levels are number accordingly, “1,” “2,” “3,” “4.” The diagram is redrawn by the author for clarity. . . 324 Figure 5.31 The Issue diagram for a typical Unit Conversion Issue. Features that are
present in at least six of eight Issues are highlighted. I make an exception for the Work feature here which is present in four of six unique diagnoses. This is further explained in the section covering During the Interaction. . . 329 Figure 5.32 The Issue diagram for a typical Unit Conversion Issue. Highlighted, bolded
features are those present before the interaction begins. Other common fea-tures are muted. . . 330 Figure 5.33 Students’ whiteboard work shows S2’s calculation to find the mass of a
ni-trogen molecule. it reads (14.007)(2)/6.023x1023. It is missing a conversion
factor to change 14.007 grams into kilograms. . . 331 Figure 5.34 An example Issue diagram showing a typical Unit Conversion Issue from the
Spectra Lab Problem 2. This diagram contains all features present in the typical story as well as features unique to the example. All features present are highlighted. . . 332 Figure 5.35 The Issue diagram for a typical Unit Conversion Issue. Highlighted, bolded
features are those present during the interaction. Other common features are muted. . . 334 Figure 5.36 The Issue diagram for a typical Unit Conversion Issue. Highlighted, bolded
features are those present after the interaction. Other common features are muted. . . 337 Figure 5.37 An example Issue diagram showing an atypical Unit Conversion Issue from
the Young’s Modulus lab - Interactomic Spring Stiffness of Brass. The cre-ation features of this Issue are the same as the typical story (AI - P, E, Au). Some interaction features are unique to the example (Active, SiTopic, Sinput). All features present are highlighted. . . 340 Figure 5.38 An example Issue diagram showing an atypical Unit Conversion Issue from
the Spectra lab - Problem 2. Some creation features of this Issue differ from the typical story (U, AI - PWhy, SPI presence, Q-a, and Co). Interaction features are a mixture of typical and unique. . . 345 Figure 5.39 Spectra Problem Statement: Problem 2 . . . 346 Figure 5.40 The Issue diagram for a typical Other Issue. Features that are present in at
Figure 5.41 An example Issue diagram showing a typical Other Issue from the Young’s Modulus Lab - Cross Sectional Area of a Wire. This diagram contains features present in the typical story as well as features unique to the example. The diagnosis is Active. The blue/orange mixed colored TAFI - P indicates that the GTA focused on a more general Issue than what the students created before the interaction. All features are highlighted. . . 352 Figure 5.42 The problem statement for finding vi of the ball using the momentum
prin-ciple in the Ball Toss Lab. . . 357 358figure.caption.131
Figure 5.44 An example Issue diagram showing a typical Other Issue from the Ball Toss Lab. This diagram contains features present in the typical story as well as features unique to the example. The diagnosis is Listen. The orange TAFI -C/PWhy indicates the GTA is focused on additional physics content than what the was present before the interaction. The two diagonal arrows indicate the C and PWhy components are identical. . . 359 Figure 5.45 The Issue diagram for a typical Non-Issue: Solution Approach after
com-paring to the Construction: Solution Approach category. Features that are present in three of three Non-Issues and in the typical story of Solution Ap-proach Issues are highlighted. . . 366 Figure 5.46 The Issue diagram for a typical Solution Approach Issue. Features that are
present in at least 15 of 23 Issues are highlighted. The TAFI - P is colored both orange and blue as neither was dominant. . . 367 Figure 5.47 The Issue diagram for a typical Non-Issue: Solution Approach without
com-paring to the typical story in Construction: Solution Approach. Features that are present in all three of three Non-Issues are highlighted. The two diagonal arrows indicate the C and PWhy components are identical. . . 368 Figure 5.48 An example Issue diagram showing a typical Non-Issue: Solution Approach
from the Spectra Lab Problem 2. This diagram contains all features present in the typical story as well as features unique to the example. All features present are highlighted. The two diagonal arrows indicate the C and PWhy components are identical. . . 371
Figure A.1 Young’s Modulus Excel Sheet . . . 434 Figure A.2 Data field and answer boxes for vi. . . 438
Figure A.3 Fission Problem Statement includes the problem story, the story diagram (the correct order of events is c, a, b), and the first four questions asked of the students. Focus is on the last of these questions, but may take dialog and interactions concerning the first three questions as they appropriately pertain to the last question. . . 439 Figure A.4 Spectra problem statement . . . 444
Figure B.2 A sample survey question as it appears to the coder. The survey section headings are on the far left. The current section title, survey question, and possible responses are in the green box in the middle. Examples are below the box, and question instructions and definitions are on the far right. . . 475
Figure F.1 The group as captured by the over-the-shoulder camera. . . 573 Figure F.2 The whiteboard work as captured by the overhead camera. . . 574 Figure F.3 The PC work as captured by the screen capture software - BBFlashback. . . 575 Figure F.4 The group as captured by the webcam. . . 576 Figure F.5 The entire class gathered in the in vitro study. This was used only if the face
Chapter 1
Introduction and Overview
Physics education research (PER) has shown that students’ conceptual learning gains improve
more in environments that use interactive engagement methods (Hake, 1997; Redish &
Stein-berg, 1999). Interactive engagement methods are described by Hake as methods that are,
“...de-signed at least in part to promote conceptual understanding through interactive engagement of
students in heads-on (always) and hands-on (usually) activities which yield immediate feedback
through discussion with peers and/or instructors.” Though curricular and pedagogical tools aid
in making courses more interactive, it is ultimately the physics course instructors’ responsibility
for creating an interactive environment within the classroom. Often, these instructors are
Grad-uate Teaching Assistants (GTAs) assigned to teach labs and recitation sections.1 One of the
primary ways in which GTAs can promote interactive engagement in these classes is through
their interactions with students, making GTA-student interactions a valuable area to research.
Much of the prior research on physics GTA-student interactions focuses on GTAs’
spe-cific actions or beliefs, providing valuable information into how GTAs interact with students
and why they may do so in particular ways (West et al., 2013; Kyle, Penick, & Shymansky,
1980; Goertzen, 2010; Spike & Finkelstein, 2012a). Other research focuses on GTA training
programs, giving insight into how GTAs’ interaction behaviors might change with particular
training (Ezrailson, 2004; Smith et al., 1977; Pellathy, 2009). However, research on students’
ideas and behaviors within and surrounding those interactions is limited. Understanding this
aspect of interactions is very important to obtaining a more complete understanding of how
GTAs promote an interactive environment.
Prior research speculates that characteristics of GTA-student interactions might affect
stu-dents’ behaviors both within and outside those interactions (Irving, Martinuk, & Sayre, 2013;
Karelina & Etkina, 2007; West et al., 2013). Research by Irving et al. (2013) on students’
fram-ing shows that GTAs often help students change frames durfram-ing an interaction. And, Karelina
and Etkina (2007) describe examples showing that GTAs have the ability to help students
continue sense-making or hinder it by how they respond to the students in interactions. Some
of their evidence also shows students repeatedly follow up sense-making with asking the GTA
a question and getting a direct answer.2 West et al. (2013) also noticed a similar pattern in
their study: students waiting for a GTA and then receiving information.3 They speculate that
students to whom the GTA explains more may be more likely to wait for a GTA’s help than
to continue attempting to work through something difficult on their own.
Overall, research in this area is still sparse, but what exists supports the importance of
studying both the GTA-student interactions and the students outside of interactions. I
pro-pose to continue studying interactions and students’ actions outside interactions by designing
a framework that outlines the characteristics of these interactions and the students’ processes
before and after those interactions. The framework provides a basis for examining the
influ-ence of GTA-student interactions on students, leading to a better understanding of how GTAs
promote interactive engagement in their classrooms.
To prepare for this framework, Chapter 2 will explore previous research on GTA-student
interactions in the classroom, providing the background for the current study. Chapter 3 will
provide the study design and methods used to collect and process the data from which the
2
These instances occurred frequently in a traditional lab setting. In the non-traditional lab, students tended to follow up sense-making with procedures.
3
framework emerges. I present analysis methods and the full design of the framework in Chapter
4. Initial results of the application of the framework will be examined in Chapter 5, and Chapter
6 will discuss conclusions and areas of future work. The rest of this first chapter will offer further
motivation for the study as well as some background on the GTA’s role.
1.1
Motivation
Following the same focus as much of the previous research on GTA-student interactions, I began
studying GTAs in the classroom by looking solely at the GTAs’ interactions with students. I
observed similar GTA behaviors in my data as other researchers had before in theirs: mainly
that GTAs often tend to explain or ask targeted questions but don’t often ask students to
elaborate on their thoughts and ideas or carry open conversations with students (Paul, 2012;
Kyle et al., 1980; Goertzen, Scherr, & Elby, 2010a).
Some research has studied potential reasons behind GTAs’ interaction patterns, and
train-ing programs have been developed to help GTAs modify and refine their interaction practices
(Goertzen, 2010; Etkina, 2000). I began to think that examining the students’ processes
sur-rounding interactions, as well as the interactions themselves, would provide more understanding
of the GTAs’ practices. Motivated by my initial review of pilot data and some recent research on
GTA-student interactions (Paul, 2012), I specifically questioned how these interactions relate
to students’ ongoing processes throughout the activities in which they were involved.
It is worth exploring an example here that further illustrates my motivation for this
re-search. I present this example to demonstrate the need to further examine students’ processes
surrounding an interaction with their GTA as well as the GTA-student interaction itself. Doing
so provides insight into how the students’ processes are changed by the interaction, and thus
by the GTA’s teaching practices. This example is one I will return to throughout the study. It
motivated me to continue examining the rest of my data through a particular lens, leading to
the creation of the framework that is central to this research.
directly upward. They are asked to take the ball as the only object in their system, and to
apply conservation of energy to that system.4 At first I just examine the GTA-student
interac-tion itself. The GTA approaches the students as they work and can see what the students have
written on their large group whiteboard: 1/2mv2
f −1/2mvi2= 0
The GTA begins:
GTA:Why is the work done zero?
S2: hmm?
GTA:Why is the work done zero?
S2: It’s not?
S1: No. It’s not zero.
S3: It won’t be zero?
GTA: (GTA leaves)
The GTA begins the interaction by asking the students a probing question about their work
term. This has the effect of making the students question the value of their work term and
deciding almost immediately that it is incorrect. The GTA does not follow up with anything
further and leaves. Examining the GTAs’ question and lack of response to the students’
correc-tion, one can infer that the GTA did not actually intend for the question to be probing at all
but to identify an error the students had made.
This interaction is focused on directing the students’ attention to their error in setting work
to zero. The interaction nudges the students to refocus on their work term without going into
detail on what to do with that term. The interaction does not focus on any reasons for why
students might have set it to zero, or why it should not be zero.
Just looking at the students in the interaction, only three pieces of their process stand out:
1. they have set work to zero,
2. they identify work being zero as incorrect, and
4
3. S2 and S3 seem confused by that identification.
Examining the interaction, one can only glean a small part of the students’ process and how
it changes. Yet, their process outside of the interaction may be affected by the interaction as
well. Therefore, it would be valuable to analyze how the interaction is situated in the students’
process by analyzing what happens before and after the interaction. This analysis would provide
a better understanding of how an interaction with a GTA relates to the students’ process and
thus how it helps create a more or less interactive environment.
Examining what happens after the interaction can reveal whether the interaction led to any
further discussion, confusion, or progress for the students. In this example, the dialogue after
the interaction proceeds with:
S2: Work equals... I can’t remember the formula for work.
S1: No, work - Yeah, work is just, um, F x times Delta x plus F y Delta y plus, F z Delta z,
all added together (Fx∗∆x+Fy∗∆y+Fz∗∆z=W).
S2: Well, hold it. F y delta y is...
S1: So using gravity
S2: Everything is zero plus F y delta y.
S1: Gravity’s only going to have the y component.
S2: Yeah. Nine point eight one times...
In this case, the students keep moving forward - almost seamlessly moving from the
correc-tion that work is not zero to the correct formula for work. The focus on correcting the error
during the interaction is followed afterward by the students’ continued focus on making progress
toward a solution.
Though questions arose for S2 and S3 during the interaction that seem to indicate they
might be confused, there is no further discussion afterward to expand on that. Nor do the
students carry on any more discussion beyond what is necessary for completing the next steps.
students smoothly switching gears and continuing a procedure but not to further reasoning
about the switch.
Examining the portion of the students’ process before the interaction reveals how the
stu-dents came to set work to zero initially: whether the decision was shared or individual; and
whether or not the students discussed their reasoning for the move. The dialogue before the
interaction proceeds as follows:
S1: Change in kinetic energy equals work. Ah, work is zero, because you’re- it’s the
surround-ings... well...
S2: Well, then, how do you calculate the velocity if work is zero?
S1: ’cause your kinetic energy final equals fin-K, no, it needs...
S2: So...
S1: In this scenario, um, kinetic energy’s going to be one half m v squared.
S2: And work,
S1: So it’s going to be your final velocity minus your initial velocity.
S3: So final velocity equals initial velocity.
S1:Then your work- Your work is either going to be your gravity calculation then, or it’s going
to be zero.
S3: It should be zero.
S1: Cause if you’re choosing your surroundings to be, um, just the ball, you have to take into
effect gravity.
S1:But if you choose to make gravity, um, you include it in your system, then it’s zero, because
there are no other forces acting on it.
S2: But it can’t have zero in it, because zero makes everything zero.
S1:But, it doesn’t necessarily, because if you chose to have the ball and gravity in your
calcu-lation, your’e going to have more kinetic energy you have to calculate, so...
S3: (Writes out 1/2mv2
f −1/2mv2i = 0 on the whiteboard)
(The GTA then approaches, looks at the whiteboard, and begins the interaction.)
There is considerable discussion of ideas before the interaction. S1 correctly determines that
the work is the “gravity calculation” if the system only includes one object.5 S1 also determines
that the work should be zero if the ball and gravity are included in the system because there
would be no other forces in the surroundings. While his conceptual reasoning is correct in
general, it does not fit the equation the students are using, ∆K = W, which is the correct
equation for this problem. S2 sees this and challenges S1. S1 responds to the challenge by
incorrectly adding that the kinetic energies would be different, and so there should not be a
problem. S3 decides, with reasons hidden, that work should be zero and begins writing out the
energy terms for that scenario. S1 follows along, seeming to accept S3’s move.
In this example, ideas are expressed and challenges are made before a final decision is
accepted and the procedure to construct a solution continues. Not only is the decision to set
work to zero in error, S1’s reasoning for why it might be appropriate - that a gain in kinetic
energy would make up for it - is also erroneous.
Putting together the situation before, during, and after the interaction, now offers a more
complete picture of how the interaction is situated in the students’ process. The students first
discuss the reasoning for different possibilities of what to do with work, and one of the ideas
expressed is erroneous. A final decision is made to erroneously set work to zero. The GTA
focuses on the work being zero, but does not seek out the ideas behind it. The interaction
affects a change in the students’ procedure by pointing out their error. This change continues
after the interaction where the students immediately switch gears by setting work to the correct
term and continuing their solution. The students do not re-engage with the ideas they shared
before the interaction.
I presented this example to illustrate the need for further research of students’ processes
5
surrounding an interaction with their GTA as well as the interaction itself. While this study
will add to the body of research on GTA-student interactions in physics courses, it also holds
implications for GTA professional development.
1.1.1 Implications for GTA Professional Development
By analyzing how the interaction is situated in students’ processes, research may be able to
inform GTA training by providing GTAs with more specific details about how their interactions
work within the students’ processes. Assume for a moment that the example in the previous
section represents a common pattern in which students discuss their ideas about how to
con-struct a solution, make some decision on a procedural move, are corrected by the GTA, and
move on in a different direction, never returning to their previous discussion.
Just examining the GTA during the interaction, GTA training may encourage the GTA to
continue asking questions to pull students’ ideas out. Yet, the GTA would have to be prepared
for a broad range of responses from the students. Responses might range from complete ideas
coming out immediately to confusion, “I don’t know’s, or blank stares. It can be overwhelming
for a novice teacher to prepare and attempt to respond accordingly to so broad a range of
possible responses.
By looking at the entire pattern of the students’ process, one can narrow the range of
expected responses, knowing the students have already discussed their ideas. More targeted
training might instead guide the GTA to re-ignite the students’ previous discussion with each
other, knowing something incorrect came out of a discussion. This would allow the GTA to
step back for a moment, listen to the students repeat their ideas, and further diagnose their
situation from a less vulnerable position.
Focusing on the entire process rather than just the interaction may lead to improvements
in the specific guidance provided in GTA training. By creating a new framework, this study
1.2
The GTA’s Role
The focus of this research is on GTAs’ interactions with students. Therefore, it is helpful to
understand a bit about the GTAs’ situation. GTAs have multiple roles in graduate school. They
are students taking classes, beginning researchers, and teaching assistants. While each of these
roles is valuable to the GTAs’ professional development as a physicist, advancement through
graduate school is typically only dependent on their performance in the first two roles. There
is generally less motivation and support for the development of graduate students as teachers
than as researchers and physics content experts (Lin, 2008; Luft, Kurdziel, Roehrig, & Turner,
2004).
Physics GTAs are often novice teachers when first assigned to these roles. Typically, GTAs
get some form of teacher training, but the amount and quality of the training varies (Shannon,
Twale, & Moore, 1998; Luft et al., 2004). Lack of appropriate support and pedagogical
train-ing leaves GTAs unprepared to use research-supported teachtrain-ing methods in their classrooms.
Rather, Luft et al. (2004) found that GTAs based their teaching practice on their own intuition
and assumptions that their students learn in the same way they do. They taught accordingly
by giving information as clearly as possible with the expectation that students would spend
significant time outside of class actively engaging with the materials. However, this is not the
case everywhere, as several training programs have built in pedagogical instruction and support
for GTAs’ development as teachers (Etkina, 2000; Lawrenz, Heller, Keith, & Heller, 1992; Spike
& Finkelstein, 2012b; Holmes, Martinuk, Ives, & Warren, 2013).
GTAs are typically assigned to teach labs and recitation sections, though in some
circum-stances, GTAs might teach a majority of the course (Paul, 2012) or teach alongside a professor
in a course (R. J. Beichner et al., 2007). They are generally the sole instructor in a classroom
during the labs or recitation sections and may hold office hours or tutoring sessions outside of
these times as well.
The nature of the GTA’s job implies that they will be in closer contact with smaller groups
many opportunities to influence students’ learning processes through interactions. However,
these opportunities may not be fully utilized due to GTAs’ complex relationship with their
teaching role and the surrounding circumstances of graduate school.
1.3
Research Questions
Interactions with students are one of the few teaching practices physics GTAs have the
oppor-tunity to develop and use to create a more interactive environment.6 This makes interactions
a critical component of GTAs’ teaching. In this study, I develop a framework to examine how
GTA-student interactions are situated in students’ processes during physics problem solving
activities. This framework will focus on specific features of students’ processes and their
inter-actions with GTAs to answer the following questions:
1. How do the GTA’s interactions with students relate to the physics content students express
before, during, and after those interactions in an interactive environment?
2. How do the GTA’s interactions with students relate to the procedural moves students
make before, during, and after those interactions in an interactive environment?
6
Chapter 2
Review of the Literature
2.1
Introduction
This chapter provides a review of the literature on both GTA-student interactions and K-12
teacher-student interactions. Reviewing the body of literature on interactions will help inform
and support the need for the proposed research. To give a more complete picture of interactions,
I include literature on GTA-student interactions and teacher-student interactions in all STEM
subjects, not just physics. To better clarify the selection of literature in this chapter, I first
define what I mean by “interactions.” GTA-student interactions (and K-12 teacher-student
interactions) are reciprocal actions or influences exchanged between a GTA and one or more
students. These interactions can occur between a GTA and one student, a GTA and a small
group of students, or a GTA and an entire class of students. I do not limit interactions to any
one student-group size, but most of the research on GTA-student interactions is in the context
of small groups.1
I purposefully segment the body of literature on GTA-student interactions into two pieces.
The first piece, Section 2.2.1, reviews research in which GTA-student interactions are
exam-ined to identify what they reveal about other elements of teaching such as TA training or
the development of pedagogical knowledge. The second piece, Sections 2.2.2 - 2.2.4, reviews
research examining the GTA-student interactions directly. Research in this second piece seeks
to explore, describe, or explain the interactions as well as examine more about the students’
responses to the interactions. It is in this piece that I discuss some of the missing pieces in the
existing research on GTA-student interactions and what I examine in my own research. Finally,
I introduce research on K-12 teacher-student interactions, Section 2.3, that informs and
sup-ports the elements of GTA-student interactions I study. I conclude by recognizing that K-12
teacher-student interactions research has more explicitly studied some elements of interactions
that are missing from, but important to, GTA-student interactions research.
2.2
GTA-student Interactions
There are two primary ways GTA-student interactions are examined. There is research that
examines interactions to support studies of other aspects of teaching and learning (e.g. studies
on TA training). And, there is research focused on directly exploring, describing, or explaining
interactions using analytical tools and supplementary data sources. I will review the literature
of each of these ways separately. I refer to research of the first kind as “support” and of the
second kind as “direct.” The literature is segmented in this way because it provides a clear
path through the elements of interactions that are most important and clearly highlights the
relevant research along that path.
2.2.1 Studies with GTA-student Interactions - Support
Classroom observations of GTA-student interactions are a source of rich data useful for exploring
various aspects of GTAs’ teaching. This section examines the ways GTA-student interactions
are used when they are not the direct focus of the research, and what can be said about them