Article
A Systems Dynamics Enabled Real-Time Efficiency
for Fuel Cell Data-Driven Remanufacturing.
Okechukwu Okorie1*, Konstantinos Salonitis1, Fiona Charnley 2 and Christopher Turner 3
1 Cranfield University, Sustainable Manufacturing Centre, School of Aerospace, Transport and Manufacturing, MK43 0AL, Bedfordshire, United Kingdom; [email protected]; [email protected];
2 Cranfield University, Centre for Competitive Design, School of Water, Energy and Environment, MK43 0AL, Bedfordshire, United Kingdom; [email protected]
3 University of Surrey, Rik Medlik Building, Surrey Business School, Guildford, Surrey, GU2 7XH, United Kingdom.; [email protected]
* Correspondence: [email protected]; Tel.: +44-7859153124
Abstract: Remanufacturing is a viable option to extend the useful life of an end-of-use product or its parts, ensuring sustainable competitive advantages under the current global economic climate. Challenges typical to remanufacturing still persist, despite its many benefits. According to the European Remanufacturing Network a key challenge is lack of accurate, timely and consistent product knowledge as highlighted in a 2015 survey of 188 European remanufacturers. With more data being produced by electric and hybrid vehicles, this adds to the information complexity challenge already experienced in remanufacturing. Therefore, it is difficult to implement real-time and accurate remanufacturing for the shop floor; there are no papers that focus on this within an electric and hybrid vehicle environment. To address this problem this paper attempts to (1) identify the required parameters/ variables needed for fuel cell remanufacturing by means of interviews (2) rank the variables by Pareto analysis (3) develop a casual loop diagram for the identified parameters/ variables to visualise its impact on remanufacturing (4) model a simple stock and flow diagram to simulate and understand data and information-driven schemes in remanufacturing.
Keywords: Circular Economy, Remanufacturing, Fuel Cells, Data-Driven, Systems Dynamics.
1. Introduction and Related Research
In tackling the various challenges identified in the transition towards a circular economy of more sustainable, intelligent, sociotechnical systems, various approaches have been proposed. These have varied from the 3R’s of Reduction, Reuse and Recycling of materials and energy [1] to further versions of the 6Rs and 9Rs frameworks [2] & [3], which includes remanufacture of materials as a key circular business approach. While the concept of a “circular economy”, is relatively new [4] and certainly in research –the first CE article for the Journal of Resources, Conservation and Recycling is recorded in 2007 [5] remanufacturing, however, is not a new concept. According to Hatcher et al., [6], remanufacturing has been a common industrial activity since the Second World War. As an academic research area, however, remanufacturing only emerged as a topic in the late 1970’s and early 1980’s. Robert Lund’s 1984 investigation [7] into remanufacturing in the United States, comprehensively communicated the experience of the US as well as implications for developing countries. There has been a slow uptake of academic interest into remanufacturing as compared to other circular approaches such as recycling[6]. This may be attributed to the similar slow uptake in industry interest in remanufacturing, particular in comparison to recycling industry which has grown by 300% [8]. When 37 “design for remanufacture” papers were reviewed in Hatcher et al., (2011) [6], it was found that 6 were published in 1995-1999 rising 12 in 2000-2005 with only 19 published in 2006-2011, thus confirming the slow increase in remanufacturing-based research.
Within literature, there are various definitions of remanufacturing with Chapman, (2010), [9] & Hauser and Lund, (2008) [10] stressing that no universally accepted definition exists. Ijomah et al [11] state that this ambiguity has presented a key challenge for practitioners and researchers. In addition to the confusion in terminology associated with remanufacturing, differences in definitions have been seen to exist in the expected quality and performance level of a remanufactured product in comparison to a newly remanufactured product [12]. Hauser and Lund (2008) defines remanufacturing as [10] “the process of transforming durable products that are worn, defective, or discarded to a ‘like new or better’ condition through a production-bath process of disassembly, cleaning, refurbishment and replacement of parts, reassembly, and testing”. Ijomah 2009 [13] further argues that “the performance specification should be returned to the original level from the customers’ perspective and warranty will be given as equivalent to new products”. Chapman, (2010) [9] on the other hand define remanufacturing as, “an industrial process of returning a used product to at least its original performance, equivalent to or better than that of the newly manufactured product. The American National Standards Institute (ANSI) in a more recent definition argued that, “remanufacturing is a comprehensive and rigorous industrial process by which a previously sold, leased, used, worn, or non-functional product or part is returned to a “like-new” or “better-than-new” condition, from both a quality and performance perspective, through a controlled, reproducible and sustainable process”, [14]. Thus, remanufactured goods could be sold at a lower price but potentially (or often) with a higher profit margin, [15]. Following these definitions, it can be observed that the focus on remanufacturing has grown from the state of the product, to the condition of the remanufactured product, to the warranty and to the greater subject of sustainability. Figure 1 as adapted from [11] gives a generic remanufacturing process chart. Figure 2 gives a picture of a used and a remanufactured end product.
Figure 1: A generic manufacturing process chart. Adapted from Ijomah et al [11]
take up. Polk 2013, [16] states that 45% of gearboxes and 23% of engines on the aftermarket inventories of original equipment manufacturers (OEMs) are remanufactured worldwide.
Research related to remanufacturing are varied, however, they can be largely categorized into four- these include: (1) research into the processes in remanufacturing and design for remanufacture or DfRem; (2) the business models, frameworks and the wider supply chain associated with remanufacturing; (3) research into the benefits of remanufacturing; (4) challenges experienced in remanufacturing.
Research on remanufacturing and remanufacturing systems has been conducted by several authors. These include research on decision-making and Remanufacturing Decision-Making Frameworks (RDMF) for remanufacturing (Subramoniam et al., [17], Ismail et al, [18], Okorie, et al [19], Ijomah, 2009, [13], Abdulrahman, et al, 2015 [12]); remanufacturing production and lead times, (Inderfurth & van der Laan, 2001, [20], Kiesmuller, 2003 [21], Kiesmuller & Minner, [22], van der Laan et al, 1999 [23]); design for remanufacturing (DfRem), (Hatcher et al, 2011 [6], Hatcher et al, 2013, [24], Ijomah, 2007, [11], Yuksel, 2010, [25]); remanufacturing optimization procedures for inventory level and Economic Order Quantity, (Kiesmuller & van der Laan, 2001 [26], Koh et al, 2002, [27] Teunter, 2001, [28], van der Laan et al, 1996, [29], van der Laan et al, 1996) [30]; remanufacturing capacity planning, (Georgiadis, at al, 2006 [31], Kleber R., 2006, [32], Vlachos, et al, 2007[33]) and research on assessing metrics for remanufacturability, Bras & Hammond, 1996, [34]
Figure 2: An Example of Core and Remanufactured Product. Source: Tolio et al [35]
Within the scope of remanufacturing implementation benefits, several authors [15], [36], [6], [10], [37] have identified specific environmental, social and economic benefits. These include, a decrease in the use of resources, water and energy consumption, employment opportunities as remanufacturing is highly labor intensive as well as a 40-65% reduction in used material costs and lower capital investment in factories and equipment acquisition, [38].
Objectives and Outline of the Paper.
There are few papers that addresses these remanufacturing challenges. To the best of the authors’ knowledge, there are no papers which pointedly address remanufacturing challenges within an Industry 4.0 perspective where there are large data sets and subsequent information flow. This paper thus has the following objectives.
1.1 To identify the required remanufacturing parameters or variables required to implement real-time fuel cell remanufacturing.
1.2 To rank these variables by means of Pareto analysis.
1.3 To show the interrelationships between the key variables on remanufacturing by developing a causal loop diagram (CLD).
1.4 To model a simple stock and flow diagram (SFD) to simulate and understand data and information-driven schemes in remanufacturing
The remainder of the paper is organized as follows. Section 2 gives an overview into some terms and terminology utilized in this paper. In Section 3, the materials and methods deployed in meeting the objectives of this paper is described. Section 4 describes the analysis and discussion. In section 5, the results and conclusions are presented. Considerations for further work forms part of section 5.
2. Overview into Terms and Terminologies Important in this Research
2.1 System Dynamics Modelling and its Application for Automotive Systems
For modelling and simulation, this study uses System Dynamics, (SD). Employed for computer simulation modelling, SD is a methodology used for understanding the dynamic behavior of complex systems in order to analyze and solve complex problems[42]. A system is described as a set of elements continuously interaction over a period of time, [43] while the term dynamics, refers to the situation where these systems have variables that are constantly changing. Sterman, (2000) [44] states that in an SD environment, relationships and connections between the components are called the structures of the system. It is these structures that defines the system’s behavior, [44]. The functional idea of SD is the perception of a system as a “coherent whole”[45] in terms of its dynamics. Thus, the SD approach allows the user to take into consideration information feedback which exists in the modeled system as well as describing the causal dependence of elements of the system which is being tested, [45]. Discrete Event Simulation, (DES), is the most popular approach for simulation of models, however due to its “unnecessary complexity” [46] and time consuming nature, it is not utilized in this research.
SD modelling for the automotive industry utilizes the same process as used for other manufacturing industries. First, system representation is needed by both qualitative and quantitative approaches, [43], [47],[48]. The qualitative stages includes, identification of the system to be examined and the definition of its boundaries and interfaces, [43]. These boundaries and interfaces are: (1) the limitations of the system, (2) the aim of the study to be undertaken and (3) the input and output variables. A Casual Loop Diagram (CLD) is then built; this takes place as the conceptual model and constitutes the causal relationship between the identified variables. According to [43], the CLD also assists in defining the preliminary casual hypotheses which is used in simplifying the model presentation, [48]. Sterman, (2000; p.138), [44] states that a CLD consists of “variables connected by arrows denoting the causal influences among the variables”. Causal Loop Diagram are also referred to as Influence Diagram or ID, [49].
using three possible techniques: control theory, computational simulation and statistical analysis, [48]. Automotive manufacturing is extremely complex, requiring the machining, assembly and inspection of many components; hence formulating manufacturing within an automotive system using only mathematical equations is difficult [46]. A simulation approach, containing variables and relationships, which analyses and optimizes a given system structure is needed [46]. Thus, within an automotive shop-floor, simulations using SD can help in understanding interactions and potential difficulties, allowing the evaluation of different alternatives, thus reducing the number of changes in the final system, [52]. These are reasons why SD is an appropriate method for investigating the remanufacturing process. We shall proceed to understand the parameters or variables required for efficient remanufacturing.
2.2 Parameters for Remanufacturing
Parameters required to remanufacture a product can also be defined as metrics for remanufacturing[34] or remanufacturing variables or remanufacturing parameters[53]. According to Okorie et al, (2018) [53] parameters required for end-of-life strategies such as remanufacturing are normally obtained from a close examination of the type and function of a product during its useful life. Greater insight into the parameters for remanufacturing can be seen via another manufacturing quantity, the condition-based maintenance (CBM). CBM recommends maintenance decisions and schedules are obtained through monitoring operational data and behavior of the machine-product while in operation, normally sensor-embedded product. Thus, variables such as temperature, vibration analysis data, oil analysis data that inform the health of the machine-product are collected and analyzed.
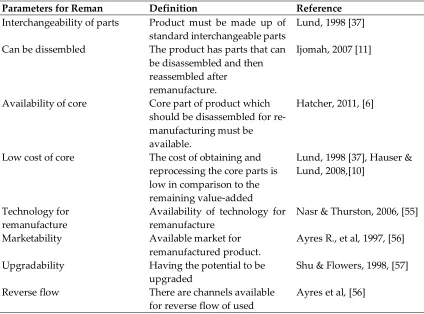
The table below gives certain parameters required by an OEM during the decision to remanufacture, (modified from [54]).
Table 1: Parameters for Remanufacturing
Parameters for Reman Definition Reference
Interchangeability of parts Product must be made up of standard interchangeable parts
Lund, 1998 [37]
Can be dissembled The product has parts that can be disassembled and then reassembled after
remanufacture.
Ijomah, 2007 [11]
Availability of core Core part of product which should be disassembled for re- manufacturing must be available.
Hatcher, 2011, [6]
Low cost of core The cost of obtaining and reprocessing the core parts is low in comparison to the remaining value-added
Lund, 1998 [37], Hauser & Lund, 2008,[10]
Technology for remanufacture
Availability of technology for remanufacture
Nasr & Thurston, 2006, [55]
Marketability Available market for
remanufactured product.
Ayres R., et al, 1997, [56]
Upgradability Having the potential to be upgraded
Shu & Flowers, 1998, [57]
Reverse flow There are channels available for reverse flow of used
product
Length of life cycle Product technology is stable over more than one life cycle
Lund, 1984 [7]
Traditional remanufacturing utilizes parameters as itemized in Table 1. However, where the product contains embedded smart sensors, product End of Life recovery is expected to be more data-driven than product in traditional remanufacturing. According to [58] uncertainty in the quality, quantity and frequency of product returns has been identified as one of the prevalent issues faced by remanufacturers. This issue, also highlighted in [41] has serious impact on decision-making for product remanufacturing. While quality categorization of product returns, [59] and customers incentives to promote returns [60] have helped in addressing this issue, the presence of uncertainty in product information[58] is suggested as a reason why these remanufacturing issues have lingered. The subject of embedded sensors in products, used to gather useful information, including information about remanufacturing parameters, has received considerable research interest [58].
2.3 Fuel Cell and Remanufacturing
Since it was identified as an “environmentally aware energy supply”, [61] Fuel Cell (FC) technology has been used to replace energy supply systems such as batteries. Alaswad et al., (2016) [62] describes these benefits as revolving around their high efficiencies and low emissions. Composed of three active components, the fuel electrode (anode), an oxidant electrode (cathode) and an electrolyte in between them; a fuel cell is an electrochemical device that coverts the chemical energy of a fuel directly into electrical energy [63]. The fuel cell provides an integrated cleaner alternative to the thermal processes involved in traditional based engines. Current combustion-based engines and energy generating technologies constitute harm to the environment and contribute to many global issues, predominantly of which is climate change, [63]. Fuel Cells provides sustainability solutions and energy security to these issues. The static nature in fuel cells also means that it can operate without the challenge of noise or vibration, [62].
The most popular type of fuel cell is known as the Proton exchange membrane fuel cells (PEMFCs). In the PEMFCs, a solid polymer is used as an electrolyte and porous carbon electrodes are also utilized as an electrolyte, [62] as shown in Figure 3.
Figure 3: Typical PEM fuel cell operational processes (Source: Helsinki University of Technology [64])
The transportation industry is responsible for 17% of global greenhouse gas emissions every year, [63]. Thus, in the development of clean energy technologies, Electric Vehicles (EVs), have been touted as an excellent option for the reduction of emissions in the transportation sector, [62]. Currently, EVs are either driven by electrical energy stored in batteries or fuel cell units. Power units in EVs are composed of two stacks with each containing 40 fuel cells making 80 FCs in all. There is a tank that supplies the hydrogen. Battery-driven EVs (BEVs) have the challenge of weight and recharging duration [65]. This limits the driving range of traditional BEVs. Fuel cell electric vehicles, FCEVs on the other hand, are superior to batteries in terms of volume, mass, initial greenhouse gas reduction and refueling time [62].
Figure 4: Removable Fuel Cell Stack (Source: Sharaf & Orhan, (2014, [63])
Despite the growing academic and manufacturing interest in FCs, end-of-life interest in FCs, especially remanufacturing, has received little research to date. A SCOPUS search of “remanufacture*” and “fuel cell*”, revealed only 8 results. Out of these 8 articles, only 2 come from Journals and there have been only 4 publications on this topic since 2013. This suggests that the research area is still in its infancy. A SCOPUS search of “recycle*” and “fuel cell*” on the other hand, yielded an initial 757 document results. Remanufacturability of fuel cells though, at the end of life, is possible as fuel cell stacks (as shown in Figure 4) in FCEVs have been shown to be recoverable when they reach their end of life, [66]. Understanding remanufacturing of fuel cells starts at the point of design for remanufacture and lifecycle assessment of the FC [67]. As electric vehicles are expected to increase, [18] fuel cells, a key energy source for EVs, will be an increasingly important component of the circular economy. This research aims to add to the body of knowledge for the remanufacturing of FCEVs.
2.4 Real-Time Efficiency in Remanufacturing
shop-floor [71], as well as analyze real-time remanufacturing efficiency. Several scholars, (Baker & Scudder 1990, [72]; Frantzen et al, 2011, [73]; Chen et al, 2015, [74]) recognized that lack of real-time data leads to a significant increase in the cost, energy consumption and delivery tardiness. To address these problems real-time data collection is proposed. [71] The battery management system, (BMS) which holds the rechargeable energy system and fuel cells in electric vehicles is able to collect data using sensors. This method can improve data collection and data efficiency as well as overall remanufacturing efficiency.
3. Materials and Methods
In this section the method utilized in identifying and itemizing the data parameters required for real-time fuel cell remanufacture is presented.
3.1 Semi-Structured Interviews
In order to explore the data parameters for fuel cell remanufacture, semi-structured interviews were undertaken. According to Robson (2002), [75], this type of interview method, “has predetermined questions, but the order can be modified based upon the interviewer’s perception of what seems most appropriate. Question wording can be changed and explanations given; particular questions which seem appropriate with a particular interviewee can be omitted, or additional ones included”. Hence, this kind of interview offers greater room for flexibility to the interviewer and interviewee and can be administered via a face-to-face interview session or via a phone/ video conferencing call session. Semi-structured interviews are exploratory, using qualitative designs and can supporting quantitative research[76].
In the choice of organisation and respondents to interview, an initial search for remanufacturing and automotive companies was undertaken using the “European Remanufacturing Network” database, (www.remanufacturing.eu). This database holds case studies 66 companies across range of 10 key industry sectors. However, the focus was on the automotive sector, so an initial pruning was performed. Emails were sent and phone calls were made to the 19 companies who had automotive sector case studies recorded in the database. Out of these 19 companies, 9 responded and further discussions were held. Three companies eventually agreed to participate. While this number is a fraction of the initial pool of 19 possible companies, Dyer and Williams, (1991) [77] argue that smaller case studies improve the capturing of greater detail regarding the context within which the problem studied exists. These selected respondents also showed willingness to participate and share deeper characteristics of their companies. Selected companies have had an ongoing collaboration with research Universities and this was an enabling factor.
3.2 Case companies’ profile
Organisational and respondent’s characteristics for this research are shown in Table 2. Respondents are denoted by numbers (1) – (6). The companies selected for the study are innovative and leading companies in their respective fields of digital manufacturing research, remanufacturing and automotive manufacturing. Below are the profiles for the participating companies.
Company A are a digital Manufacturing and remanufacturing research company. They are an independent business, operating from three offices in the United Kingdom. They were formed in 2012 and are a strategic partner to the manufacturing sector providing valuable services to government funded programmes, private business as consultants and collaborators with academia. Their capabilities include advanced manufacturing research, virtual engineering, circular value chains, data analytics for resource efficiency and manufacturing new technologies. Collaborators for Company A include Microcab Industries Ltd, MCT Reman Ltd, Env-Aqua Solutions Ltd and Hydrogen London.
member of various remanufacturing and manufacturing networks across the world. Suppliers include JLR, Ford, Leyland Trucks, Arriva, Volvo, Textron, Caterpillar and a host of others.
Company C are a UK-based hydrogen-powered fuel cell vehicle manufacturer. With a design studio in Spain, their business model is one which puts stakeholders, sustainability and profitability at the core of the business. Their prototype hydrogen fuel-cell car has a range of 300 miles on a 8.5kW hydrogen fuel cell and with emissions of zero at tailpipe (just water vapour). With an employee strength of 25, their partners include Michelin, KS composites, Sevcon, SDC Seat Design. Circular Economy is at the heart of what they do.
All companies asked to remain anonymous for this research. The respondents for the three companies were selected primarily because of their knowledge and experience in remanufacturing, sustainability and the fuel cell electric vehicles. Where the experience in fuel cells were not applicable, respondents were selected based on the first two criteria. All respondents were vastly experienced and were top management employees with oversight functions that included the circular economy and sustainability. In total 6 employees were interviewed across the three selected companies. These employers, experts in their fields, were from different professional backgrounds and experience (but with at least a minimum of a year’s experience in remanufacturing) and this helped in capturing important details and deepened the information captured to meet the objectives of this research. Ensuring that respondents were from diverse professional backgrounds is important in mitigating the criticism of bias and skewness in responses, as suggested in Dyer & Wilkins, 1991 [77]
Table 2: Profile of Respondents & Companies
Characteristics Company A Company B Company C
Ownership Independent business Independent, private business
Independent, private business
Main product Digital Manufacturing Research
OEM steering sys, remanufacturing of vehicle hydraulics and steering, military engineering.
Hydrogen-powered fuel cell vehicle manufacturer
Role of Respondent(s) Manager, Circular Economy & Digital Manufacturing (1)
Managing Director (2), Remanufacturing Sales &Parts
Specialist (3); Head of Remanufacturing (4)
Systems and Sustainability
Engineer (5), Systems & Software architect (6)
Year(s) of Experience 6 33; 2; 13 13; 27
Customers Global, Europe-
focused
Global Europe, UK-focused
Plant Location UK, 3 locations UK UK Head office,
Barcelona Design office
Year of Establishment 2012 1971 2007
Certification NA ISO 9001: 2015 NA
Main Client Private businesses, Government funded research, universities and research institutes
Jaguar Landrover, Textron, Leyland trucks, Ministry of Defence, Berendsen
Public
Remanufacturing knowledge
Extensive Extensive Medium
Table 3 gives a compilation of the data gathered from the respondents as it relates to the questions asked. The researchers developed questions which requested respondents to give their views on the expanding parameters for data-driven remanufacturing. The data was gathered via face-to-face interviews; 2 were held at the companies’ on-site location and the third, for Company A, was administered via WebEx video conferencing. For data collection, a two-part questionnaire was developed. Part A consisted of questions relating to the company’s experience in remanufacturing. Part B consisted of questions on existing parameters for remanufacturing, new parameters for remanufacturing sensor enabled components such as the fuel cell in electric vehicles, their rank of importance and efficiency calculation for fuel cell remanufacturing. The questions were developed based on an extensive review of literature, several discussions amongst the authors and were first tested with the respondent from Company A. This extensive evaluation of the questionnaire helped the researchers to produce a comprehensive list of questions and from the first feedback, produced a more objective list. After the first round of interviews, follow-up questions were sent to respondents via telephone calls and emails. This was completed to ensure a thoroughness of the data collection process and to answer any criticism relating to issues of respondent numbers [12].
4. Analysis and Discussion
4.1 Pareto Analysis of (Data-Driven) Remanufacturing Variables
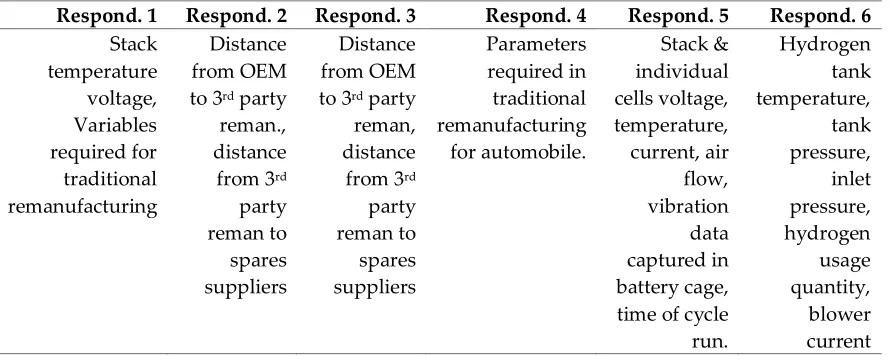
Respondents were asked to give their expert judgment on the variables which they view as important in remanufacturing fuel cells in EVs. As fuel cells are enclosed within a Battery Monitoring System (BMS), respondents were encouraged to suggest possible remanufacturing variables which they felt should be considered for remanufacturing the fuel cell. This is shown in Table 3.
Question 1: What are the variables needed for remanufacturing the fuel cell?
Table 3: Variables needed for Fuel Cell Remanufacture
Respond. 1 Respond. 2 Respond. 3 Respond. 4 Respond. 5 Respond. 6 Stack temperature voltage, Variables required for traditional remanufacturing Distance from OEM to 3rd party reman., distance from 3rd party reman to spares suppliers Distance from OEM to 3rd party reman, distance from 3rd
party reman to spares suppliers Parameters required in traditional remanufacturing for automobile. Stack & individual cells voltage, temperature, current, air flow, vibration data captured in battery cage, time of cycle
run. Hydrogen tank temperature, tank pressure, inlet pressure, hydrogen usage quantity, blower current
It can be seen in Table 3 that there is no uniformity in terms of the variables needed to
remanufacture fuel cells and. This comes as no surprise perhaps, as remanufacturing has been affirmed in literature to have no singular definition [12] due to, amongst others, complexities arising from manufacturer’s internal process challenges and challenges outside the manufacturer’s borders, Hammond et al., (1996) [78] & Lundmark, et al., (2009) [79]. (‘Manufacturers’, are OEM and the third party remanufacturers). Secondly, variables that affect fuel cell remanufacturing can be categorised into three; (i) variables from FC stack (ii) variables required for traditional
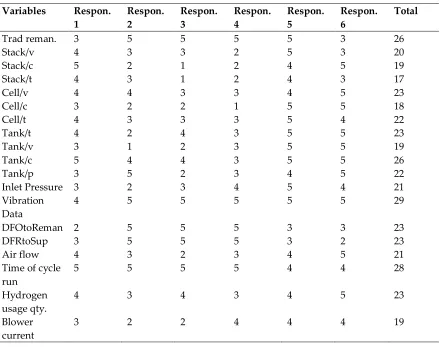
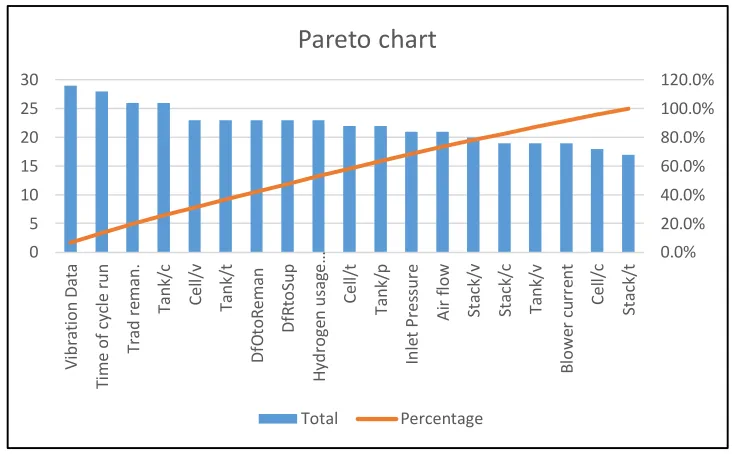
remanufacturing FCs. The Pareto principle [80] states that in any population that contributes to a common effect, a few account for the bulk of the effect. Microsoft Excel is used to plot this chart. First, respondents are asked to rank the variables using the numbers “1” to “5”. One “1” signifies least important and five “5” signifies most important. Their responses are then totalled and their respective cumulative frequency and percentages are computed accordingly. The Pareto chart is then plotted as given in Figure 5.
Table 3: Ranking of Parameters for Pareto Chart
Variables Respon. 1 Respon. 2 Respon. 3 Respon. 4 Respon. 5 Respon. 6 Total
Trad reman. 3 5 5 5 5 3 26
Stack/v Stack/c Stack/t 4 5 4 3 2 3 3 1 1 2 2 2 5 4 4 3 5 3 20 19 17
Cell/v 4 4 3 3 4 5 23
Cell/c 3 2 2 1 5 5 18
Cell/t Tank/t Tank/v Tank/c Tank/p Inlet Pressure 4 4 3 5 3 3 3 2 1 4 5 2 3 4 2 4 2 3 3 3 3 3 3 4 5 5 5 5 4 5 4 5 5 5 5 4 22 23 19 26 22 21 Vibration Data DFOtoReman DFRtoSup 4 2 3 5 5 5 5 5 5 5 5 5 5 3 3 5 3 2 29 23 23
Air flow 4 3 2 3 4 5 21
Time of cycle run Hydrogen usage qty. Blower current 5 4 3 5 3 2 5 4 2 5 3 4 4 4 4 4 5 4 28 23 19
Question 2: What are the most important variables required for fuel cell remanufacture?
Respondents agreed that it was important to rank the identified variables. In total, 19 different variables were computed as shown in Table 3. The nine (9) parameters for remanufacturing as presented in Table 1 are grouped as “Trad reman” or traditional remanufacturing variables. This implies that variables required for an efficient remanufacturing of sensor-enabled would be 18 + 9 or 27 variables. Respondents agreed that, in lieu of time, cost and resources, this was not efficient. Hence it was agreed that the variables needed to be ranked. From Table 3 it can be observed that there are no large deviations between the highest ranked and the lowest variable; the range of values is just “5”. Thus, it could be argued that while efficiency demands that variables are ranked, all variables are significant for sensor-enabled remanufacturing. From Figure 5 the most important variables within the top 80% were compiled and described.
Vibration Data: The data collected from the sensor placed on the BMS, which collects information on the physical state of the fuel cell.
Traditional Remanufacturing: As described in Table 1, this is the parameters of variables currently employed in remanufacturing for non-sensor enabled parts, for example vehicle gearboxes.
Tank Current, Tank/c: The current values of the hydrogen tank in Amps, A.
Cell voltage, Cell/v: The voltage of the individual fuel cells, V.
Tank temperature, Tank/t: The temperature captured for the hydrogen tank, in degree centigrade, oC
Distance from OEM to 3rd party remanufacturer, DFOtoReman: The distance in kilometres, km, from the OEM to the 3rd party remanufacturer’s site.
Figure 5: Pareto chart of remanufacturing variables showing “80/20” distribution
Distance from 3rd party remanufacturer to suppliers, DfRtoSup: The distance in kilometres, km, from the 3rd party remanufacturer to suppliers. It is assumed that there are more than one supplier.
Hydrogen usage quantity. The quantity of hydrogen used in the fuel cell during operation. This is calculated in grams, g.
Cell temperature: The temperature of the fuel cell, in degree centigrade, oC.
Tank pressure, Tank/p: The pressure in Pa, of the hydrogen tank.
Inlet pressure: The pressure in Pa, at the inlet of the hydrogen tank.
Air flow: The air flow of the entire system measured in cubic feet per minute (CFM)
Stack voltage: The voltage of the stack of fuel cells. It is measured in volts, V. Question 3: Do you agree with all the variables selected as important variables required for fuel cell remanufacture?
This question was asked in order to help the authors obtain the remanufacturing experts views on the usefulness of the selected parameters and its applicability to other sensor-enabled automotive parts as it pertains to remanufacturing. There was a unanimous agreement that any selected variable designated as “important” was useful in enabling remanufacturing for any sensor-enabled automotive component and not just fuel cells. However, there was no unanimity in accepting that all the variables were useful for efficient remanufacturing. Respondents were of the opinion that collecting and analysing data from all the thirteen parameters will be time-consuming, costly and hence, inefficient. While respondents were not unanimous on the few variables which will ensure efficiency in remanufacturing, respondents agreed that traditional remanufacturing parameters (as
itemised in Table 1) and vibration data which constitutes information on the physical state of the fuel cell, could be considered as base parameters. Respondents agreed that any further work on the parameters can be examined in terms of data and not processes. There was also an agreement that analysis could divided as “data from sensors” and “data from other sources”.
4.2 Dynamic Implications of data for remanufacturing
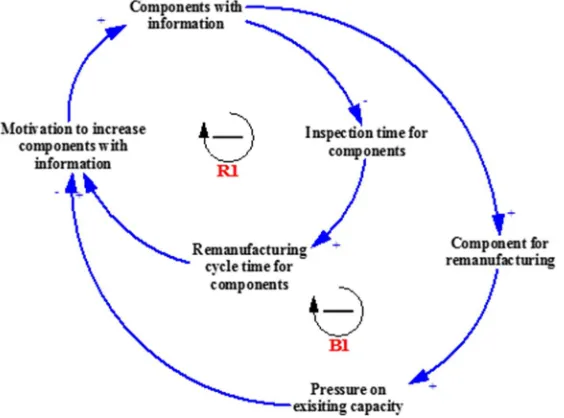
In order to map out the structure of a complex system, a Causal Loop Diagram (CLD) is used as shown in Figure 6. In a complex system, [46], the cause effect connections often form loops which indicate information feedback between parameters. The structure and behaviour of this system is determined by the nature of these feedback loops. The CLD is then expressed as a mathematical model after the different interactions and feedback among different variables of the elements are considered. This is then converted to computer simulations or the stock and flow diagram, SFD [81]. Negative (-) and positive (+) polarities are assigned to the causal link on the CLD. These polarities represent the relationships between respective connected parameters. Adane & Nicolescu, (2018), [46] state that these polarities also indicate how a dependent parameter changes when an independent parameter changes. The notation B and R signify negative (or balancing) loop and positive (or reinforcing) loop respectively (these are feedback loops).
To develop the causal loop diagram and the stock and flow diagram, we shall consider these assumptions.
That the remanufacturing variables shall be analysed based on their process data and not their processes.
That, for simplicity sake, these data shall be analysed as “data from sensors” (for example vibration data and stack voltage, etc) and “data from other sources” (for example, data from traditional remanufacturing parameters)
Information about a component is needed before it can be remanufactured. Components with information do not require inspection, as their status is already known from the data about the
Figure 6. CLD indicating the dynamic implications of component data on the remanufacturing system for the
component
component. Components without information need to be inspected physically before it can be determined whether to remanufacture it or not.
reduces. When cycle time reduces, management is motivated to further increase the components with information, seeing it as a benefit to be reinforced, R1. When components with information increases, the number of components for remanufacturing also increases. This puts pressure on existing capacity encouraging management to reduce the components with information so as not to overload the system, B1. Both feedback loops are in conflict. The CLD representing the two key feedback loops is shown in Figure 6.
We proceed to draw the stock and flow diagram (SFD) based on the causal loop diagram. Figure 7 expands the CLD into a SFD. The stock and flow diagram is used to increase the
understanding of the feedback and control process of a given system, [81]. The intended simulation model can be used to test various policies regarding whether the company should increase data about the components to remanufacture, on the assumption that the increased availability of information about the component means that it is more likely the component can be sent for remanufacturing and vice versa. The less that is known about the component the less likely it will be sent in for remanufacturing.
Figure 7. SFD indicating the dynamic implications of component data on the remanufacturing system for the component.
4.3 Coding the Simulation Model.
The below data are all hypothetical estimates, to enable the presentation of simulation results that mirror what may occur in real life. This hypothetical data was agreed with respondents, however, using more realistic data (real estimates from one of the companies) would be ideal.
Rate of entry of components to be remanufactured = Random, between 1 and 3 hours.
Percentage of components with information = 5% (we take a pessimistic baseline situation, as if majority of components have no information)
Percentage of components without information. (it is assumed that some components without information are also entered into the system; those that are physically inspected) = 95%.
Inspection time per component (for those components with information) = We use triangular distribution (3,5,7) minutes. While a component may have data about it, it is important to still carry out some physical examination to confirm that it is fit for remanufacturing. This is akin to a verification inspection. We estimate a triangular distribution with min = 3 minutes, max = 7 minutes and mode = 5 minutes.
Inspection time per component (for those components without information) = Triangular distribution (30, 60, 45) minutes is used. We estimate a triangular distribution with min =30 minutes; max = 60 minutes and mode = 45 minutes.
Remanufacturing capacity = we assume 1 set of machines.
Percentage of components (i.e those without information) that are not remanufactured after inspection (since it is possible that some components will be found not to be
“remanufacturable” after inspecting them physically) = 70%. Hence, components that are remanufactured after they are physically inspected constitute 30% of the total.
5. Results and Conclusions.
Running the simulation model is intended to reveal how the system will behave when components with information is increased. The ideal situation is for 100% of components to have information. Hence, there are two options worth considering:
Continue with the current capacity, but allow the components with information to vary such that capacity is not stretched. In such a situation, when capacity utilization is approaching a high level (say, 80%), the components with information are reduced so as not to overburden the system. When there is a slack, more components with information can be entered into the system.
Ensure all components have information and determine (through simulation) the capacity that is needed to ensure that capacity is not overstretched or underutilised.
The simulation results are compared with those of the current status in Table 4.
Table 4: Comparison of simulation results with current remanufacturing capacity status
Current Status Components with information are allowed to vary
All components have information and capacity is doubled Average
remanufacturing cycle time (minutes)
306 350 225
Number of remanufactured components
1,474 2,096 4,385
Average capacity utilisation
56% 80% 81%
From the table above, the current capacity utilization is low because there are not enough
components entering the system (because there are not enough components with information). The system can be slightly improved by allowing the components with information to vary according to current capacity available. For an ideal situation the capacity should be increased.
Manufacturing companies are implementing various strategies in order to enable the transition to a more circular economy as well as enhance the performance and efficiency of the manufacturing systems. Among various circular strategies employed, remanufacturing, which restores used products to a like-new state, offers great opportunities to recover products and their parts while adding great benefits to the economy of the localities and countries where remanufacturing activities are carried out. In addition, remanufacturing requires less effort and resources for recovery as well retaining part of the raw materials and added value. This has made
remanufacturing particularly profitable and viable for automotive-inclined companies as evidenced in research. With the entry and growing influence of electric and hybrid cars which are fuel cell and/or battery operated, it becomes increasingly important to understand remanufacturing of the components of the electric cars within the context of Industry 4.0. This research was based on the hypothesis that data collected via sensors on the fuel cell can contribute towards their
remanufacturing. The objectives of this research were hence set to identify and rank the
and remanufacturing using a simple CLD and SFD. Six respondents were selected from identified three remanufacturing/ remanufacturing research companies as case studies.
It was found that variables required in the remanufacturing of the fuel cells are inextricably linked to the kind of data producing them. For purposes of remanufacturing, it is important to sub-categorise this data in two forms, namely; data from sensors and data from other sources. Within data from sensors, it was found out that the vibration data which gives information about the physical state of the product was viewed as most important by the respondents within the context of remanufacturing. While the data from sensors are important, overall for remanufacturing, the fuel cell is more dependent on data from other sources, named, “traditional variables”. For
manufacturers this finding is important as it would mean that there is need for greater collaboration between remanufacturers of diesel engine vehicles and electric/ hybrid vehicles. Within the wider economic and environmental context, this provides evidence that data is important in enabling a circular economy.
Modelling results show that when components with information (data) increase, the inspection time for components reduces and the remanufacturing cycle time also reduces. When the number of components with information increases, the number of components for remanufacturing also goes up. This puts pressure on existing capacity encouraging management to reduce the components with information so as not to overload the system Furthermore, from the simulation it is seen that the system will not be able to cope if the components with information are increased without a corresponding rise in manufacturing. This is important for manufacturers in order to ensure sustained efficiency in the system.
Finally, it was observed that the values (built around the data) are more discrete occurring than dynamic. A part comes in for remanufacturing, the data is utilised and analysed, a decision is taken to remanufacture or not and the process is completed. As a further work, it is recommended that other modelling and simulation techniques such as discrete event simulation are deployed in the investigation of the relationship between data from sensors and remanufacturing. This may uncover other values important to the remanufacturer. This modelling and simulation of this research was completed with hypothetical data which was approved by the team of experts constituting the respondents for this study.
For further research, it is recommended that actual figures from a real case study be utilised as a validation procedure. Within established cycle time, the BMS produce data for each of the identified parameters in Table 3. It is recommended that real-time figures be extracted for the FC and other sensor enabled battery components such as the rechargeable energy storage system as a means for validation. This could further inform useful relationships between data and remanufacturing.
Acknowledgements: This research work is partially funded by the EPSRC through the Feasibility Study Research Project on ‘Circular 4.0: Digital Intelligence to Enable a Circular Economy’, EP/P001246, 2017-18. The authors are grateful to the various respondents who contributed their views in this research.
Author Contributions: O.O contributed in developing the concept and structure of the paper, defined the objectives of the paper, carried out the interviews, developed the models used and made a draft of the paper. F.C supervised the research, advised concerning the CE aspect of the research and revised the manuscript. C.T reviewed the manuscript and advised concerning choice of simulation tool. K.S supervised the research, advised on the simulation aspects of the research, substantively revising the manuscript and gave the approval for the final version to be published. The authors are grateful to Oleghe Omogbai who gave useful insights into the modelling and simulation employed in this paper.
Nomenclature
CLD Causal Loop Diagram
CBM Condition-Based Monitoring
CE Circular Economy
DFOtoReman Distance from OEM to 3rd Party Remanufacturer DfRtoSup Distance from 3rd Party Remanufacturer to Supplier
FC Fuel Cell
FCEVs Fuel Cell for Electric Vehicles
OEM Original Equipment Manufacturer
I4.0 Industry 4.0
SFD Stock and Flow Diagram
V Voltage
Min Minimum
Max Maximum
Reman Remanufacturing
References
1. Stahel WR. The circular economy. 2016; 10(1). Available at: DOI:10.1038/531435a
2. Potting J., Hekkert M., Worrell E., Hanemaaijer A. CIRCULAR ECONOMY : MEASURING
INNOVATION IN THE Policy Report. 2017; (January).
3. Kirchherr J., Reike D., Hekkert M. Conceptualizing the Circular Economy: An Analysis of 114 Definitions. Resources, Conservation and Recycling. 2017; 127(September): 221–232. Available
at: DOI:10.1016/j.resconrec.2017.09.005
4. K. Winans⁎, A. Kendall HDD. The history and current applications of the circular economy
concept. Renewable and Sustainable Energy Reviews. 2017; 68(C): 825–833. Available at: DOI:10.1016/j.rser.2011.05.019
5. Reike D., Vermeulen WJV., Witjes S. The circular economy: New or Refurbished as CE 3.0? - Exploring Controversies in the Conceptualization of the Circular Economy through a Focus on History and Resource Value Retention Options. Resources, Conservation and Recycling.
Elsevier; 2017; 135(February 2017): 246–264. Available at: DOI:10.1016/j.resconrec.2017.08.027 6. Hatcher GD., Ijomah WL., Windmill JFC. Design for remanufacture: A literature review and
future research needs. Journal of Cleaner Production. Elsevier Ltd; 2011; 19(17–18): 2004–2014. Available at: DOI:10.1016/j.jclepro.2011.06.019
7. Lund RT and BM. Remanufacturing: The experience of the United States and implications for
developing countries. 1984; (31): 126. Available at:
http://documents.worldbank.org/curated/en/792491468142480141/Remanufacturing-the-experience-of-the-United-States-and-implications-for-developing-countries
8. All-Party Parliamentary Sustainable Resource Group. Remanufacturing: Towards a resource
efficient economy. 2014; : 1–12. Available at:
http://www.policyconnect.org.uk/apsrg/sites/site_apsrg/files/apsrg_-_remanufacturing_report.pdf
10. Hauser W., Lund R. The Remanufacturing Industry: Anatomy of a Giant, Report. Boston;
2008. Available at: http://www.bu.edu/reman/OrderAnatomy.htm
11. Ijomah WL., McMahon CA., Hammond GP., Newman ST. Development of design for
remanufacturing guidelines to support sustainable manufacturing. Robotics and Computer-Integrated Manufacturing. 2007; 23(6): 712–719. Available at: DOI:10.1016/j.rcim.2007.02.017
12. Abdulrahman MDA., Subramanian N., Liu C., Shu C. Viability of remanufacturing practice: A strategic decision making framework for Chinese auto-parts companies. Journal of Cleaner
Production. Elsevier Ltd; 2015; 105: 311–323. Available at: DOI:10.1016/j.jclepro.2014.02.065 13. Ijomah WL. Addressing decision making for remanufacturing operations and
design-for-remanufacture. International Journal of Sustainable Engineering. 2009; 2(2): 91–102. Available
at: DOI:10.1080/19397030902953080
14. Standard AN. Specifications for the Process of Remanufacturing. Specifications for the Process
of Remanufacturing. 2016.
15. Giuntini R., Gaudette K. Remanufacturing: The next great opportunity for boosting US
productivity. Business Horizons. 2003; 46(6): 41–48. Available at: DOI:10.1016/S0007-6813(03)00087-9
16. Lu Y. Industry 4.0: A survey on technologies, applications and open research issues. Journal of Industrial Information Integration. Elsevier Inc.; 2017; 6: 1–10. Available at:
DOI:10.1016/j.jii.2017.04.005
17. Subramoniam R., Huisingh D., Chinnam RB., Subramoniam S. Remanufacturing Decision-Making Framework (RDMF): Research validation using the analytical hierarchical process.
Journal of Cleaner Production. 2013; 40: 212–220. Available at: DOI:10.1016/j.jclepro.2011.09.004
18. Okorie O., Turner C., Salonitis K., Charnley F., Moreno M., Tiwari A. A Decision-Making Framework for the Implementation of Remanufacturing in Rechargeable Energy Storage
System in Hybrid Vehicles. 8th Swedish Production Symposium, SPS 2018, Stockholm,
Sweden. 2018. pp. 16–18. Available at:
https://www.sciencedirect.com/science/article/pii/S2351978918305870?via%3Dihub%0A%0A
19. Ismail HN., Zwolinski P., Mandil G., Brissaud D. Decision Making System for Designing Products and Production Systems for Remanufacturing Activities. Procedia CIRP. 2017; 61:
212–217. Available at: DOI:10.1016/j.procir.2016.11.231
20. Inderfurth K., Van Der Laan E. Leadtime effects and policy improvement for stochastic
inventory control with remanufacturing. International Journal of Production Economics. 2001; 71(1–3): 381–390. Available at: DOI:10.1016/S0925-5273(00)00135-3
21. Kiesmüller GP. A new approach for controlling a hybrid stochastic
manufacturing/remanufacturing system with inventories and different leadtimes. European Journal of Operational Research. 2003; 147(1): 62–71. Available at:
DOI:10.1016/S0377-2217(02)00351-X
22. Kiesmüller GP., Minner S. Simple expressions for finding recovery system inventory control
parameter values. Journal of the Operational Research Society. 2003; 54(1): 83–88. Available at: DOI:10.1057/palgrave.jors.2601480
23. Van Der Laan E., Salomon M., Dekker R. Investigation of lead-time effects in manufacturing/remanufacturing systems under simple PUSH and PULL control strategies.
DOI:10.1016/S0377-2217(98)00108-8
24. Hatcher GD., Ijomah WL., Windmill JFC. Integrating design for remanufacture into the design process: The operational factors. Journal of Cleaner Production. Elsevier Ltd; 2013; 39: 200–
208. Available at: DOI:10.1016/j.jclepro.2012.08.015
25. Yuksel H. Design of automobile engines for remanufacture with quality function deployment.
International Journal of Sustainable Engineering. 2010; 3(3): 170–180. Available at: DOI:10.1080/19397038.2010.486046
26. Erwin van der Laan, Kiesmüller GP. An inventory model with dependent product demands and returns. International Journal of Production Economics. 2001; 72(1): 73–87. Available at: https://www.researchgate.net/publication/4916733_An_inventory_model_with_dependent_
product_demands_and_returns
27. Zhou J., Wang Y., He HQ. An optimal ordering and recovery policy for direct reusable
deterioration items. 2009 International Conference on Management Science and Engineering - 16th Annual Conference Proceedings, ICMSE 2009. 2009; 43: 575–580. Available at:
DOI:10.1109/ICMSE.2009.5317350
28. Teunter RH. Economic ordering quantities for recoverable item inventory systems. Naval
Research Logistics. 2001; 48(6): 484–495. Available at: DOI:10.1002/nav.1030
29. Van Der Laan E., Dekker R., Salomon M. Product remanufacturing and disposal: A numerical
comparison of alternative control strategies. International Journal of Production Economics. 1996; 45(1–3): 489–498. Available at: DOI:10.1016/0925-5273(95)00137-9
30. Van Der Laan E., Dekker R., Salomona M., Ridder A. An (s, Q) inventory model with
remanufacturing and disposal. International Journal of Production Economics. 1996; 46–47: 339–350. Available at: DOI:10.1016/0925-5273(95)00020-8
31. Georgiadis P., Vlachos D., Tagaras G. The Impact of Product Lifecycle on Capacity Planning of Closed-Loop Supply Chains with Remanufacturing. Production and Operations
Management. 2009; 15(4): 514–527. Available at: DOI:10.1111/j.1937-5956.2006.tb00160.x 32. Kelber R. Dynamic Inventory Management in Reverse Logistics. Springer, Berlin Heidelberg;
2006. Available at: https://www.springer.com/gp/book/9783540332299
33. Vlachos D., Georgiadis P., Iakovou E. A system dynamics model for dynamic capacity planning of remanufacturing in closed-loop supply chains. Computers and Operations
Research. 2007; 34(2): 367–394. Available at: DOI:10.1016/j.cor.2005.03.005
34. Bras B., Hammond R. Towards Design for Remanufacturing – Metrics for Assessing
Remanufacturability. Proceedings of the 1st International Workshop on Reuse. 1996. pp. 5–22. 35. Tolio T., Bernard A., Colledani M., Kara S., Seliger G., Duflou J., et al. Design, management
and control of demanufacturing and remanufacturing systems. CIRP Annals - Manufacturing
Technology. 2017; 66(2): 585–609. Available at: DOI:10.1016/j.cirp.2017.05.001
36. Gray C., Charter M. Remanufacturing and Product Design, Designing for the 7th Generation.
Farnham, UK: The Centre for Sustainable Design. University College for the Creative Arts. Gungor; 2007.
37. Hauser, W. LRT. Remanufacturing. An American Resource. 2003. Available at: www.bu.edu/reman/RemanSlides (Accessed: 30 May 2012)
38. Saavedra YMB., Barquet APB., Rozenfeld H., Forcellini FA., Ometto AR. Remanufacturing in Brazil: Case studies on the automotive sector. Journal of Cleaner Production. Elsevier Ltd;
39. ERN. Remanufacturing Market Study. 2015. Available at: www.remanufacturing.eu
40. Butzer S., Schötz S., Steinhilper R. Remanufacturing Process Assessment - A Holistic Approach. Procedia CIRP. The Author(s); 2016; 52: 234–238. Available at:
DOI:10.1016/j.procir.2016.07.066
41. Kurilova-Palisaitiene J., Sundin E., Poksinska B. Remanufacturing challenges and possible
lean improvements. Journal of Cleaner Production. Elsevier Ltd; 2018; 172: 3225–3236. Available at: DOI:10.1016/j.jclepro.2017.11.023
42. Poles R. System Dynamics modelling of a production and inventory system for remanufacturing to evaluate system improvement strategies. International Journal of Production Economics. Elsevier; 2013; 144(1): 189–199. Available at:
DOI:10.1016/j.ijpe.2013.02.003
43. Ghisolfi V., Diniz Chaves G de L., Ribeiro Siman R., Xavier LH. System dynamics applied to
closed loop supply chains of desktops and laptops in Brazil: A perspective for social inclusion of waste pickers. Waste Management. 2017; 60: 14–31. Available at:
DOI:10.1016/j.wasman.2016.12.018
44. Sterman JD. Systems Thinking and Modeling for a Complex World. Management. 2000. 7-17
p. Available at: DOI:10.1108/13673270210417646
45. Stadnicka D., Litwin P. Value Stream and System Dynamics Analysis - An Automotive Case
Study. Procedia CIRP. 2017; 62: 363–368. Available at: DOI:10.1016/j.procir.2016.06.038 46. Adane T., Nicolescu M. Towards a Generic Framework for the Performance Evaluation of
Manufacturing Strategy: An Innovative Approach. Journal of Manufacturing and Materials
Processing. 2018; 2(2): 23. Available at: DOI:10.3390/jmmp2020023
47. Nabavi E., Daniell KA., Najafi H. Boundary matters: the potential of system dynamics to
support sustainability? Journal of Cleaner Production. 2017; 140: 312–323. Available at: DOI:10.1016/j.jclepro.2016.03.032
48. Naim MM., Towill DR. Establishing a framework for effective materials logistics management. International journal of logistics management. 1994; 5: 189–197.
49. Georgiadis P., Vlachos D. The effect of environmental parameters on product recovery.
European Journal of Operational Research. 2004; 157(2): 449–464. Available at: DOI:10.1016/S0377-2217(03)00203-0
50. Wang Y., Chang X., Chen Z., Zhong Y., Fan T. Impact of subsidy policies on recycling and remanufacturing using system dynamics methodology: A case of auto parts in China. Journal
of Cleaner Production. Elsevier Ltd; 2014; 74: 161–171. Available at: DOI:10.1016/j.jclepro.2014.03.023
51. Morecroft J. Strategic Modelling and Business Dynamics: A Feedback Systems Approach.
Cornwall, UK: John Wiley & Sons; 2015.
52. Oyarbide, A., Baines, T.S, Kay, J.M., Ladbrook J. Manufacturing Systems Modelling Using
System Dynamics: Forming a Dedicated Modelling Tool. Journal of Advanced Manufacturing Systems. 2003; 2(1): 71–87.
53. Okorie O., Salonitis K., Charnley F., Moreno M., Turner C., Tiwari A. Manufacturing Data for the Implementation of Data- Driven Remanufacturing for the Rechargeable Energy Storage
System in Electric Vehicles . Smart Sustainable Technologies, Gold Coast Australia, 2018. 2018. 54. Yang, S.S., Ong, S.K., Nee A.Y.C. Product Design for Remanufacturing. Handbook of
55. Nasr N. TM. Remanufacturing: a key enabler to sustainable product systems. Proceedings of
the 13th CIRP international conference on life cycle engineering, Brussels, Belgium. 2006. pp. 15–18.
56. Marzouk OY., Dheilly RM., Queneudec M. Eco-Efficiency , Asset Recovery and Remanufacturing. Waste Management. 2007; 27(2): 310–318.
57. Flowers WC. Reliability Modeling in Design for Remanufacture. 2016; 120(May 1996). 58. Fang H.C., Ong S., Nee AY. Use of Embedded Smart Sensors in Products to Facilitate
Remanufacturing. In: Nee AY. (ed.) Handbook of Manufacturing and Engineering Technology. Springer-Verlag; 2014. pp. 3265–3290. Available at: https://link.springer.com/referenceworkentry/10.1007%2F978-1-4471-4670-4_85
59. Aras N., Boyaci T., Verter V. The effect of categorizing returned products in remanufacturing. IIE Transactions (Institute of Industrial Engineers). 2004; 36(4): 319–331. Available at:
DOI:10.1080/07408170490279561
60. Liang Y., Pokharel S., Lim GH. Pricing used products for remanufacturing. European Journal
of Operational Research. Elsevier B.V.; 2009; 193(2): 390–395. Available at: DOI:10.1016/j.ejor.2007.11.029
61. Freiberger S. Design for recycling and remanufacturing of fuel cells. Proceedings - Fourth International Symposium on Environmentally Conscious Design and Inverse Manufacturing,
Eco Design 2005. 2005; 2005: 466–471. Available at: DOI:10.1109/ECODIM.2005.1619268 62. Alaswad A., Baroutaji A., Achour H., Carton J., Al Makky A., Olabi AG. Developments in fuel
cell technologies in the transport sector. International Journal of Hydrogen Energy. 2015;
41(37): 16499–16508. Available at: DOI:10.1016/j.ijhydene.2016.03.164
63. Sharaf OZ., Orhan MF. An overview of fuel cell technology : Fundamentals and applications.
2014; 32: 810–853.
64. Drabik, Eleanor Rizos V. Prospects for electric vehicle batteries in a circular economy. 2018.
65. Bing LI., Hui LI., Jianxin M a., Haijiang W. PEM Fuel Cells : Current Status and Challenges for Electrical Vehicle Applications. 2010; 1(4).
66. Dhanushkodi SR., Mahinpey N., Srinivasan A., Wilson M. Life cycle analysis of fuel cell
technology. Journal of Environmental Informatics. 2008; 11(1): 36–44. Available at: DOI:10.3808/jei.200800109
67. HSSMI. Fuel Cell Recovery (FCR) Project. Available at:
http://www.remanufacturing.eu/studies/85009278b407ff443e07.pdf (Accessed: 24 July 2018)
68. Zre VDI. Resource efficiency through remanufacturing. 2017; (November).
69. Steinhilper R., Slawik S., Pentzlin F., Boehner J. Increasing energy efficiency by remanufacturing and reengineering. 2011; 60: 540–545.
70. Dobos I., Floriska A. The efficiency of remanufacturing in a dynamic input-output model. Central European Journal of Operations Research. 2008; 16(3): 317–328. Available at:
DOI:10.1007/s10100-008-0060-4
71. Zhang Y., Liu S., Liu Y., Yang H., Li M., Huisingh D., et al. The ‘Internet of Things’ enabled
real-time scheduling for remanufacturing of automobile engines. Journal of Cleaner Production. Elsevier Ltd; 2018; 185: 562–575. Available at: DOI:10.1016/j.jclepro.2018.02.061
72. Baker KR., Scudder, G.D. Sequencing with earliness and tardiness penalties: a review. Operations Management Research. 1990; 38: 22–38.
optimization and decision making support*. Robotics and Computer-Integrated
Manufacturing. 2011; 27(4): 696–705. Available at: DOI:10.1016/j.rcim.2010.12.006
74. Chen L., Roberts C., Schmid F., Stewart E. Modeling and solving real-time train rescheduling
problems in railway bottleneck sections. IEEE Transactions on Intelligent Transportation Systems. 2015; 16(4): 1896–1904. Available at: DOI:10.1109/TITS.2014.2379617
75. Robson C. Real World Research: A Resource for Social Scientists and Practitioner-Researchers. 2nd edn. Blackwell Publishing; 2002.
76. King N. The Qualitative Research Interview. In: Cassel C, Symon G (eds.) In Qualitative methods in organizational research: A practical guide. Sage Publications, London; 1994. p. 253.
77. Dyer WG., Wilkins AL. Better Stories, Not Better Constructs, To Generate Better Theory: a Rejoinder To Eisenhardt. Academy of Management Review. 1991; 16(3): 613–619. Available
at: DOI:10.5465/AMR.1991.4279492
78. Hammond, R., Amezquita, T., Bras B. Issues in the Automotive Parts Remanufacturing
Industry - A Discussion of Results from Surveys Performed among Remanufacturers. 1996. 79. Lundmark, P., Sundin, E., Bj€orkman M. Industrial challenges within the remanufacturing
system. Proceedings of Swedish Production Symposium. G€oteborg, Sweden; 2009. pp. 132– 138.
80. Kramp KH., Det MJ Van., Veeger NJGM., Pierie JEN. The Pareto Analysis for Establishing Content Criteria in Surgical Training. 2016;
81. Asif FMA., Rashid A., Bianchi C., Nicolescu CM. Resources , Conservation and Recycling
![Figure 1: A generic manufacturing process chart. Adapted from Ijomah et al [11]](https://thumb-us.123doks.com/thumbv2/123dok_us/7967597.1321417/2.595.104.520.398.628/figure-generic-manufacturing-process-chart-adapted-ijomah-et.webp)
![Figure 2: An Example of Core and Remanufactured Product. Source: Tolio et al [35]](https://thumb-us.123doks.com/thumbv2/123dok_us/7967597.1321417/3.595.97.503.329.486/figure-example-core-remanufactured-product-source-tolio-et.webp)
![Figure 3: Typical PEM fuel cell operational processes (Source: Helsinki University of Technology [64])](https://thumb-us.123doks.com/thumbv2/123dok_us/7967597.1321417/6.595.184.433.489.703/figure-typical-operational-processes-source-helsinki-university-technology.webp)
![Figure 4: Removable Fuel Cell Stack (Source: Sharaf & Orhan, (2014, [63])](https://thumb-us.123doks.com/thumbv2/123dok_us/7967597.1321417/7.595.116.483.218.386/figure-removable-fuel-cell-stack-source-sharaf-orhan.webp)