Clinical Epidemiology 2018:10 671–681
Clinical Epidemiology
Dove
press
submit your manuscript | www.dovepress.com 671
O R I G I N A L R E S E A R C H open access to scientific and medical research
Open Access Full Text Article
Development and validation of novel algorithms
to identify patients with inflammatory bowel
diseases in Israel: an epi-IIRN group study
Mira Y Friedman,1,2 Maya
Leventer-Roberts,3 Joseph Rosenblum,4 Nir
Zigman,4 Iris Goren,4 Vered Mourad,4 Natan Lederman,5 Nurit Cohen,5 Eran Matz,6 Doron Z Dushnitzky,6 Nirit Borovsky,6 Moshe B Hoshen,3 Gili Focht,1 Malka Avitzour,1 Yael Shachar,1 Yehuda Chowers,7 Rami Eliakim,8 Shomron Ben-Horin,8 Shmuel Odes,9 Doron Schwartz,9 Iris Dotan,10 Eran Israeli,11 Zohar Levi,10 Eric I Benchimol,12–14 Ran D Balicer,3 Dan Turner1
On behalf of the Israeli IBD
Research Nucleus (IIRN)
1The Juliet Keidan Institute of Pediatric
Gastroenterology and Nutrition, Shaare Zedek
Medical Center, The Hebrew University of
Jerusalem, Jerusalem, Israel; 2Braun School of
Public and Community Medicine, The Hebrew University – Hadassah Medical Center, Jerusalem,
Israel; 3Clalit Research Institute, Chief’s Office, Clalit Health Services, Tel Aviv, Israel; 4Maccabi Healthcare Services, Tel Aviv, Israel; 5Meuhedet Health Services, Tel Aviv, Israel; 6Leumit Health Services, Tel Aviv, Israel; 7Department of Gastroenterology, Rambam Health Care Campus, Bruce Rappaport School of Medicine, Technion Israel Institute of Technology, Haifa, Israel; 8Department of Gastroenterology,
Chaim Sheba Medical Center, Sackler School of Medicine, Tel Aviv University, Tel Aviv, Israel;
9Department of Gastroenterology and Hepatology,
Soroka Medical Center, Ben-Gurion University
of the Negev, Beer Sheva, Israel; 10Division of
Gastroenterology, Rabin Medical Center, Petah
Tikva, Israel; 11Institute of Gastroenterology and
Liver Diseases, Hadassah Medical Center, Hebrew University, Jerusalem, Israel; 12CHEO Inflammatory Bowel Disease Centre, Children’s Hospital of Eastern Ontario, Ottawa, ON, Canada; 13Department
of Pediatrics and School of Epidemiology, Public Health and Preventive Medicine, University of
Ottawa, Ottawa, ON, Canada; 14Institute for Clinical Evaluative Sciences, Ottawa, ON, Canada
Background: Before embarking on administrative research, validated case ascertainment algorithms must be developed. We aimed at developing algorithms for identifying inflammatory bowel disease (IBD) patients, date of disease onset, and IBD type (Crohn’s disease [CD] vs ulcerative colitis [UC]) in the databases of the four Israeli Health Maintenance Organizations (HMOs) covering 98% of the population.
Methods: Algorithms were developed on 5,131 IBD patients and 2,072 controls, following independent chart review (60% CD and 39% UC). We reviewed 942 different combinations of clinical parameters aided by mathematical modeling. The algorithms were validated on an independent cohort of 160,000 random subjects.
Results: The combination of the following variables achieved the highest diagnostic accuracy: related codes, alone if more than five to six codes or combined with purchases of IBD-related medications (at least three purchases or ≥3 months from the first to last purchase) (sen-sitivity 89%, specificity 99%, positive predictive value [PPV] 92%, negative predictive value [NPV] 99%). A look-back period of 2–5 years (depending on the HMO) without IBD-related codes or medications best determined the date of diagnosis (sensitivity 83%, specificity 68%, PPV 82%, NPV 70%). IBD type was determined by the majority of CD/UC codes of the three recent contacts or the most recent when less than three contacts were recorded (sensitivity 92%, specificity 97%, PPV 97%, NPV 92%). Applying these algorithms, a total of 38,291 IBD patients were residing in Israel, corresponding to a prevalence rate of 459/100,000 (0.46%).
Conclusion: The application of the validated algorithms to Israel’s administrative databases will now create a large and accurate ongoing population-based cohort of IBD patients for future administrative studies.
Keywords: inflammatory bowel diseases, Crohn’s disease, ulcerative colitis, search algorithms, validation, case ascertainment, Israel, administrative database research
Introduction
Population-based cohorts of inflammatory bowel disease (IBD) hold a large potential to facilitate our understanding of this disease by exploring its different aspects such as epidemiology, the effectiveness of treatments, and predictors of disease outcomes. Israel may be an ideal place to study IBD on a population level using administrative databases. It has a universal health care system in which each resident has a unique identifying code from birth, and all are required by law to be insured by one of four Israeli Health Maintenance Organizations (HMOs), namely, Clalit Health Services, Maccabi Healthcare Services, Meuhedet Health Services, and Leumit Health Services, covering 52%, 25%, 14%, and 9% of the population, respectively.1 The Israeli health care system is composed of hospitals and ambulatory care centers; the latter facility is
Correspondence: Dan Turner The Juliet Keidan Institute of Pediatric
Gastroenterology and Nutrition, Shaare Zedek Medical
Center, The Hebrew University of Jerusalem, PO 3235,
Jerusalem 91031, Israel Tel +972 2 666 6482 Fax +972 2 655 5756 Email [email protected]
Journal name: Clinical Epidemiology Article Designation: ORIGINAL RESEARCH Year: 2018
Volume: 10
Running head verso: Friedman et al
Running head recto: Novel algorithms to identify IBD patients in Israel DOI: http://dx.doi.org/10.2147/CLEP.S151339
Clinical Epidemiology downloaded from https://www.dovepress.com/ by 118.70.13.36 on 20-Aug-2020
For personal use only.
Dovepress
Friedman et al
provided by the HMOs insuring 98% of the Israeli population (excluding nonpermanent residents or those with a “tourist” status). All HMOs have “paperless central computerized electronic databases” with extensive data on all health con-tacts, purchases of medications, procedures (eg, endoscopic evaluations and imaging), laboratory test results, hospital-izations, and mortality, as well as demographic information. The cost of medications is covered almost entirely by the HMO, ensuring high accuracy of drug purchasing records. Records of the HMOs from the hospitals are mostly limited to discharge diagnoses, but in some circumstances, more information is available.
Research on administrative databases can only be per-formed following rigorous development and validation of algorithms for case ascertainment to accurately identify true IBD patients within the databases.2,3 Such algorithms may include a combination of diagnostic codes (eg, International Classification of Disease [ICD] Version 9), health care contacts (hospitalizations or outpatient visits), prescription records, and/or procedure codes.
We thus aimed at developing algorithms for each of the four Israeli HMOs for identifying true IBD patients (ie, prevalence algorithm), date of disease onset (ie, incidence algorithm), and IBD type (Crohn’s disease [CD] vs ulcer-ative colitis [UC]). We also aimed at validating the chosen algorithms on independent large cohorts randomly selected from each HMO.
Methods
Algorithm derivation: reference standard
cohorts
IBD-related diagnostic codes (“codes” henceforth) were defined as codes from the ICD9: CD, 555.x and UC, 556.x (excluding isolated “colitis” [code 555.1], as this is a non-specific diagnosis). One HMO had internal general codes of “IBD” which were also included (Table S1 provides the complete list of codes).
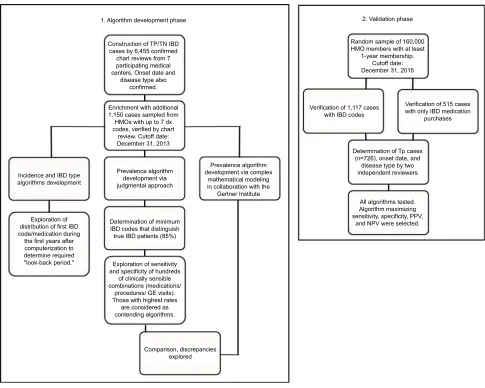
We first established two reference cohorts of true posi-tive (TP; ie, patients with IBD) and true negaposi-tive (TN; ie, subjects without IBD), composed of patients who were seen in the gastroenterology outpatient clinics of seven hospitals in Israel (affiliated with the authors’ list above) independent of the HMO databases (Figure 1), by indi-vidual chart reviews. For the TP cases, the chart reviewers also identified the date of diagnosis and IBD type (CD, UC, or IBD unclassified [IBDU]). The chart reviewers were medical professionals, were experienced in pediatric IBD, and were trained by DT. The process itself included
an in-depth longitudinal review of all available information in the charts, including the clinician’s coding, free text of medical history and discussion/plan, medications, and pro-cedures and investigations. Questionable cases were judged by DT.
In parallel, we sampled from the HMOs random charts of members who had been insured for at least 1 year with seven or less IBD-related diagnostic codes and determined by individual chart review those who truly had IBD (added to the TP cohort) and those who did not (added to the TN cohort). This was done in order to enrich the cohort with those who had only a few IBD-related codes and thus represent a more challenging group to diagnose. In three HMOs, we sampled 25–100 subjects in each code stratum from one to seven codes (the exact number of subjects depended on local technical constraints). The combined TP and TN groups formed the reference cohort, from which the diagnostic accuracy of algorithms was explored to differentiate IBD from non-IBD, to differentiate IBD type (CD vs UC), and to determine the true date of diagnosis.
Development of the algorithm for
identifying IBD cases (ie, prevalence
algorithm)
We first verified that the TP cases from the hospitals had at least one code within the HMOs’ databases. Next, we linked clinical data from the HMOs to each TP case and TN sub-ject, including IBD codes of diagnoses, physicians’ health contacts, procedures, imaging, and purchase of IBD-related medications using the following definitions:
• Codes accompanied by the suffix “rule out” or “sus-pected” and the nonspecific code “colitis” or “radiation colitis” were excluded, as done by others.4,5
• Multiple codes registered by the physicians of the same medical specialty on the same day were considered as one.
• At least 1-year interval was required between the first code or purchase of IBD-related medication and the last follow-up (ie, date of data lock, death, or discontinuation of membership in the HMO), to allow a sufficient “look-forward” period for accumulation of codes.
• Procedures performed for screening purposes (ie, Israeli Ministry of Health code 5255) as opposed to diagnostic purposes were not counted as procedures.
In the first stage of the algorithm development, we con-structed multiple 2×2 contingency tables to differentiate TP patients from TN subjects, utilizing clinically relevant
Clinical Epidemiology downloaded from https://www.dovepress.com/ by 118.70.13.36 on 20-Aug-2020
Dovepress Novel algorithms to identify IBD patients in Israel
combinations of the following variables: the number of IBD codes, IBD-related medications (Table S2), time periods between purchases of medications, IBD-related procedures (Table S3), and visits to a gastroenterology clinic. In parallel, statisticians from the Biostatistics Unit of the Gertner Institute for Epidemiology and Health Policy Research independently attempted to derive data-driven algorithms using statistical modeling methods on the same data. The top contending algorithm was selected based on maximizing sensitivity and specificity and was then tested on the validation data set ( “Validation of all three algorithms” section).
Development of the algorithms to
identify incident cases of IBD
The transition from paper to electronic records in the HMOs, which occurred during 1998–2003 (depending on the HMO),
posed a challenge to accurately identify the true diagnosis date because the first recorded code in the database could be a true incident date or a prevalent case who is merely new to the electronic system. This bias is an unavoidable phenomenon of all computerized databases.6 The longer the preceding period without an indication of IBD in the database (ie, “look-back” period), the higher the likelihood that the first documented code or IBD-related medication in the database indeed reflects the true diagnosis date. To determine the required look-back period, the true date of disease onset recorded by the chart reviewers in the TP reference cohort was compared with the date of the first IBD code or IBD-related medication purchase in the HMOs’ databases. Those who had their first code or medication purchase within the look-back period cannot be used for constructing an incidence cohort, since their date of disease onset cannot be determined with certainty.
Construction of TP/TN IBD cases by 6,455 confirmed
chart reviews from 7 participating medical centers, Onset date and
disease type also confirmed.
1. Algorithm development phase 2. Validation phase
Random sample of 160,000 HMO members with at least
1-year membership. Cutoff date: December 31, 2015
Verification of 1,117 cases with IBD codes
Verification of 515 cases with only IBD medication
purchases
Determination of Tp cases (n=726), onset date, and
disease type by two independent reviewers
All algorithms tested. Algorithm maximizing sensitivity, specificity, PPV,
and NPV were selected. Enrichment with additional
1,150 cases sampled from HMOs with up to 7 dx codes, verified by chart
review. Cutoff date: December 31, 2013
Prevalence algorithm development via judgmental approach
Prevalence algorithm development via complex
mathematical modeling in collaboration with the
Gertner Institute Incidence and IBD type
algorithms development
Exploration of distribution of first IBD code/medication during the first years after computerization to determine required
"look-back period." Exploration of sensitivity and specificity of hundreds
of clinically sensible combinations (medications/
procedures/ GE visits). Those with highest rates
are considered as contending algorithms.
Comparison, discrepancies explored Determination of minimum IBD codes that distinguish true IBD patients (85%)
Figure 1 Study flowchart.
Abbreviations: HMO, Health Maintenance Organization; IBD, inflammatory bowel disease; GE, gastroenterologist; NPV, negative predictive value; PPV, positive predictive value; TN, true negative; TP, true positive.
Clinical Epidemiology downloaded from https://www.dovepress.com/ by 118.70.13.36 on 20-Aug-2020
Dovepress
Friedman et al
We explored several combinations of codes, medica-tions, and procedures to develop an incidence algorithm for the date of diagnosis ±1 year. For internal validation, we employed a nontargeted approach in Clalit and Mac-cabi, the two largest HMOs, by exploring histograms of dates of first codes and medications of all IBD patients in the HMOs (identified by the aforementioned prevalence algorithm), as well as the distribution of codes of anemia, abdominal pain, and diarrhea around the proposed index year, determined by the incidence algorithm. If most of the codes were on or around the proposed index date, this would lend further validity to identifying the index year by the proposed algorithm. Finally, the chosen algorithm was validated on an independent cohort (“Validation of all three algorithms” section).
Development of the algorithms to classify
IBD disease type (CD or UC)
IBD type was determined by comparing recorded codes (CD or UC) in the HMOs’ databases with the true diagnosis recorded by the chart reviewers in the TP cohort. Several combinations of codes were explored, and the algorithm that maximized predictive values was then validated on an independent cohort (“Validation of all three algorithms” section).
Validation of all three algorithms
Independent of the aforementioned reference cohorts, the validation cohort was composed of 160,000 subjects ran-domly selected from the HMO’s databases (40,000 subjects per HMO) with the only inclusion criterion being a member in the HMO for at least 1 continuous year. Based on our prior findings that almost all IBD patients are identified in the HMO’s databases by at least one code, members without any IBD-related codes were automatically categorized in the TN group, while all charts with any IBD-related codes were reviewed independently by two trained chart reviewers. However, to be conservative, we reviewed also subjects with the purchase of any IBD-related medication (Table S2) even in the absence of IBD-related codes. Disagreements between the reviewers were resolved by the principal investigator (DT). In only Clalit, charts were reviewed by the treating gastroenterologist. Based on this chart review process, the 160,000 subjects were dichotomized into TP IBD patients and TN subjects. The aforementioned developed algorithms were then tested on this cohort for sensitivity, specificity, positive predictive value (PPV), and negative predictive value (NPV).
IBD prevalence
Following the validation process, we applied the algorithms on the databases of all four HMOs and identified IBD patients as of December 31, 2015. Denominators rates were derived from the Israeli National Insurance Institute.
Statistical analysis
The diagnostic accuracy of all algorithms was explored by constructing 2×2 contingency tables to calculate sensitivity, specificity, PPV, and NPV, with 95% confidence intervals (CI). In parallel, the Gertner Institute independently used logistic regression and Classification and Regression Trees analysis to develop data-driven algorithms. Models were tested by applying an automated procedure for Recursive Partitioning and Regression Trees. Inter-rater agreement was calculated via the κ statistic. Data analyses were conducted by using SPSS Version 22.0 0 (IBM Corporation, Armonk, NY, USA), the “rpart”: recursive partitioning. R package version 3.2.2 (R Development Core Team, 2013; https://www.r-project.org), and SAS software Version 9.4 (SAS Institute Inc., Cary, NC, USA). This study received approval from all ethics committees of the research institutions taking part in the study (Shaare Zedek Medical Center, Tel Aviv Sourasky Medical Center, Rabin Medical Center, Hadassah Medical Center, Soroka Medical Center, Rambam Health Care Campus, Chaim Sheba Medical Center, Clalit Health Services, and Leumit Health Services) and was performed according to their instructions.
Results
Prevalence algorithms
We reviewed the charts of 6,455 subjects who visited the gastroenterology clinics of the participating hospitals (ie, outside the HMOs), including 4,886 (76%) TP IBD cases and 1,569 (24%) TN (non-IBD) subjects. Of the hospitals’ TP cohort, 4,693 (97%) had at least one IBD-related code in the HMOs. This implies that the likelihood of IBD in a given subject without any codes within the HMOs’ databases is negligible, and those not identified by at least one code could be considered as not having IBD. We confirmed this observation later in the validation cohort (see below).
In order to ensure that subjects with only a few codes are properly represented in the cohort, additional 1,150 cases with seven or less codes were added to the TP cohort (n=554, 48%) and TN cohort (n=596, 52%) from the HMOs’ databases following individual chart reviews (Table 1; 272 members in the four HMOs with one code, 237 with two codes, 209 with three codes, 145 with four codes, 110 with five codes, 107 with six codes, and 118 with seven codes).
Clinical Epidemiology downloaded from https://www.dovepress.com/ by 118.70.13.36 on 20-Aug-2020
Dovepress Novel algorithms to identify IBD patients in Israel
The final derivation cohort thus included 7,203 subjects: 5,131 (71%) TPs, and 2,072 (29%) TNs (Table 1).
As expected, there was a positive correlation between the TP rate and the number of codes recorded for the subjects until a saturation of >80% TPs had been reached (determined a priori as the sufficient cutoff): in Clalit, Meuhedet, and Leumit after four codes and in Maccabi after five codes (Figure 2). We thus concluded that at least five to six IBD codes (depending on the HMO) were necessary to determine TP IBD status, irre-spective of other variables. In Clalit, at least one code defined as “permanent” by the physician with one regular code or one hospital discharge IBD-related code with one regular code
was also sufficient to represent TP cases with 99% accuracy. All other cases required supportive data to determine the diagnosis of IBD. We thus constructed 942 combinations of codes, procedures, and medications (the number of purchases, time interval between purchases, and cumulative months of intake) to explore in each HMO (Table S4).
One combination was found to perform best in all HMOs: at least one IBD-related code with either of the following: at least three purchases of IBD-related medications, or ≥3-month interval between the first and last purchase, or ≥2 purchases of steroids/5-aminosalicylic acid enemas ( Appendix 1). The statistical modeling yielded an algorithm
Table 1 Characteristics of subjects constituting the derivation algorithm data sets in the 4 HMOs
Clalit (n=2,972) Maccabi (n=1,908) Meuhedet (n=1,336) Leumit (n=987) Total True IBD
n=2,231 (75%)
Non-IBD n=741 (25%)
Total True IBD n=1,438 (75%)
Non-IBD n=470 (25%)
Total True IBD n=887 (66%)
Non-IBD n=449 (34%)
Total True IBD n=575 (58%)
Non-IBD n=412 (42%)
Hospital cases
2,852 (96) 2,174 (97) 678 (91) 1,513 (79) 1,246 (87) 267 (57) 950 (71) 689 (78) 261 (58) 738 (75) 468 (81) 270 (65)
Sampled HMO cases
120 (4) 57 (3) 63 (9)a 395 (21) 192 (13) 203 (43)a 386 (29) 198 (22) 188 (42)a 249 (25) 107 (19) 142 (35)a
Age groups
0–18 75 (3) 37 (2) 38 (5) 111 (6) 64 (5) 47 (10) 134 (10) 82 (9) 52 (12) 66 (7) 33 (6) 33 (8)
19–64 2,217 (74) 1,892 (85) 325 (44) 1,572 (82) 1,214 (84) 358 (76) 1,053 (79) 726 (82) 327 (73) 792 (80) 475 (82) 317 (77) >65 680 (23) 302 (13) 378 (51) 225 (12) 160 (11) 65 (14) 149 (11) 79 (9) 70 (15) 129 (13) 67 (12) 62 (15) Female 1,485 (50) 1,115 (50) 370 (50) 816 (50) 716 (50) 100 (49) 672 (50) 409 (46) 263 (59) 517 (52) 285 (50) 232 (56) CD 1,283 (43) 1,283 (58) n/a 892 (47) 892 (62) n/a 559 (42) 559 (63) n/a 355 (36) 355 (62) n/a
UC 924 (31) 924 (41) n/a 528 (28) 528 (37) n/a 389 (25) 328 (37) n/a 220 (22) 220 (38) n/a
IBDU 24 (1) 24 (1) n/a 18 (1) 18 (1) n/a 0 (0) 0 (0) n/a 0 (0) 0 (0) n/a
Notes:aAll with at least one code per eligibility criteria for this subgroup; all figures represent count (%).
Abbreviations: CD, Crohn’s disease; HMO, Health Maintenance Organization; IBD, inflammatory bowel disease; IBDU, IBD unclassified; UC, ulcerative colitis; n/a, not applicable.
Maccabi Clalit
%
TP
1 0 10 100
20 30 40 50 60 70 80 90
2 3 4 5 1 2 3 4 5 6 1 2 3 4 5 1 2 3 4 5
Leumit Meuhedet
Figure 2 Association between the number of IBD-eligible codes and true positive rates.
Abbreviations: IBD, inflammatory bowel disease; TP, true positive.
Clinical Epidemiology downloaded from https://www.dovepress.com/ by 118.70.13.36 on 20-Aug-2020
Dovepress
Friedman et al
that was slightly inferior to the judgmental one in its discrimi-nant utility and was less clinically intuitive; thus, it was not included in the final analysis (data not shown).
In the 160,000 subjects of the validation data set, 1,117 (0.7%) subjects had at least one IBD-related code, and an additional 515 (0.3%) subjects had purchased IBD-related medications in the absence of codes. The charts of these 1,632 subjects (1%) were individually reviewed; the interobserver agreement between the chart extractors was excellent with an agreement rate of 93% (κ 0.87, 95% CI 0.78–0.97).
Only eight (1.5%) of the 515 patients without IBD codes who had commenced on IBD-related medications were true IBD cases. Based on these findings, as well our previous finding from the hospital cases, we confirmed that those without any IBD codes do not have IBD with an accuracy of almost 100%. Eventually, only 718 (64%) of the 1,117 subjects with at least one code were determined as true IBD patients by the chart review (0.5% of the entire validation cohort).
We then applied our derived algorithm to the validation cohort. Although each HMO was analyzed separately, the chosen algorithm achieved high and similar accuracy in all four HMOs (pooled diagnostic accuracy: sensitivity 89% [95% CI 87%–92%], specificity 99% [99.95%–99.97%], PPV 92% [90%–94%], NPV 99% [99.94%–99.96%];
Appendix 1).
Identifying diagnosis date (ie, incidence
algorithm)
We determined a priori that the look-back period should achieve an accuracy of at least 80% for identifying the date of diagnosis, to balance between the accuracy of the algorithm and allowing enough years of follow-up. This has been achieved in 2005 in three of the four HMOs. Maccabi achieved this threshold in 2003, but in order to standardize the incidence cohort, we decided to implement 2005 as the cutoff year across all four HMOs – translating to a look-back period of 5 years in Clalit and Maccabi, 3 years in Meuhedet, and 2 years in Leumit (dictated by the inception date of the computerized systems).
The HMO-specific look-back period in combination with ≥1 year of membership has been determined as the most accurate incidence algorithm, after reviewing many options by 2×2 tables. By this algorithm, 82% of cases in the incidence cohort had an incidence date that matched the true date within ±1 year, meeting our a priori threshold. Further combinations that included codes of anemia, diarrhea, and abdominal pain, as well as excess use of medical services or IBD-related pro-cedures, did not enhance the diagnostic accuracy.
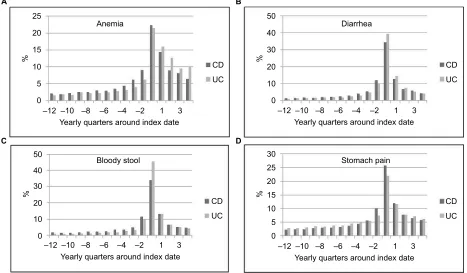
For internal validation in Clalit and Maccabi, we con-firmed that codes related to anemia, diarrhea, and stomach pain were most frequent around the index year determined by the aforementioned algorithm (Figure 3A–D). Finally, we
CD UC
Yearly quarters around index date
–12 –10 –8 –6 –4 –2 1 3
CD UC
Yearly quarters around index date
–12 –10 –8 –6 –4 –2 1 3
CD UC
Yearly quarters around index date
–12 –10 –8 –6 –4 –2 1 3
CD UC
Yearly quarters around index date
%
–12 0 5 10 15 20 25
A B
C D
%
0 5 10 15 20 25 30
%
0 10 20 30 40 50
%
0 10 20 30 40 50
–10 –8 –6 –4 –2 1 3
Anemia Diarrhea
Bloody stool Stomach pain
Figure 3 (A–D) Distribution of IBD-related symptoms around the diagnosis date determined by the algorithm in Clalit and Maccabi.
Abbreviations: CD, Crohn’s disease; IBD, inflammatory bowel disease; UC, ulcerative colitis.
Clinical Epidemiology downloaded from https://www.dovepress.com/ by 118.70.13.36 on 20-Aug-2020
Dovepress Novel algorithms to identify IBD patients in Israel
validated the algorithms in the four HMOs on the validation data set of 160,000 subjects resulting in a pooled sensitivity of 83% (95% CI 78%–88%), specificity 68% (60%–75%), PPV 82% (78%–85%), and NPV 70% (64%–76%; Appendix 1).
Algorithms to classify IBD disease type
(CD or UC)
The most accurate algorithm of all options was the majority of CD- or UC-specific codes out of the three most recent health care contacts or the most recent code when only one or two codes were available or when there was one CD, one UC, and one IBD diagnosis. This algorithm achieved a pooled sensitivity of 92% (95% CI 88%–95%), specificity 97% (94%–99%), PPV 97% (94%–98%), and NPV 92% (89%–94%) on the validation cohort (Appendix 1). As there is no specific code for IBDU in either the ICD9 system or the HMOs, this phenotype could not be categorized by our algorithm. Of the 38 IBDU cases from the hospitals, 16 were recorded in the HMO databases as CD, 19 as UC patients, and three with a general “colitis” code.
IBD prevalence
On December 31, 2015, a total of 38,291 IBD patients were residing in Israel, corresponding to a national prevalence rate of 459/100,000 (0.46%), of whom 20,196 (52.7%) had CD, 17,810 (46.5%) had UC, and 285 (0.8%) had only a general IBD code (available in one of the HMOs) and thus could not be classified as either UC or CD. A manuscript with complete analyses of the epidemiology of IBD in Israel based on these algorithms is underway.
Discussion
Following a rigorous multistep process, we developed and validated novel algorithms for exploring population-based IBD in Israel using health administrative data. These rithms included a prevalence algorithm, an incidence algo-rithm (for constructing a population-based inception cohort), and an algorithm differentiating CD from UC. We found that codes were very sensitive, but not specific. In fact, nearly one third of those with at least one IBD-related code did not have IBD by chart review, in both the derivation and validation cohorts in all four HMOs. This emphasizes the importance of developing accurate classification algorithms prior to the utilization of any administrative database worldwide.2
Using health administrative data is an efficient method for constructing population-based surveillance cohorts4 while minimizing selection and referral biases. However, using these data that were recorded for nonresearch purposes may
be hampered by several inherent limitations.5 Misclassifica-tion of the target populaMisclassifica-tion is the most notable barrier, and therefore, rigorous validation of diagnostic algorithms is of upmost importance.2,7,8 The validity of using codes to identify the disease under study varies between different diseases.9 IBD may be a particularly challenging disease to ascertain, given the diversity of phenotypes and disease course. Another inherent limitation of any electronic database stems from the relatively recent computerization of health records, resulting in suboptimal performance of the algorithms. It is possible that patients diagnosed long ago and entered complete sus-tained remission without any IBD treatment may be missed from our prevalence cohort. However, ~98% of existing patients from the medical centers had at least one code within the HMO; thus, this misclassification bias is likely negligible. The bias in the incidence cohorts may be higher (as it is unknown always whether the first code is indeed the first ever or merely the first after computerization), but we reached sufficiently accurate algorithm that is expected to gradually improve further as the time interval increases from the inception of computerization. A third limitation, specific to Israel, is that our data do not include a code for IBDU, and these patients are coded as either CD or UC. Finally, HMO data do not typically include hospital data (except for general discharge diagnoses) or the explicit findings of procedures (eg, endoscopic, radiologic, and histologic results).
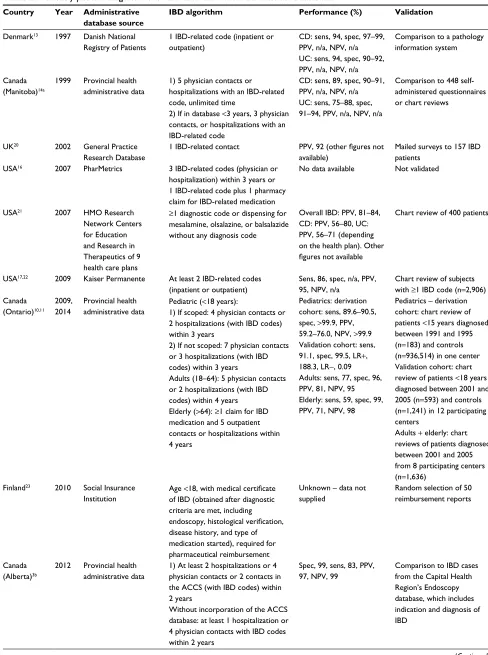
Our algorithms are among the most accurate IBD algo-rithms reported to date (Table 2). We performed the derivation and validation processes independently in each of the HMOs, and the fact that the same algorithms achieved the best accu-racy across all four HMOs lends further support for their validity. In addition, Israel is unique in several parameters that may improve the accuracy of administrative data. Every citizen is entitled to health care provided by an HMO, who in turn holds records of comprehensive paperless clinical data on centralized servers. Medication records are highly accurate since their cost is covered if purchased through the HMO. Indeed, we found that the purchase of IBD-related medica-tions was the most effective identifying characteristic of IBD cases in addition to physicians’ codes. Another advantage of our database, overcoming to some extent the aforementioned limitations, is that the subjects’ de-identified unique number can be linked to other national repositories including cancer, mortality, hospitalization, and surgeries.
Population-based administrative IBD research has been conducted in several regions of the world, such as in Canada’s Ontario, Manitoba, and Alberta provinces, as well as in the UK, Denmark, Kaiser Permanente, and the USA’s PharMetrics
Clinical Epidemiology downloaded from https://www.dovepress.com/ by 118.70.13.36 on 20-Aug-2020
Dovepress
Friedman et al
Table 2 Previously published algorithms for IBD ascertainment in administrative databases
Country Year Administrative database source
IBD algorithm Performance (%) Validation
Denmark13 1997 Danish National
Registry of Patients
1 IBD-related code (inpatient or outpatient)
CD: sens, 94, spec, 97–99, PPV, n/a, NPV, n/a
UC: sens, 94, spec, 90–92,
PPV, n/a, NPV, n/a
Comparison to a pathology information system
Canada
(Manitoba)14a
1999 Provincial health administrative data
1) 5 physician contacts or hospitalizations with an IBD-related code, unlimited time
2) If in database <3 years, 3 physician
contacts, or hospitalizations with an IBD-related code
CD: sens, 89, spec, 90–91, PPV, n/a, NPV, n/a
UC: sens, 75–88, spec,
91–94, PPV, n/a, NPV, n/a
Comparison to 448 self-administered questionnaires or chart reviews
UK20 2002 General Practice
Research Database
1 IBD-related contact PPV, 92 (other figures not available)
Mailed surveys to 157 IBD patients
USA16 2007 PharMetrics 3 IBD-related codes (physician or
hospitalization) within 3 years or 1 IBD-related code plus 1 pharmacy claim for IBD-related medication
No data available Not validated
USA21 2007 HMO Research
Network Centers for Education and Research in Therapeutics of 9 health care plans
≥1 diagnostic code or dispensing for
mesalamine, olsalazine, or balsalazide
without any diagnosis code
Overall IBD: PPV, 81–84,
CD: PPV, 56–80, UC:
PPV, 56–71 (depending on the health plan). Other
figures not available
Chart review of 400 patients
USA17,22 2009 Kaiser Permanente At least 2 IBD-related codes
(inpatient or outpatient)
Sens, 86, spec, n/a, PPV, 95, NPV, n/a
Chart review of subjects
with ≥1 IBD code (n=2,906) Canada
(Ontario)10,11
2009, 2014
Provincial health
administrative data Pediatric (<18 years):1) If scoped: 4 physician contacts or 2 hospitalizations (with IBD codes) within 3 years
2) If not scoped: 7 physician contacts or 3 hospitalizations (with IBD codes) within 3 years
Adults (18–64): 5 physician contacts or 2 hospitalizations (with IBD codes) within 4 years Elderly (>64): ≥1 claim for IBD medication and 5 outpatient contacts or hospitalizations within 4 years
Pediatrics: derivation cohort: sens, 89.6–90.5, spec, >99.9, PPV, 59.2–76.0, NPV, >99.9 Validation cohort: sens, 91.1, spec, 99.5, LR+, 188.3, LR−, 0.09 Adults: sens, 77, spec, 96, PPV, 81, NPV, 95 Elderly: sens, 59, spec, 99, PPV, 71, NPV, 98
Pediatrics – derivation cohort: chart review of patients <15 years diagnosed
between 1991 and 1995
(n=183) and controls (n=936,514) in one center Validation cohort: chart review of patients <18 years
diagnosed between 2001 and
2005 (n=593) and controls (n=1,241) in 12 participating centers
Adults + elderly: chart reviews of patients diagnosed
between 2001 and 2005
from 8 participating centers (n=1,636)
Finland23 2010 Social Insurance
Institution
Age <18, with medical certificate of IBD (obtained after diagnostic
criteria are met, including
endoscopy, histological verification,
disease history, and type of medication started), required for
pharmaceutical reimbursement
Unknown – data not
supplied
Random selection of 50
reimbursement reports
Canada
(Alberta)3b
2012 Provincial health administrative data
1) At least 2 hospitalizations or 4 physician contacts or 2 contacts in the ACCS (with IBD codes) within 2 years
Without incorporation of the ACCS
database: at least 1 hospitalization or
4 physician contacts with IBD codes within 2 years
Spec, 99, sens, 83, PPV, 97, NPV, 99
Comparison to IBD cases from the Capital Health Region’s Endoscopy
database, which includes
indication and diagnosis of IBD
(Continued)
Clinical Epidemiology downloaded from https://www.dovepress.com/ by 118.70.13.36 on 20-Aug-2020
Dovepress Novel algorithms to identify IBD patients in Israel
database.3,10–17 Not all published case ascertainment algo-rithms were thoroughly developed and validated (Table 2). The Ontario Crohn’s and Colitis Cohort is based on hospital discharge data, billing claims, and demographic data, but medication data are available only for patients >64 years, which improves the accuracy in this age group.10,11 Similar to our findings, they found that 99.5% of IBD patients had at least one IBD code.2,10 Rezaie et al achieved high accuracy in Alberta via an algorithm that incorporated the number of hospitalizations and physician contacts without medication
data.3 Additional IBD algorithms are based mainly on IBD-related codes and hospitalizations (Table 2).17–19
Conclusion
We developed and validated algorithms to identify IBD cases in the four Israeli HMO databases. The algorithms are now being used for constructing the population-based Epidemi-ology of the Israeli IBD Research Nucleus administrative database that includes 38,291 IBD patients as of the end of 2015. The diagnosis date can be determined in 13,910 (36%)
Country Year Administrative database source
IBD algorithm Performance (%) Validation
Sweden19 2013 Swedish NPR ≥2 ICD9/10 diagnoses of IBD in
nonprimary care
The general validity of the NPR estimated at PPV, 85–95; for the period 1965–1983: PPV=74 for singular IBD diagnoses of inpatient care. Other
figures unavailable
No direct validation process
USA24 2014 Veterans Affairs Health
Care System
≥2 ICD9 IBD codes with at least one from an outpatient encounter
CD: PPV, 83, UC: PPV, 89. Other figures unavailable
Chart review of all patients
diagnosed between 1999 and
2009 at 2 veterans affairs hospitals with ≥1 IBD code (n=1,871)
Germany25 2014 Health care claims
data of a large German Statutory Health Insurance (AOK)
1 ICD10 code and at least 1 of
the following: 1) CD/UC hospital
discharge diagnosis; 2) >1 quarters
with CD/UC code (ambulatory and
hospital diagnoses); 3) death during
the 4 weeks subsequent to the hospital stay with CD/UC diagnosis;
4) death in the quarter in which the
first CD/UC diagnosis was made
No data available No direct validation,
sensitivity analysis performed
Italy26 2014 Italian National Health
System and DPER in the Lazio region
A hospital discharge with CD/UC
code, or the activation of copayment
exemption for CD/UC
All administrative data sources: sens, 82, DPER:
sens, 42. Other figures unavailable
2,358 clinically confirmed
CD cases from 5 centers
Hungary27 2016 National Health
Insurance Fund
≥1 IBD code from inpatient or
outpatient databases
No data available No direct validation,
however sensitivity analysis performed
Sweden28 2017 Swedish NPR and the
SWIBREG for IBD 1) ≥
2 diagnoses of IBD/CD/UC
(hospitalizations or nonprimary care outpatient visits).
2) Combining data from SWIBREG
(≥1 record) and the NPR (≥1 record)
NPR: PPV: IBD, 93, CD,
72–81, UC, 79–90.
NPR + SWIBREG: PPV:
IBD, 99, CD, 90, UC, 96. Other figures unavailable
129 charts from NPR and 165 charts from NPR and SWIBREG
Sweden29 2017 Swedish NPR Pediatric patients living in Sweden
in 2010 with ≥2 visits in either inpatient (1993–2010) or outpatient care (2001–2010, including day surgery since 1997)
No data available No direct validation,
sensitivity analysis performed
Notes:aAn additional study in Nova Scotia, Canada, used the Manitoba algorithm.30bAn additional study in Quebec, Canada, used a variation of the Alberta algorithm.31
Abbreviations: ACCS, Ambulatory Care Classification System; CD, Crohn’s disease; DPER, disease-specific payment exemptions register; HMO, Health Maintenance Organization; IBD, inflammatory bowel disease; IBDU, IBD unclassified; ICD, International Classification of Disease; LR, likelihood ratio; n/a, not applicable; NPR, National Patient Register; NPV, negative predictive value; PPV, positive predictive value; sens, sensitivity; spec, specificity; SWIBREG, Swedish Quality Register; UC, ulcerative colitis.
Table 2 (Continued)
Clinical Epidemiology downloaded from https://www.dovepress.com/ by 118.70.13.36 on 20-Aug-2020
Dovepress
Friedman et al
patients for constructing inception cohorts. This work forms the basis for extensive future research of IBD in Israel. The rigorous methodology described in this manuscript may be adapted to other countries in order to ensure exploiting the full potential of population-based research in IBD.
Study highlights
Current knowledge
• Changes in the natural history of inflammatory bowel diseases (IBDs), risk factors, disease trends, and poor disease outcomes are best studied in a population-based setting.
• Few validated IBD national cohorts exist with the potential to link extensive medical, environmental, and socioeconomic data to the cohort; the structure of the Israeli health care systems provides such an opportunity, provided that validated algorithms accurately identifying the patients are developed.
What is new here?
• We have developed and validated powerful algorithms to correctly identify true IBD patients in Israel, as well as diagnosis date and disease type.
• After applying the algorithms to the four Israeli Health Maintenance Organizations’ databases, we calculated the national prevalence rate of IBD at the end of 2015. • The implementation of these algorithms will form the
bases for extensive IBD population-based research, impacting numerous clinical aspects.
The rigorous methodology described here may be adopted in other countries in order to ensure exploiting the full poten-tial of population-based research in IBD.
Acknowledgments
The authors are grateful to Raya Barishev, Dr Ofer Ben-Bassat, Zvika Birenbuim, Yana Buyanover, Elana Chernin, Dr Dror Cohen, Leah Della Pergola Berman, Ruth Eliezer, Prof Laurence Freedman, Galina Garberg, Dr Amos Kahan, Dalia Katz, Prof Aharon Klar, Ruth Kurzberg, Dr Oren Led-der, Tami Lederfein, Nina Levhar, Mor Livni, Alina Livshitz, Dana Marcus, Aya Matter, Betty Mazouz, Iris Milner, Sandra Neuman, Dr Ilya Novikov, Dr Joerge Pfeffer, Dimitry Rubin-chik, Dr Daher Saleh, Suzie Sharki, Avital Shaul, Terri Singer, Dr Sharon Steinberg, Dr Eyal Shteyer, Dr Yoram Wolf, Liron Yahav, and Arnona Ziv. This study was supported by a grant from the Leona M. and Harry B. Helmsley Charitable Trust.
Author contributions
Mira Y Friedman, Gili Focht, Malka Avitzour, Yael Shachar, Iris Goren, Nirit Borovsky, Moshe B Hoshen, Ran D Balicer, Eric I Benchimol, and Dan Turner involved in the conception and design of the study. Mira Y Friedman, Maya Leventer-Roberts, Joseph Rosenblum, Nir Zigman, Iris Goren, Vered Mourad, Natan Lederman, Nurit Cohen, Eran Matz, Doron Z Dushnitzky, Nirit Borovsky, Moshe B Hoshen, Gili Focht, Yael Shachar, Yehuda Chowers, Rami Eliakim, Shomron Ben-Horin, Shmuel Odes, Doron Schwartz, Iris Dotan, Eran Israeli, Zohar Levi, Ran D Balicer, and Dan Turner involved in data collection. Mira Y Friedman, Maya Leventer-Roberts, Joseph Rosenblum, Iris Goren, Nurit Cohen, Yael Shachar, Vered Mourad, Nir Zigman, Doron Z Dushnitzky, Ran D Balicer, Nirit Boro-vsky, Moshe B Hoshen, Gili Focht, Malka Avitzour, Eric I Benchimol, and Dan Turner involved in the data analy-sis and interpretation. Mira Y Friedman and Dan Turner drafted the manuscript. All authors contributed toward data analysis, drafting and revising the paper and agree to be accountable for all aspects of the work.
Disclosure
The authors report no conflicts of interest in this work.
References
1. Cohen R. Health Maintenance Organization membership 2014, periodic surveys; 2015 [cited September 2015]. Available from: https://www.btl. gov.il/Publications/survey/Documents/seker_271.pdf. Accessed May 15, 2017.
2. Benchimol EI, Manuel DG, To T, Griffiths AM, Rabeneck L, Guttmann A. Development and use of reporting guidelines for assessing the quality of validation studies of health administrative data.J Clin Epidemiol. 2011;64(8):821–829.
3. Rezaie A, Quan H, Fedorak RN, Panaccione R, Hilsden RJ. Development and validation of an administrative case definition for inflammatory bowel diseases. Can J Gastroenterol. 2012;26(10):711–717. 4. Newton KM, Wagner EH, Ramsey SD, et al. The use of automated data
to identify complications and comorbidities of diabetes: a validation study. J Clin Epidemiol. 1999;52(3):199–207.
5. Petersen LA, Wright S, Normand SL, Daley J. Positive predictive value of the diagnosis of acute myocardial infarction in an administrative database. J Gen Intern Med. 1999;14(9):555–558.
6. Griffiths RI, O’Malley CD, Herbert RJ, Danese MD. Misclassification of incident conditions using claims data: impact of varying the period used to exclude pre-existing disease. BMC Med Res Methodol. 2013; 13(1):32.
7. Virnig BA, McBean M. Administrative data for public health surveil-lance and planning. Annu Rev Public Health. 2001;22:213–230. 8. Iezzoni LI. Assessing quality using administrative data. Ann Intern Med.
1997;127(8 Pt 2):666–674.
9. Guttmann A, Nakhla M, Henderson M, et al. Validation of a health administrative data algorithm for assessing the epidemiology of diabetes in Canadian children. Pediatr Diabetes. 2010;11(2):122–128.
Clinical Epidemiology downloaded from https://www.dovepress.com/ by 118.70.13.36 on 20-Aug-2020
Dovepress
Clinical Epidemiology
Publish your work in this journal
Submit your manuscript here: https://www.dovepress.com/clinical-epidemiology-journal
Clinical Epidemiology is an international, peer-reviewed, open access, online journal focusing on disease and drug epidemiology, identifica-tion of risk factors and screening procedures to develop optimal pre-ventative initiatives and programs. Specific topics include: diagnosis, prognosis, treatment, screening, prevention, risk factor modification,
systematic reviews, risk and safety of medical interventions, epidemiol-ogy and biostatistical methods, and evaluation of guidelines, translational medicine, health policies and economic evaluations. The manuscript management system is completely online and includes a very quick and fair peer-review system, which is all easy to use.
Dove
press
Novel algorithms to identify IBD patients in Israel
10. Benchimol EI, Guttmann A, Griffiths AM, et al. Increasing incidence of paediatric inflammatory bowel disease in Ontario, Canada: evidence from health administrative data. Gut. 2009;58(11):1490–1497. 11. Benchimol EI, Guttmann A, Mack DR, et al. Validation of
interna-tional algorithms to identify adults with inflammatory bowel disease in health administrative data from Ontario, Canada. J Clin Epidemiol. 2014;67(8):887–896.
12. Garcia Rodriguez LA, González-Pérez A, Johansson S, Wallander MA. Risk factors for inflammatory bowel disease in the general population.
Aliment Pharmacol Ther. 2005;22(4):309–315.
13. Fonager K, Sorensen HT, Olsen J. Change in incidence of Crohn’s disease and ulcerative colitis in Denmark. A study based on the National Registry of Patients, 1981-1992. Int J Epidemiol. 1997;26(5): 1003–1008.
14. Bernstein CN, Blanchard JF, Rawsthorne P, Wajda A. Epidemiology of Crohn’s disease and ulcerative colitis in a central Canadian province: a population-based study. Am J Epidemiol. 1999;149(10):916–924. 15. Kappelman MD, Moore KR, Allen JK, Cook SF. Recent trends in the
prevalence of Crohn’s disease and ulcerative colitis in a commercially insured US population. Dig Dis Sci. 2013;58(2):519–525.
16. Kappelman MD, Rifas-Shiman SL, Kleinman K, et al. The prevalence and geographic distribution of Crohn’s disease and ulcerative colitis in the United States. Clin Gastroenterol Hepatol. 2007;5(12):1424–1429. 17. Herrinton LJ, Liu L, Lewis JD, Griffin PM, Allison J. Incidence
and prevalence of inflammatory bowel disease in a Northern Cali-fornia managed care organization, 1996-2002. Am J Gastroenterol. 2008;103(8):1998–2006.
18. Fonager K, Sørensen HT, Rasmussen SN, Møller-Petersen J, Vyberg M. Assessment of the diagnoses of Crohn’s disease and ulcerative colitis in a Danish Hospital Information System. Scand J Gastroenterol. 1996;31(2):154–159.
19. Büsch K, Ludvigsson JF, Ekström-Smedby K, Ekbom A, Askling J, Neovius M. Nationwide prevalence of inflammatory bowel disease in Sweden: a population-based register study. Aliment Pharmacol Ther. 2014;39(1):57–68.
20. Lewis JD, Brensinger C, Bilker WB, Strom BL. Validity and complete-ness of the General Practice Research Database for studies of inflam-matory bowel disease. Pharmacoepidemiol Drug Saf. 2002;11(3): 211–218.
21. Herrinton LJ, Liu L, Lafata JE, et al. Estimation of the period prevalence of inflammatory bowel disease among nine health plans using computer-ized diagnoses and outpatient pharmacy dispensings. Inflamm Bowel Dis. 2007;13(4):451–461.
22. Liu L, Allison JE, Herrinton LJ. Validity of computerized diagnoses, pro-cedures, and drugs for inflammatory bowel disease in a northern California managed care organization. Pharmacoepidemiol Drug Saf. 2009;18(11): 1086–1093.
23. Lehtinen P, Ashorn M, Iltanen S, et al. Incidence trends of pediatric inflammatory bowel disease in Finland, 1987–2003, a nationwide study.
Inflamm Bowel Dis. 2011;17(8):1778–1783.
24. Hou JK, Tan M, Stidham RW, et al. Accuracy of diagnostic codes for identifying patients with ulcerative colitis and Crohn’s disease in the Veterans Affairs Health Care System. Dig Dis Sci. 2014;59(10): 2406–2410.
25. Hein R, Köster I, Bollschweiler E, Schubert I. Prevalence of inflam-matory bowel disease: estimates for 2010 and trends in Germany from a large insurance-based regional cohort. Scand J Gastroenterol. 2014;49(11):1325–1335.
26. Di Domenicantonio R, Cappai G, Arcà M, et al. Occurrence of inflam-matory bowel disease in central Italy: a study based on health informa-tion systems. Dig Liver Dis. 2014;46(9):777–782.
27. Kurti Z, Vegh Z, Golovics PA, et al. Nationwide prevalence and drug treatment practices of inflammatory bowel diseases in Hungary: a population-based study based on the National Health Insurance Fund database. Dig Liver Dis. 2016;48(11):1302–1307.
28. Jakobsson GL, Sternegård E, Olén O, et al. Validating inflammatory bowel disease (IBD) in the Swedish National Patient Register and the Swedish Quality Register for IBD (SWIBREG). Scand J Gastroenterol. 2017;52(2):216–221.
29. Ludvigsson JF, Büsch K, Olén O, et al. Prevalence of paediatric inflam-matory bowel disease in Sweden: a nationwide population-based register study. BMC Gastroenterol. 2017;17(1):23.
30. Leddin D, Tamim H, Levy AR. Decreasing incidence of inflammatory bowel disease in eastern Canada: a population database study. BMC Gastroenterol. 2014;14:140.
31. Bitton A, Vutcovici M, Patenaude V, Sewitch M, Suissa S, Brassard P. Epidemiology of inflammatory bowel disease in Quebec: recent trends.
Inflamm Bowel Dis. 2014;20(10):1770–1776.
Clinical Epidemiology downloaded from https://www.dovepress.com/ by 118.70.13.36 on 20-Aug-2020