Published online January 23, 2015 (http://www.sciencepublishinggroup.com/j/acm) doi: 10.11648/j.acm.20150401.12
ISSN: 2328-5605 (Print); ISSN: 2328-5613 (Online)
Texture classification using spline, wavelet decomposition
and fractal dimension
Saad Al-Momen
1, Loay E. George
2, Raid K. Naji
11
Mathematics Department, College of Science, Baghdad University, Baghdad, IRAQ
2
Computer Science Department, College of Science, Baghdad University, Baghdad, IRAQ
Email address:
[email protected] (S. Al-Momen), [email protected] (L. E. George), [email protected] (R. K. Naji)
To cite this article:
Saad Al-Momen, Loay E. George, Raid K. Naji. Texture Classification Using Spline, Wavelet Decomposition and Fractal Dimension.
Applied and Computational Mathematics. Vol. 4, No. 1, 2015, pp. 5-10. doi: 10.11648/j.acm.20150401.12
Abstract:
Feature extraction is an important process for texture classification. This paper suggests two sets of features for texture analysis. In the first set of features, a set of fractal features isobtained from the eight wavelet sub-bands that are generated by applying Haar wavelet transform twice times according to dyadic architecture. The fractal features are determined using the differential box counting method. While for determining the second set of features, the cubic spline representation is applied to decompose the image signal into rough and smooth components; then applying the wavelet transform and finally compute the fractal dimension for all the sub-bands of both images. Each type of these two extracted feature sets is studied individually, and they are used together. Their overall performance is investigated. The proposed features set has been applied on two texture datasets, one consists of textures with directional properties, and the second set consists of textures samples that have directional attributes. The test results showed that the proposed methods give ahigh level of classification with images that have or do not have directional properties.Keywords:
Texture Classification, Texture Analysis, Fractal, Wavelet Features, Cubic Spline1. Introduction
Texture is an important characteristic for analysis of many types of images. It is presented in many real as well as synthetic data (e.g.; clouds, trees, bricks, hair, fabric, etc). Despite its importance and ubiquity in image data, still a formal approach or definition of texture analysis does not exist [1]. Also, there is no formal definition of texture exists; different people define the texture depending upon the particular application. Some are perceptually motivated and others are driven completely by the application in which the definition will be used [2].
One immediate application of image texture analysis is the recognition of image regions using texture properties. Texture in this sense forms an important visual cue in identifying various types of homogeneous regions; this is known as texture classification. The goal of texture classification is to produce a classification map of the input image where each uniform textured region is identified with the texture class to which it belongs [2].
Texture classification techniques are grouped into five main groups, in general, namely:(i) structural,(ii) statistical,
(iii) signal processing, (iv) model-based stochastic and (v) morphology-based methods [3]. Most of them consist of two successive stages: feature extraction and feature-based classification [4]. For classification purpose different sets of texture features are obtained using different measures; and each can be used individually or in combination with each other.
1.1. Wavelet
Signal wavelet decomposition using Discrete Wavelet Transform (DWT) provides an alternative to the Discrete Fourier Transform (DFT) for signal analysis resulting in signal decomposition into two-dimensional functions of time and scale. The main benefit of DWT over DFT is in its multi-resolution time-scale analysis ability [5].
Haar wavelet transform (HWT) is the simplest decomposition process. For a specific image signal matrix (x) of the form
= (1)
y = (2)
These operations correspond to the following filtering processes:
LL: Top left: 2-D lowpass filter (Lo-Lo),
HL: Top right: horizontal highpass and vertical lowpass filter (Hi-Lo),
LH: Lower left: horizontal lowpass and vertical highpass filter (Lo-Hi),
HH: Lower right: 2-D highpass filter (Hi-Hi).
To apply this transform on the complete image, we group the pixels into 2×2 blocks and then apply Equation (1) on each block [6]. The LL-subband output from any stage can be decomposed further. Figure 1 below shows the result of one and two levels HWT based on the pyramid decomposition [7].
Wavelet transform had been very popularly used for classification. It is often used together with other methods to create a process that can best identify the required features [8]. Tou, Tay, and Lau [9] gave a review for the recent trends in texture classification and they showed that the information on the frequency domain is usually more stable than the spatial domain. Therefore, they often produce better features that lead to a higher accuracy despite being more complex and slower.
Fig 1. Pyramid decomposition using Haar wavelet filter
1.2. Fractal
Fractal dimension has the ability of distinguish texture by its roughness, different fractal texture classification and segmentation algorithms proposed during the last decades for many applications [4, 8, 10-15].
Several fractal models have been used to estimate the fractal dimension [16-21]. Differential Box Counting (DBC) method is one of the most popular methods that has been used widely to calculate the fractal dimension of images. Long and Peng [22] showed that, most of the existing box-counting methods for measuring fractal features are only applicable to square images or images with each dimension equal to the power of 2 and they require that the box at the top of the box stack of each image block is of the same height as that of other boxes in the same stack, which gives rise to inaccurate estimation of fractal dimension. They propose a more accurate box-counting method for images of arbitrary size, which allows the height of the box at the top of each grid block to be adaptable to the maximum and minimum gray-scales of that block so as to circumvent the
common limitations of existing box-counting methods.
1.3. Cubic Spline
Cubic Spline method relies on constructing a smooth polynomial surface of low degree between small set of known data points. The spline consists of weights attached to a flat surface at the points to be connected [23-24]. This technique is used widely in image processing for interpolating and resampling images.
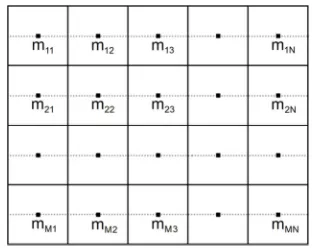
Practically, the image is divided into MxN blocks, each of size bxb, where b is an odd number. Then:
1.For each row of blocks the centers of the blocks (mi1, mi2,… miN) are used to construct the cubic splines which
are used to approximate the gray level of the pixels among these centers.
2.Backward interpolation is used to approximate the gray level of the pixels between the left border and the first center in the line (mi1).
3.Forward interpolation is used to approximate the gray level of the pixels between the last center in the line (miN) and the right border.
4.Steps 1, 2, and 3 are repeated for each line of blocks to get M centerline with known gray level value; see Figure 2.
5.Steps 1, 2, 3, and 4 are repeated to each column of pixels until the whole image are interpolated.
Fig 2. Image's blocked used for Cubic Spline interpolation
2. Features Extraction
Two set of features have been proposed to do classification of the images. The first classification feature set consists of the fractal dimensions of the multi-scale wavelet transform of the original image. While the second feature set consists of the fractal dimensions of the multi-scale wavelet transform of both the smooth and rough image components which are produced by decomposing the image signal into the smooth cubic spline surface and rough residue components.
2.1. Fractal–Wavelet Feature Set
= , , , ,
(2)
, , ,
So, F1 consists of 8 values which represent the roughness
of the texture at different frequencies and scales.
Fig 3. Fractal – wavelet technique
2.2. Rough – Smooth Technique
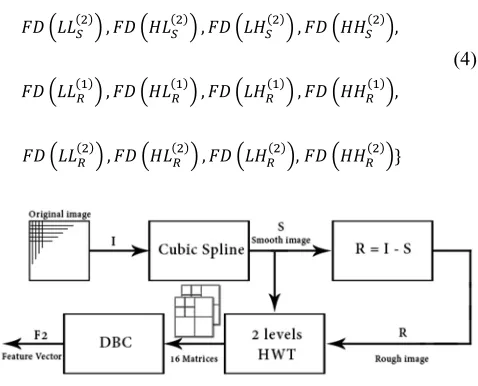
Figure 4 illustrates the scheme of determining the second feature set. Firstly, the cubic spline is applied on the original image, I(), to establish the smooth image component S(); then by subtracting the smooth image from the original one we will get the rough component R(), i.e.:
R(x,y) = S(x,y) – I(x,y) for ∀ , (3) The rough image component R() contains all the coarse information of the texture image.
The 2D HWT is applied, separately, on both the smooth and the rough images to construct 16 matrices. Then the fractal dimension is calculated for each one of them using the DBC method suggested by Long and Peng [22]; to construct the feature vector F2; so it consists of 16 features:
= , , , ,
(4)
, , , ,
, , , ,
, , ,
Fig 4. Rough – Smooth technique
3. Classifications
Classification is normally a two phase process. It requires an initial training phase during which the classifier is trained to recognize a class of reference feature vectors, and a testing (classification) phase during which unknown vectors are
classified according to a best match criterion, see Figure 5.
Fig 5. Training and classification phases
During the training phase, three templates are constructed for each class to cope over the variability of the images in each class. The conducted experiments showed that using one or two templates may not always enough for efficient classification. In this paper, three initial templates have been chosen as: (i) !" , which is the mean feature vector of all the feature vectors extracted from the training samples belong to the class, (ii) !" , the farthest feature vector to !" , and (iii)
!"#, the farthest feature vector to both IC1 and !" . Then the
K-means algorithm is used to improve the values of these initial templates [25].
Commonly, Euclidean distance measure is used to match the similarity. But, one weakness of the basic Euclidean distance function is that if one of the input features has a relatively large range, then it can overpower the other features. Since the problem here is the used features are not isotropic; that is, every feature may not have similar behaviors. So, the normalized Euclidean distance has been used to evaluate the similarity degree between the extracted feature vector of the tested sample, and the templates representing certain class [26]:
$%, & = ∑ ()*+,)- .
/)
0
12 (5)
where $1% is the template value of kth feature that belong to ith
class; 1&is the value of kth feature extracted from jth sample;
31 is the standard deviation over the sample set.
As mentioned above, the matching process uses three templates per class, in order to maximize the probability of true match classification and minimize the misclassification. The efficiency of classification is calculated for each distance using the following equation [1]:
4 % =(6789 :6.6< =8>?9@=+A6.6< >%=B98==%<%@C =8>?9@=(6789 :6.6< =8>?9@= D 100% (6)
4. Experimental Results
first dataset is that used by Al-Momen, George, and Naji [25], which consists of different types of woven fabrics as shown in Figure 6. Twenty two different texture images having size of 512 x 512 with 8-bit grey levels were selected to define twenty two classes. While the second dataset is that used by Al-Kadi [10], consists of eight classes as shown in Figure 7.
For each dataset, each image defines a separate class; and
it was divided into 225 images of size 64 x 64 with 50% overlapping. Fifty randomly chosen samples from each class were used for training, while the rest 175 samples have been used for testing the classifier. The conducted tests have been directed toward finding to which class the query image belongs.
Fig 6. Dataset #1:Twenty two different Brotdatz texture showing up to bottom and from left to right: D11, D14, D16, D17, D18, D20, D21, D49, D50, D52,
D53, D55, D56, D65, D76, D77, D78, D79, D82, D84, D104 and D105.
Fig 7. Dataset #2: Eight different Brodatz texture images showing from up to bottom and from left to right: herringbone cloth (D16), canvas (D20), coffee beans (D74), calf leather (D24), fur (D93), quartz (D98), cheese cloth (D106) and plastic bubbles (D112).
Table 1 shows the percentage of correctly classified samples of all the tested samples for dataset #1 under the use of the fractal – wavelet technique (F1), the rough–smooth
technique (F2), and the two features sets together {F1, F2}.
While, Table 2 shows the same results for the eight classes of
dataset #2.
By using the two features sets together, i.e. {F1, F2}, the
overall classification for dataset #1 is slightly lower than that obtained by Al-Momen, George, and Naji [25], but it is higher than that obtained by Al-Kadi [10].
Table 1. The percentage of correctly classified samples under F1, F2, and {F1,F2} for dataset #1
Class no.
Class Name
Fractal – Wavelet Technique F1 Rough –Smooth Technique F2
The two techniques together {F1, F2}
Training Testing Training Testing Training Testing
01 D11 98 91.4286 100 97.1429 100 99.4286
02 D14 92 84 100 94.8571 100 98.2857
03 D16 100 100 86 100 100 100
04 D17 100 100 98 98.8571 100 100
05 D18 90 86.2857 100 86.8571 98 91.4286
06 D20 100 99.4286 100 96.5714 100 100
07 D21 100 100 90 99.4286 100 100
08 D49 100 100 98 100 100 100
09 D50 84 76.5714 92 71.4286 90 87.4286
10 D52 100 97.7143 100 100 100 100
Class no.
Class Name
Fractal – Wavelet Technique F1 Rough –Smooth Technique F2
The two techniques together {F1, F2}
Training Testing Training Testing Training Testing
12 D55 88 90.8571 100 91.4286 98 97.1429
13 D56 98 95.4286 100 87.4286 98 98.8571
14 D65 100 96 98 92.5714 100 100
15 D76 98 95.4286 92 89.7143 100 97.1429
16 D77 100 100 100 100 100 100
17 D78 94 96.5714 100 97.7143 96 98.8571
18 D79 100 98.8571 100 98.2857 100 99.4286
19 D82 100 99.4286 86 98.2857 100 100
20 D84 82 89.7143 98 86.2857 96 97.1429
21 D104 100 94.8571 100 97.7143 100 98.8571
22 D105 100 100 100 100 100 100
Overall 96.5455 95.0390 96.7273 94.7273 98.9091 98.3117
Table 2. The percentage of correctly classified samples under F1, F2, and {F1,F2} for dataset #2
Class no.
Class name
Fractal – Wavelet Technique F1 Rough –Smooth Technique F2 The two techniques together {F1, F2}
Training Testing Training Testing Training Testing
01 D16 100 99.4286 100 100 100 100
02 D20 100 99.4286 100 100 100 99.4286
03 D74 100 100 94 97.7143 100 100
04 D24 98 96 94 83.4286 100 97.7143
05 D93 98 95.4286 96 95.4286 100 100
06 D98 98 93.7143 94 78.2857 96 91.4286
07 D106 98 100 100 97.7143 100 100
08 D112 92 94.2857 98 93.7143 100 98.8571
Overall 98 97.2857 97 93.2857 99.5 98.4286
5. Conclusion
In this paper, the fractal based features are extracted from the 2-level decompositions of the original image, in addition to that of the rough and smooth images produced by the cubic spline method. The combined features improved the overall classification accuracy.
The experimental results showed the suitability of the proposed system for the texture with or without directional properties.
References
[1] Bhiwani, R. J.; Khan, M. A.; Agrawal, S. M.; "Texture Based Pattern Classification", International Journal of Computer Applications, Vol. 1, No. 1, Pp. 54-56, 2010.
[2] [2] Chen, C. H.; Pau, L. F.; and Wang, P. S. P.; "The Handbook of Pattern Recognition and Computer Vision", Second Edition, Pp. 207-248, World Scientific Publishing Co., 1998.
[3] Prasad, P. S.; Varma, V. T.; Harish, V. S.; and Kumar, K. S.; "Classification of Different Textures Using SVM and Fuzzy logic", International Journal of Advanced Computer Research, Vol. 2, No. 4, Issue 6, Pp. 463-466, December 2012.
[4] Ling, L.; Ming, L.; and YuMing, L.; "Texture Classification and Segmentation Based on Bi-dimensional Empirical Mode Decomposition and Fractal Dimension", First International
Workshop on Education Technology and Computer Science, Vol. 2, Pp. 547-577, 2009.
[5] Procházka, A.; Mareš, J.; Yadollahi, M.; and Vyšata, O.; "Biomedical Image Enhancement, Segmentation and Classification Using Wavelet Transform", WSEAS International Conference on Systems; Pp. 160-165, 2012. [6] Gavlasová, A.; Procházka, A.; and Mudrova, M.; "Wavelet
Based Image Segmentation", In Proc. of the 14th Annual Conference Technical Computing, Prague, 2006.
[7] Gonzalez, R. C.; Woods, R. E.; and Eddins, S. L.; "Digital Image Processing Using MATLAB", Second Edition, Gatesmark Publishing, 2009.
[8] Wang, L.; Deng, Z.; and Wang X.; "Application of Wavelet Transform Method for Textile Material Feature Extraction", Wavelet Transforms and their Recent Applications in Biology and Geoscience, Edited by Dr. Dumitru Baleanu, InTech Europe, Pp. 207-224, 2012.
[9] Tou, J. Y.; Tay, Y. H.; and Lau, P. Y.; "Recent Trends in Texture Classification: A Review", Symposium on Progress in Information & Communication Technology, 2009.
[10] Al-Kadi, O. S.; "Combined Statistical and Model Based Texture Features for Improved Image Classification", In: 4th International Conference on Advances in Medical, Signal & Information Processing, Santa Margherita Ligrue, Italy, 14-16 July 2008.
[12] Kang, T. J.; Kim, S. C.; Sul, I. H.; Youn, J. R.; and Chung, K.; "Fabric Surface Roughness Evaluation Using Wavelet-Fractal Method, Part I: Wrinkle, Smoothness and Seam Pucker", Textile Research Journal, Vol. 75, No. 11, Pp. 751-760, November 2005.
[13] Kaplan, L. M.; "Extended Fractal Analysis for Texture Classification and Segmentation", IEEE Transactions on Image Processing, Vol. 8, No. 11, Pp.1572-1585, November 1999.
[14] Changjiang, S.; Guangrong, J.; and Yangfan, W.; "Study of Texture Images Classification Method Based on Fractal Dimension Calculation", International Joint Conference on Artificial Intelligence, 2009.
[15] Xu, Y.; Quan,Y.; Ling, H.; and Ji, H.; "Dynamic Texture Classification Using Dynamic Fractal Analysis", IEEE International Conference on Computer Vision, Pp. 1219-1226, 2011.
[16] Liu, S.; "An Improved Differential Box-Counting Approach to Compute Fractal Dimension of Gray-Level Image", International Symposium on Information Science and Engineering, 2008.
[17] Yinglei, C.; Jida, S.; Hua, J.; and Xiaochun, L.; "A Method of Calculating Image Fractal Dimension Based on Fractal Brownian Model", International Forum on Information Technology and Applications, 2010.
[18] Li, F.; Gong, W.; Li, Y.; Liang, Y.; and Wang, X.; "Research of Fractal Dimension Calculation Algorithm Based on Mobile Box-Counting Method", Seventh International Conference on Natural Computation, 2011.
[19] Abiyev, R.; and Kilic, K. I.; "An Efficient Fractal Measure for Image Texture Recognition", Fifth International Conference on Soft Computing, Computing with Words and Perceptions in System Analysis, Decision and Control, 2009. ICSCCW 2009.
[20] Blachowski, A.; and Ruebenbauer, K.; "Roughness Method to Estimate Fractal Dimension", ACTA Physica Polonica A, Vol. 115, No. 3, Pp. 636-640, 2009.
[21] Lopes, R.; Betrouni, N.; "Fractal and Multifractal Analysis: A Review", Medical Image Analysis, Vol. 13, Pp. 634-649, 2009. [22] Long, M.; and Peng, F.; "A Box-Counting Method with
Adaptable Box Height for Measuring the Fractal Feature of Images"; Radio Engineering, Vol. 22, No. 1, Pp. 208-213, April 2013.
[23] Agrawal, A.; Shah, A.; and Bharti, R.; "Optimization of PSNR of Zooming Image using Cubic Spline Interpolation Method", International Journal of Engineering and Technical Research (IJETR), Vol. 2, Issue 6, Pp. 220-221, June 2014.
[24] Chitode, J. S.; "Numerical Methods", Technical Publication Pune, 2011.
[25] Al-Momen, S.; George, L.; Naji, R.; "The use of Gradient Based Features for Woven Fabric Images Classification", British Journal of Mathematics and Computer Science, Vol. 6, Issue 1, Pp. 68-78, 2015.
[26] Commowick, O.; Lenglet, C.; and Louchet, C.; "Wavelet Based Texture Classification and Retrieval", Ecole Normale Superieure de Cachan, 2003.