Article
1
Microencapsulation and Characterization of Natural
2
Polyphenols from PHF Extract
3
Syed Ammar Hussain 1, †, Ahsan Hameed 1, †, Yusuf Nazir 1, Tahira Naz 1, Yang Wu1, Hafiz Ansar
4
Rasul Suleria 2,3,4*and Yuanda Song 1,*
5
1 Colin Ratledge Center for Microbial Lipids, School of Agriculture Engineering and Food Science,
6
Shandong University of Technology, Zibo 255049, China; [email protected] (S.A.H),
7
[email protected] (A.H.); [email protected] (Y.N.); [email protected] (T.N);
8
[email protected] (Y.W.)
9
2 UQ Diamantina Institute, Translational Research Institute, Faculty of Medicine, The University of
10
Queensland, 37 Kent Street Woolloongabba, Brisbane, QLD 4102, Australia
11
3 Department of Food, Nutrition, Dietetics and Health, Kansas State University, Manhattan, KS 66506, USA
12
4 Centre for Chemistry and Biotechnology, School of Life and Environmental Sciences, Deakin University,
13
Pigdons Road, Waurn Ponds, Victoria 3216, Australia
14
* Correspondence: [email protected] (H.A.R.S.); [email protected] (Y.S.); Tel.: +61-470-439-670
15
(H.A.R.S.); +86-139-06174047 (Y.S.)
16
† These authors contributed equally to this work.
17
18
Abstract: Microencapsulation of polyherbal formulation (PHF) extract was carried out by freeze
19
drying method, by employing gum arabic (GA), gelatin (GE), and maltodextrin (MD) with their
20
designated different combinations as encapsulating wall materials. Antioxidant components (i.e
21
total phenolic contents (TPC),Total flavonoids contents (TFC), and total condensed contents (TCT)),
22
antioxidant activity (i.e. DPPH, β-carotene & ABTS+ assays), moisture contents, water activity (aw),
23
solubility, hygroscopicity, glass transition temperature (Tg), particle size, morphology, in vitro
24
alpha-amylase and alpha-glucosidase inhibition and bioavailability ratios of the powders were
25
investigated. Amongst all encapsulated products, TB (5% GA and 5% MD) and TC (10% GA) has
26
proven to be the best treatments with respect to the highest preservation of antioxidant components
27
and their antioxidant potential by DPPH and β-carotene assays and noteworthy for an ABTS+ assays,
28
in addition, the aforesaid treatments also demonstrated lower moisture content, aw, particle size
29
and higher solubility, hygroscopicity and glass transition temperature (Tg). All freeze dried samples
30
showed irregular (asymmetrical) microcrystalline structures. Furthermore, TB and TC also illustrated
31
the highest in vitro anti-diabetic potential due to great potency for inhibiting alpha-amylase and
32
alpha-glucosidase activities. In the perspective of bioavailability, TA, TB and TC demonstrated the
33
excellent bioavailability ratios (%).Futhermore, the phytochemo-profiling of ethanolic extract of
34
PHF was also revealed to find out the bioactive compounds.
35
KeyWords: Microencapsulation; polyphenols; freeze-drying; antioxidant activity; in vitro
36
dialyzability; in vitro anti-diabetic potential.
37
38
1. Introduction
39
Diabetes mellitus (DM) is the endocrine metabolic disorder characterized by increased blood
40
glucose level coupled with abnormality in protein, carbohydrate and fat metabolism. It has become
41
major disorder which affected 346 million people worldwide and this number is expected to be
42
double by the year of 2030[1, 2]. It is such a progressive endocrine disorder of glucose metabolism
43
that eventually leads to micro- and macro-vascular changes causing secondary complications that are
44
incredibly challenging to manage [3]. Clinically, DM can be categorized into two types; Type-I DM,
45
arisen due to the inadequate synthesis of insulin by -cells of the pancreas and featured with
46
complications i.e. diabetic retinopathy, neurodegenerative, kidney-related issues etc. it is an
insulin-47
dependent DM, whereas, type-II DM; (i.e. non-insulin-dependent) is primarily characterized by
48
insulin resistance (i.e. a condition in which peripheral cells do not respond normally to insulin) or
-49
cell dysfunction which eventually leads to diabetes-associated cardiovascular (CVD) and fatty liver
50
disease [4]. Diverse and multifaceted factors have played pivotal role for onset and progression of
51
DM, including unhealthy foods, auto-immune disorders, ecological factors and miscellaneous
52
variables [5-8]. However, “oxidative stress”, the ultimate outcome of reactive oxygen species (ROS)
53
and nitrogen oxide (NO), has been considered as one of the predominant factors as reported by
54
many studies [9-11].
55
To manage these ROSs, all living cells have intrinsic antioxidant manufacturing system, which
56
might helpful to retain the redox condition of the body at cellular and sub-cellular level by
57
neutralizing the reactive oxygen species (ROSs). The loss in balance between the free radical
58
production i.e. high ROSs production and biological system’s ability to produce endogenous
59
antioxidants can lead to a aforementioned health-related disease called “oxidative stress” [12]. The
60
excess production of these ROSs are considered lethal for human health as their surplus generation
61
can leads to different patho-physiological conditions like fast aging process via damaging the nucleic
62
acids and changing in the conformation of proteins, heart-related disorders (i.e. CVDs), diverse types
63
of cancers, immunity related dysfunctions, inflammation, membranous lipid oxidation, decline of
64
hydroperoxide synthesis, neurodegenerative disorders, lungs and kidney illness, UV- irradiation,
65
and osteoporosis/ bone- related diseases. Direct correlation between oxidative stress and insulin
66
resistance (key factor for type-II DM) has been elaborated in mini review by Hurrle et al. [13].
67
Nowadays, research has been focused in exploring naturally occurring antioxidants to
68
circumvent the complexities due to oxidative stress. Diverse types of herbs, spices, teas, flowers,
69
seeds, fruits, vegetables and marine foods are now considered for the expected antioxidant excellent
70
sources to replace synthetic antioxidants [14-16]. Amongst naturally-occurring antioxidants,
71
polyphenols and their derivative compounds represented a diverse class of ubiquitous material i.e.
72
from simple molecules to complex configuration such as phenolic acids; hydroxybenzoic and
73
hydroxycinnamic acids, hydrolyzable and condensed tannins, and flavonoids, these are most
74
important compounds for nutraceutical, therapeutics and pharmacological point of view [14, 17] and
75
revealed various health endorsing activities: antioxidant activity via free radicals scavenging,
76
declining of hydroperoxide development, hampering the lipid oxidation, anti-diabetic, anti-malarial,
77
anticancer activity etc [14, 15].
78
Recently, polyherbal formulations (PHF)/ herbal nutraceuticals are considered as a great source
79
of natural polyphenols all over the globe due to their dynamic medicinal and therapeutic claims.
80
Previous investigations illustrated that selected individual plants contained abundant quantity
81
of polyphenols and their herbal combinations were found to produce best antioxidant activity among
82
all individual extracts due to synergistic effect. Synergism played a vital role via two different kind
83
of mechanism in context of interaction i.e., pharmacokinetic (PK) and pharmacodynamics (PD) [18].
84
In the provisions of pharmacokinetic synergism, capacity of herbs/plant to aid in the absorption,
85
delivery, metabolism and elimination of the other herbs from the body was overlooked. Whilst in
86
pharmacodynamic synergism mechanism, assessment the synergistic effect when active components
87
with analogous therapeutic prospective are targeted to an interrelated physiological
88
structure/receptor. Here, combination of herbs may work on multiple targets at the same time to offer
89
a comprehensive relief [19]. Owing to synergism, polyherbal formulation (PHF) demonstrated vast
90
advantages over single herbal formulation (SHF) likewise: superior restorative effect can be attained
91
with a polyherbal formulation (PHF); to acquire enviable pharmacological accomplishment low
92
dosage would be required, consequently lessening the risk of harmful side effects. Additionally, PHF
93
facilitate the patient’s convenience by eradicating the need of taking more than one formulation at a
94
time, which ultimately leads to better compliance and therapeutic effect. All the aforesaid advantages
95
have outcome in the attractiveness of PHF in the marketplace when compare to SHF [20].
Polyphenols are incredibly sensitive in diverse range of circumstances, during food processing
97
and storage practice likewise; high temperature of surrounding, incidence of oxygen and light, pH,
98
existence of oxidative enzymes, moisture contents [21]. The degradation of natural antioxidants may
99
hamper the possible effectiveness of application of these antioxidants in food /nutraceutical and
100
pharmaceutical applications and commercially available anti-diabetic drugs also produce
101
unconstructive effects on other metabolisms [22], so supplementation of anti-hyperglycemic
102
substances, which also possess antioxidant properties, might be an alternative therapy to overcome
103
this critical condition [23, 24]. To address these shortcomings and to augment the antioxidant stability
104
and preserve their diverse bioactivities including inflammatory, cancer, microbial,
anti-105
diabetic capabilities, the microencapsulation has been employed successfully as a reliable technique
106
to circumvent the unwanted degradation of bioactive compounds, shielding them from adverse
107
environmental circumstances. Furthermore, various type of wall material has been used for
108
microencapsulation procedure, but cost effectiveness and physico-chemical distinctiveness must be
109
considered, including: hygroscopicity, biodegradability, emulsifying feature, adaptability to
110
gastrointestinal tract (GT), viscosity, solids content [25].
111
At present, the preferred wall materials for microencapsulation for various fruit juices and
112
plant/herbs extracts are maltodextrins (MD), gum arabic (GA) and gelatin (GE) [26]. Maltodextrin of
113
various dextrose equivalents (DE) are generally used as wall material owing to their distinct
114
characteristics likewise; low viscosity, high solubility in water and their solutions are monochromic
115
in appearances. These features made them frequently used carrier/wall materials in the
micro-116
encapsulation procedure. Gum Arabic (GA) (exudates of acacia), owing to its unique features i.e.
117
naturally colorless, low viscosity, high retention of volatiles and ability to make stable emulsion is
118
ultimately considered as excellent encapsulating agent whereas its high economic cost provoked
119
researcher for full or partial replacement of the encapsulation agent [26-28]. In addition, gelatin
120
(GE), is also a better option for microencapsulation because of its superior characteristics for
121
emulsification, film-formation, water solubility, last but not least ability to form finer dense complex.
122
According to Fang and Bhandari [29], a sole microencapsulating agent has limitation over all required
123
attributes to improve microencapsulation effectiveness, eventually has been resolved by using
124
different combination of polymers due to their diverse features. The selection for polymer’s
125
combinations which possibly consequence in superior microencapsulating efficiency and regarded
126
economically suitable than the single biopolymers has been becoming the point of emerging interest
127
[29, 30].
128
In the current study, polyherbal formulation (PHF) was firstly made with equal ratio of roots of
155
Chlorophytum borivilianum, roots of Astragalus membranaceus, roots of Eurycoma longifolia, and seeds of
156
Hygrophila spinosa T. Anders having previously proven diverse ethno-pharmacological applications
157
[31-34] as polyphenols enriched nutrient supplement, then PHF extract was further
158
microencapsulated by freeze drying method using different wall materials, subsequently antioxidant
159
components (i.e. TPC, TFC, and TCT), antioxidant activity (i.e. DPPH, β-carotene &ABTS+ assays),
160
anti-diabetic potential (i.e.in vitro alpha-amylase and alpha-glucosidase inhibition) physical property
161
like; moisture contents, water activity (aw), solubility, hygroscopicity, glass transition temperature
162
(Tg), morphological characteristics (i.e. particle size, morphology), and bioavailability ratios of the
163
microencapsulated powders were investigated. In last, the chemo-profiling for ethanolic extract of
164
PHF was also studied.
165
2. Materials and Methods
166
2.1. Materials, chemicals, reagents and encapsulating agents
167
All different parts of herbs (detail in Section 3.2) were purchased from Faisalabad-Pakistan and
168
their identification and respective characteristics were authenticated by Prof. M. Jafar Jaskani from
169
Institute of Horticulture, University of Agriculture Faisalabad (UAF) Pakistan. All chemicals used
170
were of analytical grade or higher where suitable. DPPH (2, 2-diphenyl-1-picryl-hydrazyl),
Foline-171
Ciocalteu (FC), β-carotene, Butylated hydroxyltoluene (BHT), TWEEN 20, quercetin, Sodium
carbonate, ABTS (2, 20-azinobis (3-ethylbenzothiazoline-6-sulphonic acid), α-tocopherol, Linoleic
173
acid, (+)-catachin, quercetin, AlCl3.6H2O, HCl, Vanilline, NaOH, Potassium persulfate, Trolox,
174
gallic acid were purchased from Sigma-Aldrich GmbH (Sternheim, Germany). Alpha-amylase
175
fromporcine pancreas, alpha-glucosidase fromSaccharomyces cerevisiae,
paranitrophenyl-176
glucopyranoside, pepsin (porcine-7000), bile salts pancreatin (p-1750), piperazine-NN-bis
(2-ethane-177
sulfonic acid) di-sodium salt (PIPES), gelatin (GE), HPLC-grade methanol, acetonitrile ethanol,
178
acetone were supplied by Sigma-Aldrich (USA), soluble starch (extra pure) was obtained from J. T.
179
Baker Inc., Phillipsburg, USA. Ultra-pure water (18 MΩ cm−1) was acquired from Milli–Q
180
purification device (Millipore Co. USA). Sodium hydrogen carbonate was purchased from Merck
181
(Germany). Sea sand was of 200-300 grain size from Scharlau (Barcelona, Spain). The encapsulating
182
agents were: gum arabic (GA) (Sangon Biotech, Co. China), maltodextrin (MD) (Dextrose equivalent
183
of 12) was purchased from Corn Products (Cabo de Santo Agostinho, Pernambuco, Brazil)
184
2.2. Polyherbal formulation (PHF)
185
Polyherbal formulation (PHF) was made by combining the root of Chlorophytum borivilianum
186
roots of Astragalus membranaceus, roots of Eurycoma longifolia, and seeds of Hygrophila spinosa T.
187
Anders, in a ratio of 1:1:1:1 respectively.
188
2.3. Preparation of sample
189
Firstly, the roots and seeds of aforesaid herbs were cut into small pieces, followed by thorough
190
washing with deionized water in order to avoid any contamination. The PHF material was then dried
191
for 12 days in dark in well ventilated room at room temperature (23±8), and subsequently grounded
192
with mortar and pestle to make crude powder with the help of liquid nitrogen, until a uniform sieve
193
size equivalent to (1.0 mm) was achieved. The resulting powder was stored at -80°C in inert vacuum
194
bags until used for extraction as followed.
195
2.4. Pressurized liquid extraction (PLEx)
196
PLEx was executed in a Dionex ASE 350 system (Dionex, Sunnyvale, CA) with the powder of
197
PHF obtainedas mentioned above. Aliquot of 5.0g of powder of PHF was mixed with diatomaceous
198
earth (1/1) and placed in a 34mL stainless–steel cells. The extraction was performed via 3
199
consecutively applied steps with absolute solvents of increasing polarity, in order to get the
200
maximum possible number and amount of secondary metabolites of various polarities and
201
miscibilities, namely, acetone, ethanol, methanol and their aqueous mixtures with water (1:10, 3:10),
202
and pure water. Extraction time was of 22 minutes; pressure 10.6 MPa; temperature 75 °C (for
203
acetone, ethanol and methanol) and 135 °C (for water). Organic solvents were removed in a rotary
204
vacuum evaporator at 38 °C, while the residual water was removed in a freeze drying unit. The
205
extracts after solvent evaporation were placed under nitrogen flow for 20 min and stored in dark
206
glass bottles at −80 °C until analyzed.
207
2.5. Development of microencapsulated powder products
208
In order to prepare the particular dispersions, 100mL of PHF aqueous extract was mixed
209
individually with different preselected combination of microencapsulating wall materials as follow:
210
A (5% GA and 5% GE) (hereafter referred and discussed as TA); B (5% GA and 5% GE) (hereafter
211
referred and discussed as TB), C (10% of GA)(hereafter referred and discussed as TC), and D (10% of
212
MD) (hereafter referred and discussed as TD),under constant shaking with 220 rpm, at 35°C for 30
213
min by a shaking unit (Shanghai, CIMO). Afterward, these dispersions/emulsions were
214
microencapsulated through lyophilization process for formulating four distinctive treatments. i.e. TA,
215
TB, TC, TD.
216
For microencapsulation by means of freeze-drying process, the above-mentioned
217
dispersions/emulsions were kept at −20°C (freezer) for 48 h. Subsequently, the samples were placed
218
in lyophilization unit (Labconco, Germany) for freeze drying at −56.5°C, with vacuum pressure of
20µmHg for 60 h. After the completion of freeze drying process, the samples were crushed utilizing
220
a mortar and pestle assembly. Finally, the desirable final microencapsulated products were sealed in
221
polyethylene bags and aluminum pouches as well and stored in desiccator encompassing silica until
222
further analysis.
223
2.6. Determination of bioactive compounds and their bioactivities after microencapsulation
224
Bioactive components which were determined after the microencapsulation were total phenolic
225
compounds (TPC), total flavonoids compounds (TFC), total condensed tannins (TCT). While the
226
bioactivities of the microencapsulated powders were measured in terms of total antioxidant activity
227
determined by β-carotene bleaching assay (TOAA), ABTS+ radical scavenging activity, and DPPH
228
scavenging capacity. All these spectrophotometric analysis were performed according to previously
229
developed methods with minor alteration [16, 35, 36]. The results for ABTS+ radical scavenging
230
activity are deliberated as EC50 values (mg of extract/mL) for comparison. Effectiveness of antioxidant
231
properties is inversely correlated with EC50 value.
232
2.7. Determination of the physical properties of the microencapsulated powders
233
2.7.1 Moisture content
234
The moisture contents of the microencapsulated products were estimated by using the method
235
describes in manual AOAC [37], i.e. by calculating the loss of sample after weight after heat up at
236
1050C.
237
2.7.2 Water activity (Aw)
238
The water activity (Aw) of all lyophilized samples was calculated through the direct analysis in
239
electronic meter (Aqualab Dew Point 4TEV, USA), to gain the constant state the samples were firstly
240
placed at 25°C for at least 15 mints.
241
2.7.3 Solubility
242
The solubility of microencapsulated products was measured by the method described by
Cano-243
Chauca et al. [38], with minute alterations. The sample’s quantity of 1.0g was mixed up with 100mL
244
distilledwater in beaker and stirred with magnetic stirrer(MS-H-S10) for 20mints. After that the
245
centrifugation of solution carried out at 3000×g (Thermo Scientific) for10mints. The quantity of 25mL
246
of the supernatant was transferredto a petriplates (pre-weighted) and dried in oven at 1050C for 4.0
247
h.The solubility was measured as a result of weight difference and demonstrated in the term of
248
percentage (%).
249
2.7.4 Hygroscopicity
250
For the estimation of the hygroscopicity, the encapsulated powder of 1.0 g was placed in
251
dessicator with saturated NaCl solution (74.6%) at temperature of 250C. After 1 week, samples were
252
weighed and hygroscopicity was represented in the term of percentage (%) [39].
253
2.7.5 Glass transition temperature (Tg)
254
The glass transition temperature (Tg) of the microencapsulated products was calculated by
255
means of differential scanning calorimetry (DSC) (DSC-2000-New Castle, DE). The weight of 7-8mg
256
of sample was placed in aluminum hermetic pots. For the reference purpose, a aluminum pan
257
without sample was used. Ultra-pure nitrogen N2 was used as purge gas (flow rate 50 mL/min). The
258
temperature ranged from -80 0C to 120 0C at a heating rate of 40 0C/ min. The glass transition
259
temperature was determined by utilizing software of TA Universal Analysis 2000.
2.8. Morphology and size distribution
262
The configuration of micro-particles obtained from diverse encapsulating wall material and their
263
combinations were examined by scanning electron microscope (Quanta 250 EFI). At first, very minute
264
was fixed on surface of double sided tape of carbon then finally evaluated the samples under
265
microscope with 400 X magnification. The analysis for particle size distribution average and particle
266
size was conducted by the means of ImageJ (NIH, Bethesda, MD).
267
2.9. In vitro Assays
268
2.9.1. Alpha-Amylase Inhibition Assay
269
The inhibition of alpha-amylase was determined using an assay modified from the Worthington
270
Enzyme Manual [40]. Aliquot 0 - 4 mg/ml in DMSO (v/v 1:1) of each encapsulated PHF samples was
271
prepared and 500 µl of each sample were mixed with 500 µl of 0.02 M sodium phosphate buffer (pH
272
6.9) containing α-amylase solution (0.5 mg/ml) and incubated at 25°C for 10min. After pre-incubation,
273
500 µl of a 1% starch solution in 0.02 M sodium phosphate buffer (pH 6.9) was added to each tube at
274
timed intervals. The reaction mixtures were then incubated at 25°C for 10 min. The reaction was
275
stopped with 1.0 ml of dinitrosalicylic acid colour reagent. The test tubes were then incubated in a
276
boiling water bath for 5 min and cooled to room temperature. The reaction mixture was then diluted
277
by adding 15 ml of distilled water, and the absorbance was measured at 540 nm using a micro-plate
278
reader (Thermomax, Molecular device Co., Virginia, USA). The experiments were performed in
279
duplicate and the absorbance of sample blanks (buffer instead of enzyme solution) and a control
280
(buffer in place of sample extract) were also recorded. The absorbance of the final each encapsulated
281
PHF sample was obtained by subtracting its corresponding sample blank reading. Acarbose was
282
prepared in distilled water and used as positive controls
283
The percentage inhibition was calculated using the formula;
284
% Inhibition = {(Ac – Ae)/Ac} 100
285
Where Ac and Ae are the absorbance of the control and extract, respectively
286
IC50 values (inhibitor concentration at which 50% inhibition of the enzyme activity occurs) of
287
each encapsulated PHF samples was prepared were determined by plotting graph with varying
288
concentrations of the plant extracts against the percent inhibition.
289
2.9.2. Alpha-Glucosidase Inhibition Assay
290
The alpha-glucosidase was assayed using a method modified by Apostolidis et al. [41]. Aliquot
291
of 0 - 4 mg/ml in DMSO (v/v 1:1) of each encapsulated PHF samples were prepared. 50 µl of each
292
concentration sample was mixed well with 100 µl of 0.1 M phosphate buffer (pH 6.9) containing
α-293
glucosidase solution (1.0 U/ml) and the mixtures were then incubated in 96-well plates at 25°C for 10
294
min. After pre-incubation, 50 µl of 5 mM p-nitrophenyl-α-D-glucopyranoside solution in 0.1 M
295
phosphate buffer (pH 6.9) was added to each well at timed intervals. The reaction mixtures were
296
incubated at 25°C for 5 min. Before and after incubation absorbance readings were recorded at 405
297
nm using a micro-plate reader (Thermomax, Molecular device Co., Virginia, USA) and compared to
298
a control which contained 50 µl of the buffer solution instead of the extracts. The experiments were
299
performed in triplicate and the α-glucosidase inhibitory activity was expressed as percentage
300
inhibition. Acarbose was prepared in distilled water and used as positive controls. The percentage
301
inhibition was calculated using the formula;
302
% Inhibition = {(Ac – Ae)/Ac} 100
303
Where Ac and Ae are the absorbance of the control and extract respectively.
304
IC50 values (inhibitor concentration at which 50% inhibition of the enzyme activity occurs) of
305
each encapsulated PHF samples was determined by plotting graph with varying concentrations of
306
the plant extracts against the percent inhibition
2.9.3. Determination of Bioavailability of microencapsulated products by in vitro dialyzability
309
assay
310
The estimation for bioavailability of all microencapsulated products was determined by the
311
method developed by Pineiro et al. [42].
312
2.10. Acute toxicity
313
The acute oral toxicity study was carried out in compliance with Organization for Economic
314
Cooperation and Development (OECD) guideline 425 [43]. All mice (n=5) for testing were fasted for
315
12 h and weigh have been recorded and subsequently received the solution of microencapsulated
316
products of PHF at the final concentration of 2000 mg/kg by gavage. The animals were observed
317
individually at least once during the first 30 min after dosing, periodically for first 24 h and regularly
318
thereafter for 14-day of feeding period for gross behavioral changes, toxicity symptoms or mortality.
319
2.11. LC-ESI-QTOF-MS analyses
320
For LC-ESI-QTOF-MS analysis, firstly ethanolic extract was prepared using PLEx as described
321
in Section 3.4. Afterwards obtained ethanolic extract was used to for the metabolite profiling of PHF
322
using an Agilent 1100 Liquid Chromatography system (Agilent Technologies, Palo Alto, CA, USA)
323
furnished with a standard auto-sampler. The analytical column used was characterized as
324
Phenomenex Gemini C18 (3µm, 2 x 150 mm) operated at 25ºC with a gradient elution portfolio at a
325
flow rate of 0.2 ml/min. The mobile phases used were of acidified water (0.5% acetic acid) (A) and
326
acetonitrile (B). The following multi-step linear gradient applied in following fashion: 0 min, 5% B; 5
327
min, 15% B; 25 min, 30% B; 35 min, 95% B; 40 min, 5% B. The initial conditions were maintained for 5
328
min. The injection volume of sample in system was 1µl. The LC-MS system was further composed of
329
a Dionex Ultimate 3000 Rapid Separation LC system coupled to a micrOTOF QII mass spectrometer
330
(Bruker Daltonics, Bremen, Germany) fitted with an electro-spray source operating in positive mode.
331
The LC system contained an SRD-3400 solvent rack/degasser, an HPR-3400RS binary pump, a
WPS-332
3000RS thermostated auto-sampler, and a TCC-3000RS thermostated column compartment. The
333
micrOTOF QII source parameters were as follows: temperature, 200°C; drying N2 flow, 8 L/min;
334
nebulizer N2, 4.0 bar; end plate offset, −500 V; capillary voltage, −4000 V; mass range, 50−1500 Da,
335
acquired at 2 scans/s. Post acquisition internal mass calibration used sodium formate clusters with
336
the sodium formate delivered by a syringe pump at the start of each chromatographic analysis.
337
Nitrogen was used as drying, nebulizing and collision gas. The precise mass data of the molecular
338
ions were processed using Data Analysis 4.0software (Bruker Daltoniks), which delivered a list of
339
potential elemental formulas via the Generate Molecular Formula Editor. The generate molecular
340
formula Editor uses a CHNO algorithm, which deals with standard practicalities such as electron
341
configuration, minimum/maximum elemental range and ring-plus double-bond equivalents, as well
342
as a sophisticated comparison of the theoretical with the measured isotope pattern(Sigma Value) for
343
increased confidence in the recommended molecular formula. The commonly acknowledged
344
accuracy threshold for validation of elemental compositions was established at 5 ppm (Bringmann et
345
al., 2005). It is significant to point out that even with very high mass precision (<1ppm) many
346
chemically likely formulas may be found, subjected to the mass regions considered and so high mass
347
accuracy alone is not enough to discount enough candidates with complex elemental compositions.
348
The use of isotopic abundance patterns as a single further constraint, however, eliminates>95% of the
349
false candidates. This orthogonal filter can diminish numerous thousand nominees down to only a
350
small number of molecular formulas. During the development of the HPLC method, the instrument
351
was calibrated externally with a 74900-00-05 Cole Palmer syringe pump (Vernon Hills, Illinois, USA)
352
directly linked to the interface and injected with a sodium acetate cluster solution containing 5mM
353
sodium hydroxide and 0.2% acetic acid in water: isopropanol (1:1, v/v). The calibration solution was
354
injected at the beginning of each run and all the spectra were calibrated prior to compound
355
identification. By using this method, an exact calibration curve based on several cluster masses, each
356
differing by 82 Da (NaC2H3O2) was obtained. Due to the compensation of temperature drift in the
micrOTOF-Q II, this external calibration provided accurate mass values of better than 5 ppm for a
358
complete run without the need for a dual sprayer setup for internal mass calibration.
359
3. Statistical Analysis
360
All statistical analyses were conducted using a one-way analysis of variance using Dunnett’s
361
comparison tests or unpaired t-tests. All calculations were carried out using GraphPad Prism 5
362
(GraphPad Software, San Diego CA, www.graphpad.com). Significance was observed at p < .05.
363
4. Results and discussion
364
4.1. The effect of microencapsulation on the contents of antioxidant components and antioxidant activity of
365
PHF
366
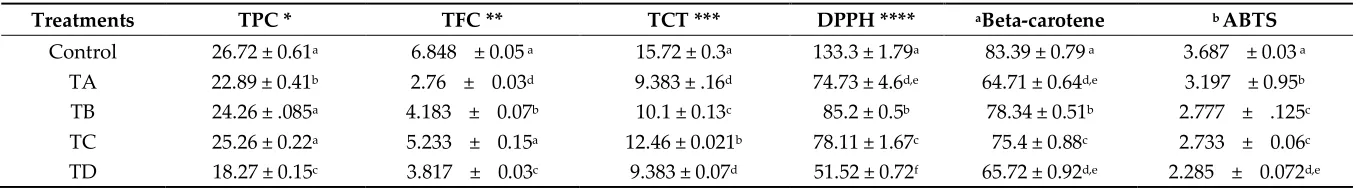
The contents of antioxidant components of PHF extract treated with different encapsulating wall
367
materials were shown in Table 1. In comparison to untreated extract, all microencapsulated
368
treatments have less antioxidant components (i.e. total phenolic contents (TPC), total flavonoids
369
contents (TFC), and total condensed tannins (TCT). The retention for all freeze-dried treatments
370
demonstrated in the term of percentages, ranged from 94.28% to 68.22% for TPC, 76.46% to 40.35%
371
for TFC and 79.24% to 59.70% for TCT representing the effectiveness of microencapsulation
372
procedure. The wide-ranging powders produced from the microencapsulation process, especially
373
those obtained from the treatment C (TC), retained higher contents of antioxidant components. In
374
general, these results may be associated with the type and concentrations of different wall materials.
375
There were many multifaceted factors which were responsible for hammering of polyphenol
376
compounds during freeze drying method, the crushing of lyophilized microencapsulated products
377
after freeze-drying, was considered one of the key factor which may cause the degradation of
378
bioactive components in the final products by boosting the product’s contact with environment. Our
379
finding was in agreement with previous work in which authors explored that lyophilized wine
380
product contained almost 70% of the original phenolics components [44-45]. Other factors which may
381
responsible for declining the concentration of active components include: formation of microspheres
382
during the lyophilization due to a scattering of the bioactive components inside the configuration of
383
encapsulating wall materials i.e. consisting of one or more constant phase of encapsulating agents
384
[46], development of micro-pores in the aforesaid microspheres, mainly associated to sublimation
385
process during lyophilization [47]. In the current study, lyophilized product encompassed a
386
reduction of 5.72–31.78% for total phenolics contents (TPC), declined trend of 23.54–59.65% and
20.76-387
40.30% was also observed for TFC and TCT respectively. Despite the reduction of antioxidant
388
components of microencapsulated products, a significant retentions were also observed (described
389
above in detail with percentages) comparable/higher to prior studies i.e. authors found, that acai pulp
390
microencapsulated with GA have phenolic retention of 94.1% [26].
391
The freeze dried product microencapsulated with 10% GA demonstrated (Tc) the exceptional
392
conservation for antioxidant components (i.e TPC, TFC, TCT). The order of effectiveness of
393
microencapsulation for other remaining treatments was as followed: TB>TA>TD. The higher
394
competence of TC treatment was mainly attributed to the structure of gum arabic (GA), because it is
395
a hetero-polymer made up of dense branches of sugar, containing a minute quantity of protein which
396
connected to the carbohydrate skelton via covalent bonds, proceeding as a tremendous
397
microencapsulating material [48]. Noteworthy results were also found for TB and TA, which might be
398
credited to presence of 5% GA. In contrary, no significant difference was noticed for the lyophilized
399
product having10% MD as wall material (TD).
400
The antioxidant activity for microencapsulated powders determined by DPPH, β-carotene and
401
ABTS+ assay were illustrated in Table 1. All microencapsulated products had showed decrease
402
antioxidant by DPPH assay in relation to original extract (control) and their retention ranged from
403
38.84% - 64.50%. Treatment B (5% GA and 5% MD) and treatment C (10% GA) illustrated the highest
404
antioxidant activity; these results were agreement with previously found values by Souza et al. [49].
405
The order for effectiveness was noticed as: TB>TC>TA>TD. In the case of β-carotene bleaching assay,
the antioxidant retention for all microencapsulated products were explored from 77.59 to 93.93% in
407
comparison to original extract, TB (5% GA &5% MD) showed maximum value for antioxidant
408
activity in a similar way as in DPPH assay. Remaining treatments has been categorized in context of
409
efficacy as followed: TC>TD>TA. Referring to antioxidant assay by ABTS+ radical scavenging activity,
410
the range of retention was from 62.2% to 86.68%. The noteworthy consequence was revealed for TA
411
(5% GA & 5% GE), while TB (5% GA and 5% MD) and TC (10% GA) also illustrated the significant
412
results with retention of 75.27% and 74.18% respectively. The above discussion suggested the
413
worthiness of diverse antioxidant assay for secure and overwhelming conclusion, because each assay
414
comprised its own preciseness and proceeds at a challenging site of action. Amongst the all
415
lyophilized encapsulated products, the antioxidant activity was higher in TB and TC, being related to
416
the presence of high antioxidant components (i.e. TPC, TFC &TCT) (Table 1), which provided an
417
excellent defense system against unrestrained oxidation, owing to its high reducing power.
418
Furthermore, there is no report yet on microencapsulation of aforesaid polyphenol enriched extract
419
from PHF and their characterization related to analysis for antioxidant.
420
4.2. Physical characteristics of microencapsulated powder products
421
Physical factors i.e. water activity; moisture contents and hygroscopicity are indispensable for
422
encapsulating products steadiness and storage, whilst aqueous solubility is correlated with ability of
423
powder products for reconstitution [28].
424
The moisture contents for four different lyophilized encapsulated products were demonstrated
425
in Figure1A. The moisture content of said powders was ranged from 7.07% to 9.04%; on the contrary,
426
no significant difference was found between TB and TD (7.41% and 7.21%, respectively). Our findings
427
was validated by earlier investigation which elaborated the moisture contents for blackberry fruit
428
drink encapsulated by means of MD and trehalose dehydrate were of 2.44–6.11% [50]. Lower freezing
429
temperature i.e. less than -40oC consequence in quick freezing, eventually caused tiny pores in the
430
superficial coatings, which might encumber the mass transfer and regarded as an obstacle for
431
sublimation process, causing the higher retention of moisture contents in microencapsulated
432
products [51].
433
The water activity (aw) of all microencapsulated products (Figure 1B) was ranged from 0.310 to
434
0.450, and all final encapsulated products were noticeably dissimilar from one another, apart from TB
435
(5% GA and 5%MD). TD (10% MD) demonstrated the maximum aw value of 0.450 which was
436
corroborating with previous study carried out by Gurak et al. [52] who found that aw of grape fruit
437
drink microencapsulated by the means of maltodextrin (MD) utilizing lyophilization technique was
438
0.430.
439
Various factors that determine the solubility of the microencapsulated powdered products
440
includes: the feed composition and particle size. The selection of the wall material is very important,
441
not only for the solubility itself but also to the crystalline state that ultimately bestowed to the dried
442
powders [53]. The aqueous solubility for all lyophilized treatments was ranged from 84.06 to 92.31%
443
as illustrated in Figure1C. The solubility of the final product possibly not only associated with
444
solubility prospective of microencapsulating wall material but also on attainted particle size in final
445
desirable product; if particle size would be minute, it would ultimately provide the better surface
446
area’s availability for the hydration process [54, 55]. The highest solubility value was obtained for
447
treatment TD (10% MD) that was consistent with previous work. Moreira et al.[30]elaborated the
448
solubility percentage for acerola pomace extract ranged from 90.97 to 96.92%, using MD and tree’s
449
gum of cashew apple as microencapsulating wall materials.
450
The hygroscopicity values for all microencapsulated powder products by the means of
freeze-451
dying method were depicted in Figure 1D. These were ranging from 11.92% to 14.35%, representing
452
a lesser amount of hygroscopicity values for powder products; hence assisted the protection of
453
antioxidant components. The findings of current work have much resemblance with preceding work,
454
utilizing related sort of microencapsulating wall materials. Some renowned investigators reported
455
the hygroscopicity of microencapsulated products made up from bark extract of jaboticaba tree using
456
MD and GA as wall material of 17.75%. The lyophilized powdered products demonstrated the lesser
hygroscopic values, regardless the presence of higher contents of moisture [25]. The aforesaid
458
behavior was also reported by Khazaei, et al.[31].The lower values of hygroscopicity for the all
459
lyophilized products mainly attributed to the bigger particle size, since the bigger the particle size,
460
the lesser the uncovered surface area, therefore low down the water absorption [26, 58].
461
The stability of microencapsulated powdered products for the period of storage was principally
462
determined by glass transition temperatures (Tg), the lower the Tg resulting in lower the stability of
463
final product and vice versa. The glass transition temperatures (Tg) of all lyophilized products were
464
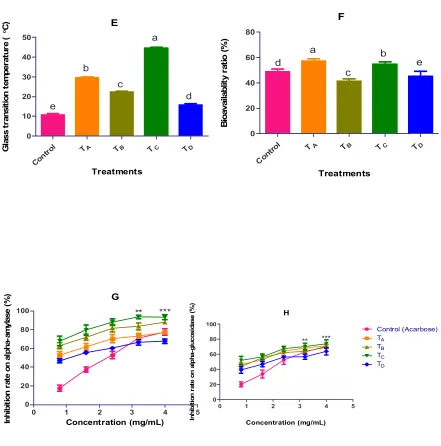
of 15.86 to 45.0oC in range (Figure 1E). Amongst all lyophilized microencapsulated products, the TC
465
represented the highest glass transition temperature (45.0oC), proving maximum stability.
466
Furthermore, other treatments also showed significant values for Tg except TD. The glass transition
467
temperature has been influenced by diverse factors, including moisture contents, chemical
468
configuration and molecular mass of subjected matter [59]. Adhikari et al., 2004 found the lower
469
transition temperatures of fruit drinks/extract were mainly due to the existence of elevated quantity
470
of low molecular weight organic acids and polysaccharides [60]. Additionally, integration of
471
microencapsulating agents in extracts has much predisposed on glass transition temperatures (Tg)
472
which varied according to molecular weight of encapsulating material; increase in molecular weight
473
of wall material resulting the increase in final Tg of the product. The results of our current work were
474
corroborated with earlier findings [61-63]. The lyophilized microencapsulated product obtained from
475
treatment D (TD) represented the lower Tg because of lower molecular weight of MD. Moreover, this
476
behavior was not noticed in TC (10%GA), TA (10% GA and 5% GE) and TB (10%GA and 5%MD) due
477
to the existence of uppermost molecular weight of GA in the term of quality and quality of wall
478
material.
479
A
Con
trol TA TB TC TD
0 2 4 6 8
10 b a
b c c d Treatments M o is tu re C o n te n ts (g H 2 O /1 0 0 g d ry s o li d s ) B Con
trol TA TB TC TD
0.0 0.2 0.4 0.6 a b c d e Treatments W a te r A c ti v it y ( A w ) C Con tro
l TA TB TC TD
0 20 40 60 80 100 a b c d d Treatments S o lu b ili ty ( % ) D Con
trol TA TB TC TD
E
Con
trol TA TB TC TD
0 10 20 30 40 50 a b c d e Treatments G la s s tr a n s it io n te m p e ra tu re ( oC ) F Con
trol TA TB TC TD
0 20 40 60 80 a b c e d Treatments B io a v a il a b li ty r a ti o ( % ) G
0 1 2 3 4 5
0 20 40 60 80
100 ** ***
Concentration (mg/mL) In h ib it io n r a te o n a lp h a -a m y la s e ( % ) H
0 1 2 3 4 5
0 20 40 60 80 100 Control (Acarbose) TA TB TC TD *** ** Concentration (mg/mL) In h ib it io n r a te o n a lp h a -g lu c o s id a s e ( % )
481
482
Figure 1(A-E): Physical properties of PHF extract microencapsulated with GA, GE, MD and their
483
combinations by freeze-drying method.1F: bioavailability ratio (%), & 1G and IH: alpha-amylase and
484
alpha-glucosidase inhibition activity (IC50). Treatment A (TA): Freeze-dried, with 5% GA and 5% GE;
485
Treatment B (TB): Freeze-dried, with 5% GA and 5% MD; Treatment C (TC): Freeze-dried, with 10%
486
GA; Treatment D (TD): Freeze-dried, with 10%.
487
Table 1: Antioxidant components and antioxidant activities of PHF extracts microencapsulated with GA, GE, MD and their combinations by Freeze-drying method
491
Treatments TPC * TFC ** TCT *** DPPH **** aBeta-carotene b ABTS
Control 26.72 ± 0.61a 6.848 ± 0.05 a 15.72 ± 0.3a 133.3 ± 1.79a 83.39 ± 0.79 a 3.687 ± 0.03 a
TA 22.89 ± 0.41b 2.76 ± 0.03d 9.383 ± .16d 74.73 ± 4.6d,e 64.71 ± 0.64d,e 3.197 ± 0.95b
TB 24.26 ± .085a 4.183 ± 0.07b 10.1 ± 0.13c 85.2 ± 0.5b 78.34 ± 0.51b 2.777 ± .125c
TC 25.26 ± 0.22a 5.233 ± 0.15a 12.46 ± 0.021b 78.11 ± 1.67c 75.4 ± 0.88c 2.733 ± 0.06c
TD 18.27 ± 0.15c 3.817 ± 0.03c 9.383 ± 0.07d 51.52 ± 0.72f 65.72 ± 0.92d,e 2.285 ± 0.072d,e Note: Results displayed are a representation of triplicate quantifications per extract. Different letters within the same column indicate significant differences (p < 0.05) *
492
Total phenolic contents (TPC) expressed as mg gallic acid equivalents (GAE) per g of dry extract; **Flavonoid content expressed as mg quercetin equivalents (QE) per g of
493
dry extract; ***Total condensed tannin content based on calibration curve of (+)-catechin, expressed as mg catechin equivalents (CE) per g of dry extract. ****DPPH expressed
494
as µmol/g sample on dry basis; aβ-carotene of extracts (5 mg/mL) based on percent bleaching inhibition. b EC50 (mg/mL) is representative of the effective concentration at
495
which 50% of ABTS+ radicals were scavenged. The Dunnett’s test was to evaluate the significance with confidence level was set to 95%. TA: Freeze-dried, with 5% GA and
496
5% GE; TB: Freeze-dried, with 5% GA and 5% MD; TC: Freeze-dried, with 10% GA; TD: Freeze-dried, with 10%.
4.3. Size distribution and Morphology of Microencapsulated powders
498
Different polymers exhibited particular protection capacity, so the evaluation of
499
microencapsulated products is very crucial. This aforesaid capacity elaborated the extent of
micro-500
pores and reliability of encapsulated micro-particles [64]. The structural analysis of the encapsulated
501
products from the lyophilization methodology was conducted by the means of scanning electron
502
microscope (Quanta 250 EFI). Comparison of the images illustrated the noticeable variation in term
503
of particle structure and size allocation amongst the different microencapsulated products and their
504
combination attained after lyophilization. Figure 2A, 2B, 2C, 2D demonstrated the morphology of all
505
freeze-dried microencapsulated products. As can be seen all lyophilized products presented the
506
irregular shape like broken glass with appreciable proportion of pores on surface. The outcome of
507
current investigation has agreement with the recent work explored by Kuch and Norena [65]. These
508
authors studied on morphological aspects of lyophilized products, made up from the peel of grapes
509
and pomace of Averrhoa carambola and presented the final product as porous, uneven and brittle
510
confirmation; furthermore they also described the reason behind the high porosity of lyophilized
511
products as development of ice crystals had happen in material which as a result retarded the
512
breakdown of final configuration and hence less change in volume occurred.
513
Figure 2: Micrographs of PHF extract microencapsulated with GA, GE, MD and their combinations
514
by freeze-drying method.Treatment A (TA): Freeze-dried, with 5% GA and 5% GE; Treatment B (TB):
515
Freeze-dried, with 5% GA and 5% MD; Treatment C (TC): Freeze-dried, with 10% GA; Treatment D
516
(TD): Freeze-dried, with 10%.
517
Treatment A (TA) Treatment B (TB)
There was a direct association between span value and dispersal of particle size, the lesser span
518
value demonstrating a uniform distribution of micro-particles [66]. The size of micro-particles from
519
the final products was in the range of 18.08 to 391.30 µm. TA explored the higher particle size (more
520
than 287µm), whereas TD showed the lowest one. Our current work is consistent with prior
521
investigation, examined by other authors [58]who found that the particle size of microencapsulated
522
product via freeze-dying method reached up to 300µm. The bigger particle dimension of lyophilized
523
products was mainly attributed to rapid freezing and less availability of force to crush the freeze drop
524
during lyophilization [67, 68]. Moreover, particle size was also influenced by crushing procedure
525
which was generally accustomed for size reduction after lyophilization.
526
4.4. Alpha-Amylase & Alpha-Glucosidase Inhibition
527
Type-II DM an outcome of insulin resistance is a metabolic disease that, according to the latest
528
data for the World Health Organization in 2014, impinges on 9% of the world's population, both in
529
developed and developing countries, and directly caused 1.5 million deaths in that single year [1, 2].
530
In order to hamper the side effects of type-II DM, insulin injection and usage of
anti-531
hyperglycaemic substances are two key conventional approaches. The management of the blood
532
sugar level is effective and novel approach to overcome the diabetes mellitus and related
533
complications. Inhibitors of carbohydrate hydrolyzing enzymes (i.e.: α-amylase and α-glycosidase)
534
have been practically valuable as oral hypoglycemic drugs and regarded as a reliable indicator for
535
the efficacy of therapeutic agents [69-71]. Several α- amylase inhibitors including acarbose, miglitol
536
and voglibose are clinically useful to treat diabetes but these are expensive and have considerable
537
clinical side effects. Medicinal plants have great potential to retard the absorption of glucose by
538
inhibiting the saccharides hydrolyzing enzymes [72-74].
539
There was an attempt to explore the remarkable drugs from medicinal plants featured with
540
elevated potency and less adverse effects than existing drugs [75, 76]. Therefore, screening and
541
isolation of inhibitors from plants for these enzymes are escalating.
542
In the aforementioned context, our microencapsulated polyphenolic enriched powders were
543
investigated for α-amylase and α-glycosidase inhibition as shown in Figure 1G & 1H. Diverse classes
544
of polyphenolic compounds in the current PHF extract were detected likewise: flavonoids,
545
alkaloids, terpenoids, lignans, glycerophospholipid, prenol lipids and their derivatives (detailed in
546
Section 2.5), which eventually may considered for antidiabetic potential of microencapsulated
547
powders of current study. The treatment TC (10% GA) demonstrated the highest inhibition at
548
concentration of 4mg/mL, for alpha-amylase (93.33 ± 2.65, with IC50 value 1.47 mg/mL ± 0.57) and
549
alpha-glucosidase (73.39 ± 1.66 with IC50 value 2.03 ± 0.45 mg/mL), representing highest antidiabetic
550
potential. Previously, none of investigation has yet been carried out on lyophilized aforementioned
551
microencapsulated PHF products. Additionally, there is no report on microencapsulation of
552
polyphenol enriched extract from PHF and their characterization for anti-diabetic potential purposes,
553
which eventually facilitate to take decision for commercialization of microencapsulated products i.e.
554
polyphenols enriched nutrient supplement.
555
4.5. Bioavailable TP contents
556
TP contents present in dialyzable fraction of final products were illustrated in Table 2 (mean
557
value ± standard deviation). TP bioavailability ratios, articulated in the term of percentage, were
558
computed by using the equation as followed:
559
(%) =
[TP]Dialyzable
[TP] Total
× 100
560
Where, Bav (%) represented the percentage (%) for TP bioavailability, whereas [TP] Total and
561
[TP] Dialyzable demonstrated TP concentrations after the PLE extraction method and in vitro
562
digestion procedure respectively.
563
Table 2.represented the Dialyzable TPs, were in the range of 8.21–13.32mg GAE/g. Figure 1F
564
depicted the bioavailability ratio (%) for all freeze-dried microencapsulated products. Treatment TA
and TC demonstrated the excellent bioavailability ratios (%) i.e. 57.25 and 54.64 % respectively, there
566
was no significant difference in TB and TD. Furthermore No research has yet been conducted on in
567
vitro dialyzability analysis of aforesaid microencapsulated PHF products.
568
Table 2: Average diameter and particle size distribution (Span) of the PHF extract microencapsulated
569
with GA, GE, MD and their combinations by freeze-drying method.
570
Treatments Average Diameter (µm) Span
TA 151.13 1.74
TB 76.15 1.21
TC 92.79 2.88
TD 18.95 1.52
Treatment A (c; Treatment B (TB): Freeze-dried, with 5% GA and 5% MD; Treatment C (TC):
Freeze-571
dried, with 10% GA; Treatment D (TD): Freeze-dried, with 10%.
572
4.6. Acute toxicity
573
No toxic effects and mortality were observed at a dose of 2000 mg/kg by gavage. Consequently,
574
microencapsulated products of PHF extract were regarded as safe for consumption.
575
4.7. Bioactive Compounds from LC-ESI-QTOF-MS analysis
576
The ethanolic extract of freeze dried fine powder of PHF was a multifaceted mixture of
577
compounds. Figure 3 characterized the chromatogram of said ethanolic extract. The bioactive
578
compounds were recognized by means of the comparing retention times (RT) and MS/MS spectra
579
granted by QTOF-MS with those of valid standards wherever obtainable and via elucidation of MS
580
and MS/MS spectra from QTOF-MS merged with data available in literature. MS data of identified
581
compounds has been recapitulated in the Table 3 including calculated m/z for molecular formulas
582
provided, main fragment obtained by MS/MS, error and proposed compound for each peak. Diverse
583
classes of polyphenolic compounds have been discovered in the ethanolic extract of PHF. The major
584
detected classes of these polyphenolic bioactive compunds are flavonoids, alkaloids, terpenoids,
585
lignans, glycerophospholipid and prenol lipids.
586
587
Figure 3: Chromatogram of the Ethanolic extract derived from freeze dried powder of PHF
Table 3: Bioactive Compounds identified in Ethanolic Extract of PHF
589
Peak
No. RT (min) Assigned Compound Name Elemental Composition m/z [M+H] +
Difference (mDa)
1 8.773 Caffeic acid 4-sulfate C9H8O7S 261.128 0.71
2 9.458 Steviol C20H30O3 319.1329 -0.92
3 9.708 Antherospermidine C18H11NO4 305.1541 0.15
4 9.904 ERIODICTYOL C15H12O6 289.1231 -0.14
5 9.95 Phloretin C15H14O5 275.1077 1.04
6 10.177 Zanthobisquinolone C21H18N2O4 363.1589 0.57
7 10.384 Murrayazolinol C23H25NO2 349.1795 0.72
8 10.639 Patuletin C16H12O8 333.1488 0.34
9 10.746 Albanin d C25H26O5 407.1849 0.84
10 10.834 3,5,8,3',4',5'-Hexahydroxyflavone C15H10O8 319.1329 0.31
11 10.918 Myricetin C15H10O8 319.1692 0.3
12 10.936 Dehydroneotenone C19H12O6 393.2055 0.77
13 11.219 Carissanol C20H24O7 377.1746 0.86
14 11.4 Epigallocatechin 3-O-cinnamate C24H20O8 437.2313 -0.13
15 11.479 Catalpol C15H22O10 363.195 0.8
16 11.528 Secoisolariciresinol C20H26O6 363.1589 0.46
17 11.805 Quercetagetin 7-glucoside C21H20O13 481.2572 -0.02
18 11.945 Cajaflavanone C25H26O5 407.2208 -0.17
19 12.163 Barbatoflavan C24H28O13 525.2828 0.9
20 12.348 Celastrol C29H38O4 451.2469 0.04
21 12.484 6-Gingerol C17H26O4 296.1487 -1.92
22 12.77 Euphorbia diterpenoid 3 C33H40O11 613.3348 0.89
23 13.017 2-Hexaprenyl-6-methoxyphenol C37H56O2 534.3435 0.67
24 13.278 PE(P-16:0/18:2(9Z,12Z)) C39H74NO7P 701.3867 -1.1
26 16.104 Phytosphingosine C18H39NO3 318.2974 -0.04
27 17.059 1-EICOSENE C20H40 282.2015 0.84
28 19.53 Tectorigenin C16H12O6 301.1391 0.18
29 20.643 3-O-cis-Coumaroylmaslinic acid C39H54O6 619.3973 -0.4
30 20.884 PA(18:3(6Z,9Z,12Z)/20:3(8Z,11Z,14Z)) C41H69O8P 721.4644 0.32
31 21.141 Eurysterol A sulfonic acid C27H46O7S 515.3518 0.33
32 21.548 Citflavanone C20H18O5 338.3391 1.25
33 21.698 Mesaconitine C33H45NO11 631.4345 -0.17
34 22.01 Xanthoangelol C25H28O4 393.294 0.44
35 22.385 PA(15:0/22:4(7Z,10Z,13Z,16Z)) C40H71O8P 711.4757 0.56
36 22.589 2',5,6-trimethoxyflavone C18H16O5 312.3236 1.42
37 22.613 Ubiquinol-8 C49H76O4 729.5073 0.38
38 22.646 Epicalyxin J C42H38O9 686.4852 0.14
39 22.967 Luteone C20H18O6 354.37 1.64
40 23.177 Luteolin 4'-sulfate C15H10O9S 366.3702 1.43
41 23.524 Quercetin
3-(6''-malonylglucoside)-7-glucoside C30H32O20 713.5121 0.64
42 24.348 Phytoene C40H64 545.1143 0.39
43 26.083 Epigallocatechin 3,3',-di-O-gallate C29H22O15 610.1796 0.62
44 26.819 Kaempferol
3-(2'',3''-diacetyl-4''-p-coumaroylrhamnoside) C34H30O14 663.4496 0.47
45 29.446 Delphinidin 3-(6''-malonyl-glucoside) C24H23O15 684.1982 0.21