a
e-mail : [email protected]
Evolution of the fracture process zone in high-strength
concrete under different loading rates
R. C. Yu1,, X. X. Zhang1,2,a , G. Ruiz1, M. Tarifa1 and M. Cámara1
1Universidad de Castilla-La Mancha, 13071 Ciudad Real, Spain 2Harbin Engineering University, 150001, China
Abstract. For cementitious materials, the inelastic zone around a crack tip is termed as fracture process zone (FPZ) and dominated by complicated mechanism, such as microcracking, crack deflection, bridging, crack face friction, crack tip blunting by voids, crack branching, and so on. Due to the length of the FPZ is related with the characteristic length of the cementitious materials, the size, extent and location of the FPZ has been the object of countless research efforts for several decades. For instance, Cedolin et al. [1] have used an optical method based on the moiré interferometry to determine FPZ in concrete. Castro-Montero et al. [2] have applied the method of holographic interferometry to mortar to study the extension of the FPZ. The advantage of the interferometry method is that the complete FPZ can be directly observed on the surface of the sample. Swartz et al. [3] has adopted the dye penetration technique to illustrate the changing patterns observed as the crack progress from the tensile side to the compression side of the beam.
Moreover, acoustic emission (AE) is also an experimental technique well suited for monitoring fracture process. Haidar et al. [4] and Maji et al. [5] have studied the relation between acoustic emission characteristics and the properties of the FPZ.
Compared with the extensive research on properties of the FPZ under quasi-static loading conditions, much less information is available on its dynamic characterization, especially for high-strength concrete (HSC). This paper presents the very recent results of an experimental program aimed at disclosing the loading rate effect on the size and velocity of the (FPZ) in HSC. Eighteen three-point bending specimens were conducted under a wide range of loading rates from from 10-4 mm/s to 103 mm/s using either a servo-hydraulic machine or a self-designed drop-weight impact device. The beam dimensions were 100 mm100 mm in cross section, and 420 mm in length. The initial notch-depth ratio was approximately 0.5, and the span was fixed at 300 mm during the tests. Four strain gauges mounted along the ligament of the specimen were used to measure the FPZ size. Surprisingly, the FPZ size remains almost constant (around 20 mm) when the loading rate varies seven orders of magnitude. This is clearly different from NSC, in which the FPZ size actually decreased with loading rate.
1 Introduction
For cementitious materials, the inelastic zone around a crack tip is denoted as the Fracture Process Zone. The extention and location of the FPZ is often dominated by complicated mechanisms, such as micro-cracking, crack bridge and friction. Due to the close relationship between the FPZ size and the © Owned by the authors, published by EDP Sciences, 2010
DOI:10.1051/epjconf/20100623006
characteristic length of a material, the FPZ evolution under different loading conditions has been the object of countless research efforts for decades [1-6].
In the present work, we chose the strain-gauge technology to measure the FPZ size in HSC at a wide range of loading rates, from 10-4 mm/s to 103 mm/s. Two testing devices, a hydraulic
servo-controlled testing machine and a self-designed drop-weight impact device were adopted. Furthermore, the detailed information from the strain history records will undoubtedly facilitate the validation of numerical models aimed at disclosing rate dependency.
2 Experimiental procedure
2.1 Material characterization
A single HSC was used throughout the experiments, made with porphyry aggregates of 12 mm maximum size and ASTM type IV cement, I42.5L/SR. Micro silica-fume slurry and super plasticizer (Glenium ACE 325, B255) were added to the concrete composition. The mixing proportions by weight were 1:0.336:3.52:1.62:0.3:0.043 (cement: water: coarse aggregate: sand: micro-silica fume slurry: super plasticizer).
Compressive tests were conducted according to ASTM C39 and C469 on 75 mm 150 mm (diameter height) cylinders. Brazilian tests were also carried out using cylinders of the same dimensions and following the procedures recommended by ASTM C496. Eight cylinders were cast, four for compressive tests and four for splitting tests. The mechanical properties as determined from various characterization and control tests are shown in Table 1.
2.2 Three-point-bend fracture tests
As aforementioned, in order to study the loading-rate effect in HSC, three-point bending tests on notched beams were conducted over a wide range of loading rates, from 10-4 mm/s to 103 mm/s. Two
testing apparatus were employed, one was a hydraulic servo-controlled testing machine, the other was a self-designed drop-weight impact instrument. The beam dimensions were 100 mm!100 mm
(B!D) in cross section (beam width and depth), and 420 mm in total length L. The initial notch-depth ratio a0/D (a0: initial notch length) was approximately 0.5, and the span S was fixed at 300 mm
during the tests, see Figure 1. Each specimen was removed from the moist room one day before the test and restored to the chamber after bonding the strain gauges. The specimen surface was polished and all four strain gauges (SG01-SG04, Model: LY 11 6/120A, 6 mm in length and 2.8 mm in width) were bonded to that surface, with a distance of 10 mm between each neighbouring gauge. Since a running crack in concrete is often deflected by aggregates along its path, the four strain gauges were bonded 10 mm apart from the centerline of the beam, see Figure 1. Those strain gauges provided not only the strain history at the bonded positions, but also the time at which the crack tip of the FPZ passed each strain gauge.
(Note: fc: compressive strength; ft: indirect tensile strength;
GF: fracture energy; E: elastic modulus; !: density) fc
[MPa] [MPa] ft [N/m] GF [GPa] [kg/m! 3]
Mean 102.7 5.4 141 31 2368
Std.
Dev. 2 0.8 9 2 1
Table 1: Mechanical and fracture properties of the HSC tested.
14th International Conference on Experimental Mechanics
2.3 Tests under loading rates from 10-4 mm/s to 101 mm/s
The tests were performed employing the hydraulic servo-controlled testing machine under position control. Three loading rates, from quasi-static level (5.50 10-4 mm/s) to rate dependent levels (0.55
mm/s and 17.4 mm/s), were applied. Three specimens were tested at each loading rate.
2.4 Tests under loading rates from 102 mm/s to 103 mm/s
All tests were conducted using the instrumented, drop-weight impact apparatus, which was designed and constructed in the Laboratory of Materials and Structures at the University of Castilla-La Mancha. More details are given in reference [7].The apparatus was employed to drop from three heights 40, 160 and 360 mm. The corresponding impact speeds were 8.81!102 mm/s, 1.76!103 mm/s
and 2.64!103 mm/s, respectively. Three specimens were tested at each impact speed. A detailed
description of the instrument is given in reference [8].
2.5 Crack-velocity measurement
When the fracture initiates, an unloading stress wave is generated and travels to the strain gauge, the sudden decrease of strain as a function of time indicates the crack initiation, see Figure 2 for a typical strain history record from one of the four strain gauges.
The crack velocity naturally refers to the speed in which this initiated cohesive crack tip, i,e. the FPZ front, will propagate. The time interval tf is the crack initiation time. Additionally shown in
Figure 2 are t"max and t"r0, which indicate the time at peak strain and the time at which the strain is
relaxed to zero, respectively. We define the time interval between t"max and t"r0 as the strain relaxation
time tr.
Since the stress wave speed is much greater than the crack propagation velocity [9], the time taken by the unloading stress wave to propagate from the crack line to SG0n (the offset distance from the center line is 10 mm) need not be taken into account. Thus an average crack-velocity between two neighboring strain gauges can be obtained through dividing the distance in between–10 mm– by the time interval across the two corresponding peak signals recorded.
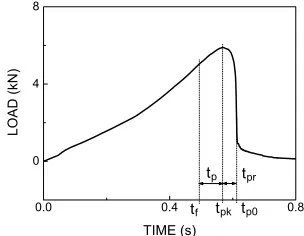
Furthermore the peak load is also an important parameter, which reflects the loading capacity of a given structural element, in our case, a three-point-bend beam, consequently all the information related to the peak load is also essential. In Figure 3, we give all the peak-load related information in one typical load history curve for low loading rate. The terms tp and tpr are defined as
the pre- and post-peak crack propagation time. The elapsed time between tmaxat SG04 and tp0is used Fig. 2: A typical strain versus time curve (shown in
the record of SG01), taking the example of the loading rate at 0.55 mm/s.
to obtain the crack velocity along the last 20 mm where no strain gauge was bonded. In addition, knowing the crack length at peak load ap, the pre- and post-peak crack propagation velocity v1 and v2
are also calculated as ap/tpand (D-a0-ap)/tpr respectively and given in the next section.
2.6 FPZ measurement
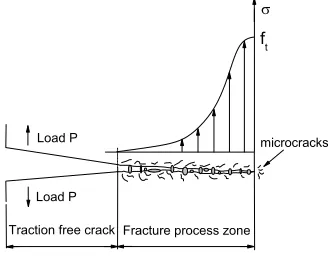
Hillerborg et al. [10] first proposed a fictitious crack model for fracture of concrete as shown in Figure 4. In this model the newly formed crack surfaces and the corresponding fracture process zone are simply simulated by a cohesive zone located in the front of the initial crack tip. As a result, the energy dissipation can be represented by a material-specific cohesive law within the FPZ.
Here, we explore the advantage of the strain-gauge technology, having in mind that the attainment of peak strain signals, the passing of a cohesive tip, and strain values relaxed to zero represent a traction-free crack tip.
3. Results and discussion
The measured load histories are depicted in Figure 5. It needs to be pointed out that under high loading rates, the load refers to the impact force, i.e., the inertial force is also included.
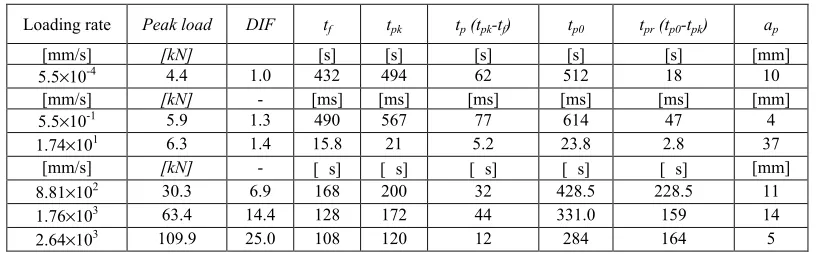
Information related to the peak load, such as the dynamic increase factor (DIF), the time intervals tpk, tp and tpr are reported in Table 2. The measured velocities vsg, the pre- and post-peak
crack propagation velocities v1 and v1 are all listed in Table 3.
3.1 Loading rate effect on peak loads
From Figure 5, note that the peak load increases proportionally with the loading rate, such rate effect is minor at low loading rates while it is pronounced at high loading rates. We define the dynamic increase factor (DIF) as the ratio of peak load and its corresponding quasi-static value (5.50 10-4
mm/s in this case). The DIF for peak loads are 1.4 and 25.0, for the loading rates of 17.4 mm/s and 2.64 103 mm/s, respectively. In other words, the DIF at high loading rates is approximately one
order higher than that at low loading rates.
It also needs to be pointed out that in Figure 5 (bottom row), we have scaled the load-axis by a factor proportional to its loading rate. Note that the peak load increases slightly faster than its loading rate. This is mainly due to the significant increase of inertia forces, see [11].
It is noteworthy that, at low loading rates, when the load peak is achieved, the crack length (ap, notch length not included) increased from 10 mm and 4 mm (5.5 10-4 and 5.5 101 mm/s) to 37
mm (17.4 mm/s); while at high loading rates, the crack length varied from between 5 to 14 mm for all three cases, see Table 2. In particular, for the loading rate of 17.4 mm/s, when the peak load is
14th International Conference on Experimental Mechanics
achieved at tpk of 21 ms, SG02 is deformation free at t"r02 of 19.9 ms, this shows the first 10-mm
stretch from the notch tip is already traction free.
Loading rate Peak load DIF tf tpk tp (tpk-tf) tp0 tpr (tp0-tpk) ap
[mm/s] [kN] [s] [s] [s] [s] [s] [mm]
5.5"10-4 4.4 1.0 432 494 62 512 18 10
[mm/s] [kN] - [ms] [ms] [ms] [ms] [ms] [mm]
5.5"10-1 5.9 1.3 490 567 77 614 47 4
1.74"101 6.3 1.4 15.8 21 5.2 23.8 2.8 37
[mm/s] [kN] - [µs] [µs] [µs] [µs] [µs] [mm]
8.81"102 30.3 6.9 168 200 32 428.5 228.5 11
1.76"103 63.4 14.4 128 172 44 331.0 159 14
2.64"103 109.9 25.0 108 120 12 284 164 5
3.2 Loading rate effect on crack velocity
The crack velocities are listed in Table 3. In the low loading rate range, on the one hand, for each loading rate, the crack advances with increasing speed; on the other hand, as the loading rate increases, the crack velocity increases proportionally. For instance, at 5.5 10-4 mm/s, the crack
velocity increased by a factor of 38 from 0.19 mm/s for vsg1 to 7.3 mm/s for vsg3; while at the loading
rate of 2640 mm/s, the crack speed varied from 417 m/s to 387 m/s. When the loading rate increased by a factor of 1000 (from 5.5 10-4 mm/s to 0.55 mm/s), the first-stage crack velocity v
sg1 increased
by 4100, while the late-stage velocities vsg3 and vsg4 only increased by a factor of 1369 and 1476
respectively. This indicates that, when the loading condition changes from quasi static to low loading rates, the loading rate effect on the early-stage crack velocity is almost three times stronger than its effect on the late-stage crack propagation; however, within the low loading rate range, when the loading rate increased by 34, from 0.55 mm/s to 17.4 mm/s, the increase factor from vsg1 to vsg3
remained practically the same (from 14.4 to 17.3). Within the high loading rate range, on the contrary, the crack advances with decreasing speed, and as loading rate increases, the crack propagation speed tends to be uniform, this is clearly seen from the pre and post-peak crack velocities. The maximum crack velocity reached approximately 20.6% of the Rayleigh wave speed.
Comparing the numerically-predicted two-stage crack propagation in [11], the experimentally observed pre- and post-peak velocities in Table 3 suggest that, at low loading rates, pre-peak crack propagation is stable in a sense that, continuous loading is necessary for continuous crack advancing, Fig. 5: Load history for low loading rate (left): 0.55 mm/s, and high loading rate (right): 2.64"103 mm/s, where
SG0n marks the time at which the strain peak is obtained for strain gauge SG0n (n=1, 2, 3,4). Note that for each graph, the load-axis is proportionally scaled to its loading rate.
whereas post-peak one is unstable, since less external load leads to faster crack propagation. On the contrary, at high loading rates, impact loads result fast crack propagation from the very beginning, less external load at post-peak is accompanied by a slower crack extension.
Loading rate
(mm/s) SG01-SG02 vsg1 (m/s)
vsg2
SG02-SG03 (m/s)
vsg3
SG03-SG04 (m/s)
vsg4*
(m/s) %
Pre-peak v1
(m/s)
Post-peak v2
(m/s) 5.5"10-4 1.9"10-4 2.7"10-4 7.3"10-3 2.1"10-3 - 2.3"10-4 1.2"10-3
5.5"10-1 0.78 0.73 1.05 3.1 - 0.58 0.73
1.74"101 11.2 12.6 16 4.2 - 6.8 4.2
8.81"102 292 250 208 138 14.4 344 171
1.76"103 357 278 357 187 17.6 327 224
2.64"103 417 417 387 200 20.6 417 275
* VSG4, crack velocity along the last 20 mm distance
3.3 Loading rate effect on the size of FPZ
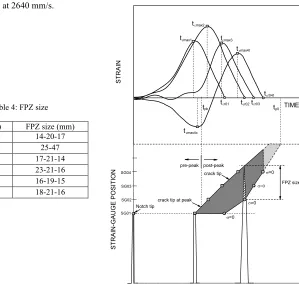
Figure 6 shows the method to determine the growth and development of the FPZ, taking the example of the loading rate at 2640 mm/s.
Loading rate (mm/s) FPZ size (mm)
5.5"10-4 14-20-17
5.5"10-1 25-47
1.74"101 17-21-14
8.81"102 23-21-16
1.76"103 16-19-15
2.64"103 18-21-16
Table 3 : Average crack velocity evolution
Fig. 6: Methodology to estimate the development and growth of FPZ. Filled square symbols represent time at peak strain, whereas filled circles stand for time when the strain relaxed to zero. The upper half shows the strain histories recorded in the four strain gauges; the lower part illustrates the initiation and propagation of the main crack, where the shaded zone is the evolution of the FPZ during loading. The dashed-line-surrounded shadow indicates unconfirmed information due to lack of further measurements. Shown is the case of the loading rate at 2640 mm/s.
14th International Conference on Experimental Mechanics
The upper half of the figure gives four strain histories recorded in the four strain gauges, with the time at peak strain t"max and the time when the strain relaxed to zero t"0 marked with filled
squares and circles respectively. The time at peak load tpk is also shown to distinguish the pre and
post-peak crack propagations. The lower half of Figure 6 shows the FPZ evolution with time during loading. Again, the crack velocity between two neighbouring strain gauges is the average , the variation of the velocity was not taken into account along this distance.
The upper limit of the shaded zone shows the evolution of the cohesive crack tip, while the lower one represents the traction-free crack tip. For instance, in order to know the FPZ ended at SG02, i.e., when is reached at t"r02, one needs to know the current location of the cohesive
crack tip. From the upper part of Figure 6, we find the intersection point between the line t=t"r02 and
the upper limit of the dark shaded zone, the distance between this intersection point and SG02 is the sought FPZ size. Note that, the FPZ was not completely developed either within the first nor the last 20 mm due to boundary effects. Since four strain gauges were employed to measure the strain history, at most three FPZ sizes can be directly obtained, more values can be obtained through interpolation as in Figure 6. We nevertheless list only those directly obtained FPZ sizes in Table 4 separated by a dash “-” sign. If we exclude the possible boundary effects of the notch and final ligament of each specimen, the central FPZ size in Table 4 should be considered as the material FPZ size. Surprisingly, the FPZ size remained almost the same when the loading rate varied seven orders of magnitude. This is clearly different from NSC, in which the FPZ size actually decreased with loading rate, see Du et al. [12,13] and Wittman [8].
4 Conclusions
Using strain-gauge technology, employing a servo-hydraulic machine and a drop weight impact device, we have measured crack propagation velocities and the size of the FPZ for a HSC loaded over a wide range of loading rates, from 10-4 mm/s to 103 mm/s. The following conclusions can be
drawn. (a) The peak load is sensitive to the loading rate. Under low loading rates, the rate effect on the peak load is minor, while it is pronounced under high loading rates. (b) The measured time to peak load tpk, a measure of the initial CMOD rate, varied from 0.12 ms to 494 s. (c) Unlike normal
strength concrete, the FPZ size varied only slightly for loading rates of seven orders of magnitude. (d) Under low loading rates, the main crack advances with increasing velocity, the late-stage velocity is one-order higher than the early-stage one; the rate effect on the crack velocity is remarkable. At high loading rates, the main crack propagates with a decreasing crack velocity of several hundred m/s, the rate effect on crack velocity is minor. In addition the crack propagation velocity in the high loading-rate range reached 20% of the material’s Rayleigh wave speed.
References
1. Cedolin, L, Dei Poli, S., and Iori, I. Cement and Concrete Research, 13, pp. 557-567, (1983). 2. Castro-Montero, A., Shah, S.P., and Miller, R.A., Journal of Engineering Mechanics, 116, pp.
2463-2484 (1990).
3. Swartz, S.E., and Go, C.G., Experimental Mechanics, 24, pp. 129-134 (1984).
4. Haidar K., Pijaudier-Cabot G., Dubé J.F. and Loukili A., Materials and Structures, 38, (2005). 5. Maji A. and Sha S.P., Experiemental Mechanics, 28, (1988).
6. Hu, X., and Wittmann, F.H., Journal of Materials in Civil Engineering, 2, pp. 15-23 (1990).
7. Zhang, X.X., Ruiz, G., and Yu, R.C.: submitted to Strain,
doi:10.1111/j.1475-1305.2008.00574.x. (2008).
8. Wittmann, F.H., Sadhana - Academy Proceedings in Engineering Sciences, 27, pp. 413-423 (2002).
EPJ Web of Conferences
10. Hillerborg, A., Modéer, M., and Petersson, P.E., Cement and Concrete Research, 6, pp. 773-781, (1976).
11. Zhang, X.X., Ruiz, G., and Yu, R. C., Journal of Materials in Civil Engineering, 20, pp. 544-551 (2008).
12. Yon, J.H., Hawkins, N.M., and Kobayashi, A.S., ACI Materials Journal, 89, pp. 146-153 (1992). 13. Du, J., Yon, J.H., Hawkins, N.M., Arakawa, K., and Kobayashi, A.S., ACI Materials Journal, 89,