Western University Western University
Scholarship@Western
Scholarship@Western
Electronic Thesis and Dissertation Repository
6-19-2015 12:00 AM
Test-Retest Reliability of MUNE and MUP Analysis from
Test-Retest Reliability of MUNE and MUP Analysis from
Decomposition-Based Quantitative Electromyography for the
Decomposition-Based Quantitative Electromyography for the
Flexor Carpi Radialis Muscle
Flexor Carpi Radialis Muscle
Saskia R. Knol
The University of Western Ontario
Supervisor
Dr. Timothy Doherty
The University of Western Ontario Graduate Program in Kinesiology
A thesis submitted in partial fulfillment of the requirements for the degree in Master of Science © Saskia R. Knol 2015
Follow this and additional works at: https://ir.lib.uwo.ca/etd
Part of the Other Kinesiology Commons
Recommended Citation Recommended Citation
Knol, Saskia R., "Test-Retest Reliability of MUNE and MUP Analysis from Decomposition-Based Quantitative Electromyography for the Flexor Carpi Radialis Muscle" (2015). Electronic Thesis and Dissertation Repository. 2932.
https://ir.lib.uwo.ca/etd/2932
This Dissertation/Thesis is brought to you for free and open access by Scholarship@Western. It has been accepted for inclusion in Electronic Thesis and Dissertation Repository by an authorized administrator of
TEST-RETEST RELIABILITY OF MUNE AND MUP ANALYSIS FROM DECOMPOSITION-BASED QUANTITATIVE ELECTROMYOGRAPHY FOR THE FLEXOR CARPI RADIALIS MUSCLE
(Integrated Article)
by
Saskia R. Knol
Graduate Program in Kinesiology
A thesis submitted in partial fulfillment of the requirements for the degree of
Master of Science
The School of Graduate and Postdoctoral Studies The University of Western Ontario
London, Ontario, Canada
ii ABSTRACT
The purpose of this study was to establish a set of representative data from
healthy subjects and determine the intra-rater reliability of decomposition-enhanced
spike triggered averaging (DE-STA) motor unit number estimation (MUNE) and
quantitative motor unit potential (MUP) analysis from D-QEMG for the flexor carpi
radialis (FCR) muscle. Twenty subjects aged 21-51 were studied (9 females, 11 males).
Trials A and B assessed test-retest reliability for FCR when the wrist was flexed only. The
effects of finger flexion during wrist flexion were assessed in trial C. Results found high
reliability for maximum CMAP (ICC = 0.92), moderate reliability for mean S-MUP (ICC =
0.63) and low reliability for MUNE (ICC = 0.39) between trials A and B. The SEMs and
mean percent differences for maximum CMAP, mean S-MUP and MUNE were 0.84 mV
and 4%, 11 µV and 15%, and 87 MUs and 16%, respectively. There were no detected
differences between trials A and B for any parameters. There was a significant
difference in MUNE (p = 0.035) between trials A and C. Results are consistent with
previous literature regarding the calculated MUNE, variability, and reliability. The
importance of neutral finger position during wrist flexion contraction has been
reiterated given the significant difference in MUNE between trials A and C. Overall,
iii KEYWORDS: Decomposition-enhanced spike-triggered averaging (DE-STA);
electromyography (EMG); motor unit number estimation (MUNE); test-retest reliability;
iv ACKNOWLEDGEMENTS
I am very grateful for the mentorship of my supervisor, Dr. Tim Doherty. You
have provided me with support and wisdom throughout my Masters experience. To my
colleague Neal McKinnon, you were indispensable in your willingness to help me
troubleshoot and assure me that I wasn’t losing my mind at times. I also have to thank
Tatum Azzoli, Dr. Doherty’s administrative assistant, for patiently screening my emails,
booking appointments, and handling an unnecessary amount of paperwork on my
behalf. I owe many thanks to the individuals who participated in the study, without
whom this thesis would not be possible. I am also grateful for the friendships I formed
with other Kinesiology graduate students – you have all encouraged me to keep going!
In addition, I would like to thank Louis, my inspirational mother and
grandparents for always encouraging me and believing in my ability to succeed. Your
visits, phone calls, and emails were a constant source of strength and motivation. I am
v TABLE OF CONTENTS
Page
Abstract ii
Key Words iii
Acknowledgements iv
Table of Contents v
List of Tables vi
List of Figures vii
List of Appendices viii
List of Abbreviations ix
Chapter 1: Introduction
1.0 General Introduction
1.0.1 Motor neurons and motor units 1
1.0.2 Collateral reinnervation 2
1.0.3 Motor unit number estimation and incremental stimulation 3 1.0.4 Motor unit number estimation techniques 5
1.0.5 Spike triggered averaging 6
1.0.6 Decomposition-enhanced spike triggered averaging 7 1.0.7 Conditions studied with motor unit number estimation 9 1.0.8 Flexor carpi radialis muscle 10
1.1 References 11
Chapter 2: Assessment of intra-rater reliability of decomposition-based quantitative electromyography (D-QEMG) in flexor carpi radialis muscle
2.0 Introduction 14
2.1 Methods 16
2.1.1 Subjects 16
2.1.2 Electromyographic data collection 16 2.1.3 Electromyographic signal decomposition and analysis 18
2.1.4 Intra-rater reliability 20
2.1.5 Statistics 21
2.2 Results 22
2.2.1 Subjects 22
2.2.2 Data collection results and S-MUP frequency distributions 22 2.2.3 Intra-rater reliability of maximum CMAP, mean S-MUP and
MUNE
25
2.2.4Intra-rater reliability of quantitative, needle-detected MUPs 29
2.3 Discussion 29
2.4 Conclusion 39
vi LIST OF TABLES
Page
Table 1: Subject demographics 23
vii LIST OF FIGURES
Page
Chapter 1
Figure 1: Collateral reinnervation 4
Figure 2: D-QEMG 8
Chapter 2
Figure 3: Frequency distributions of S-MUP data 24 Figure 4: Comparison of maximum CMAP, mean S-MUP and MUNE values over
viii LIST OF APPENDICES
Page
Appendix A: Ethics Approval 43
Appendix B: Letter of Information 44
Appendix C: Rights and Permissions 51
ix LIST OF ABBREVIATIONS
ALS Amyotrophic lateral sclerosis
AP Adductor pollicis
BB Biceps brachii
CMAP Compound muscle action potential
DE-STA Decomposition-enhanced spike triggered averaging
D-QEMG Decomposition-based quantitative electromyography
FCR Flexor carpi radialis
FDI First dorsal interosseous muscle
ICC Intraclass correlation coefficient
ICP Intercarpal joint
IDI Interdischarge interval
MCP Metacarpophalangeal joint
MN Motor neuron
MPS Multiple point stimulation
MU Motor unit
MUNE Motor unit number estimation
MUP Motor unit potential
NCS Nerve conduction study
QEMG Quantitative electromyography
S-MUP Surface motor unit potential
STA Spike-triggered averaging
TA Tibialis anterior
1 Chapter 1.0: General Introduction
1.0.1 Motor neurons and motor units
Neurons are electrically excitable cells that transmit information throughout the
body by electrical and chemical signals. Cortical motor neurons (MNs) are derived from
the motor cortex of the brain and project to the spinal cord. Lower MNs, also referred
to as anterior horn cells, project from the spinal cord to skeletal muscle fibres. A single
alpha motor neuron and all of the muscles fibres it innervates are known collectively as
a motor unit (MU); this term was first defined by Liddell and Sherrington in 1925
(Doherty, Chan, & Brown, 2002; Liddell & Sherrington, 1925). Researchers have been
able to determine how MUs are organized in the spinal cord. The distribution of MUs to
various muscles can be mapped out in schemes called myotomes. There is considerable
overlap in myotomes, as most muscles receive innervation from two to three spinal cord
segments (Doherty et al., 2002). MUs can also be classified by type depending on their
size and function. Slow oxidative MUs innervate small muscle fibres that contract slowly
and generate relatively small forces. Slow MUs are resistant to fatigue and are
important for activities that require sustained contractions (Clamann, 1993; Purves et
al., 2001). Larger alpha motor neurons innervate larger muscle fibres. In larger muscle
fibres mitochondria are less concentrated and it is more difficult to replenish energy,
thus these larger MUs are known as fast fatiguable MUs. Activation of fast fatiguable
MUs results in brief exertions of relatively large force production (Purves et al., 2001).
Intermediate MU types have also been classified, including fast fatigue resistant and fast
fatigue-2
resistant than fast twitch MUs and they generate at least twice the force of slow twitch
MUs (Purves et al., 2001). Knowledge regarding the organization and classification of
MUs can aid clinicians in diagnosing various neuromuscular disorders. Researchers have
long been interested in accurately estimating the number of functional motor neurons in
humans. This would provide a quantifiable method in the study of healthy aging and
diseases affecting the motor neuron or motor axon.
1.0.2 Collateral reinnervation
In normal healthy aging, various morphological changes to the neuromuscular
system take place, leading to a significant loss of strength after the sixth decade of life
(Doherty, 2003; McNeil et al., 2005; Power et al., 2010). One study suggests that
beyond-middle age strength decreases by approximately 15% per decade (Vandervoort
& McComas, 1986). The functional effects of aging can be attributed to many
morphological changes, including a reduction in muscle cross-sectional area, reduction
in the number of muscle fibres and reduction in MU number and size (Lexell &
Vandervoort, 2002; Roos, Rice, & Vandervoort, 1997). Some processes thought to
underlie the degenerative effects on peripheral nerves include loss of myelination,
denervation from repeated trauma, programmed cell death, and muscle disuse (Conwit
& Metter, 2002). Cell death also occurs in certain MN diseases such as amyotrophic
lateral sclerosis (ALS). In both healthy aging and disease, MU loss leads to eventual
muscle atrophy and weakness. When MUs are first lost, neighbouring healthy neurons
compensate by sprouting new axons to regain input to the affected muscle fibres. This
3
the initial period of MU loss degeneration occurs but collateral reinnervation
counteracts loss of function. In fact, 50-90% of MU loss may occur with little or no
apparent weakness (Doherty & Brown, 2002). In these cases, the compound muscle
action potential (CMAP) may be normal or close to normal and routine
electromyography (EMG) studies may not detect MU loss until later stages of
degeneration. In order to detect MU loss with the occurrence of collateral reinnervation,
quantitative EMG is needed to record amplitudes, durations and phases of detected
motor unit potentials (MUPs). If abnormalities are observed along with reduced MU
recruitment, clinicians can be confident that MU loss is occurring.
1.0.3 Motor unit number estimation and incremental stimulation
Motor unit number estimation (MUNE) was first described by Professor A.J.
McComas. McComas and his colleagues studied findings from routine nerve conduction
studies (NCS) (McComas, Fawcett, Campbell, & Sica, 1971). In NCS, the nerve supplying
the muscle under study is stimulated, twitching the muscle and producing a
measureable compound muscle action potential (CMAP). NCS are unable to determine
the number of motor units/axons because of collateral innervation. That is, the size of
the CMAP does not correlate well with the number of contributing MUs (Doherty &
Stashuk, 2003; Doherty & Brown, 2002). McComas and colleagues observed that with
progressive stimulation, the CMAPs increased incrementally with stronger stimuli, as
single motor unit potentials (S-MUPs) were added to the waveform (Gooch et al., 2014).
4
Figure 1: A) Two motor neurons (MNs) are depicted with origins from the anterior horn cross-section of the spinal cord. Their peripheral axons innervate specific fibres of a muscle, depicting two functioning motor units (MUs) [distinguished by black and white shading]. B) One of the MNs dies, leading to loss of innervation to muscle fibres. The second MU is unaffected, as the MN is functioning and the number of innervated fibres remains the same. C) The healthy MU sprouts axons to innervate the muscle fibres associated with the dead MU (grey shading). This increases the size of the healthy MU and preserves the unused muscle fibres. (Modified from Stalberg & Falck, 1997)
A)
B)
5
submaximal CMAP by the number of individual steps. The maximal CMAP represents
the activation of the total motor unit pool. This measure divided by the average S-MUP
size, would therefore estimate the number of functioning motor units. This is the
premise on which MUNE is built; mathematically, MUNE is equal to the maximal CMAP
amplitude divided by the average S-MUP amplitude.
From the paradigm described by McComas et al. arose the incremental
stimulation method of MUNE. As of 2010, this was the most common technique used in
MUNE papers (Gooch et al., 2014). The incremental stimulation method is based on the
assumption that each increment represents the addition of a single MU. However, this
has been challenged due to a phenomenon known as alternation (Gooch et al., 2014).
Researchers became aware that the increments in a growing CMAP waveform could be
the result of two different motor axons alternating in activation at similar depolarization
thresholds (Gooch et al., 2014). In attempt to eliminate this phenomenon, other MUNE
methods have been derived.
1.0.4 Motor unit number estimation techniques
Methods derived after the incremental stimulation method include
multiple-point stimulation (MPS), the F wave response method, the statistical method, and spike
triggered averaging (STA) [which includes decomposition-enhanced (DE) STA] (Doherty &
Brown, 2002). The electrical activity of active MUs is recorded in all methods. The
incremental stimulation method and MPS are based on electrical stimulation of motor
6
need for an easily accessible nerve for percutaneous stimulation. STA and DE-STA are
different from these methods because they draw on the sample of MUs collected
through voluntary contraction, allowing proximal as well as distal muscles to be studied.
1.0.5 Spike-triggered averaging
During STA, an intramuscular electrode records isolated single motor unit
discharges produced by voluntary contraction, while surface electrodes record the
time-locked signal and average it over repeated discharges to extract the associated
surface-recorded S-MUP (Doherty & Brown, 2002; Gooch et al., 2014). The intramuscular needle
is then moved to sample MUPs from different muscle fibres. The average S-MUP is
calculated from these recordings and used in the MUNE equation. Additional data from
the quantitative electromyography (QEMG) recordings can give more information,
including firing rates and the average motor unit action potential (MUP). From the MUP
prototype, characteristics such as amplitude, duration, number of turns and phases can
be assessed. Each characteristic has distinct implications to neuromuscular remodeling
in aging and disease. For example, increased duration correlates to increased number of
muscle fibres from collateral sprouting and/or hypertrophy of muscle fibres (Stashuk &
Brown, 2002). Increased number of phases or turns correlates to loss of muscle fibres,
increased variability among the diameters of muscle fibres of the MU and muscle fiber
reinnervation (Stashuk & Brown, 2002).
While there is high test-retest reliability (Gooch et al., 2014), traditional STA is
7
contraction, smaller MUs are recruited first, followed by larger MUs (Henneman,
Somjen, & Carpenter, 1964). Since STA is employed only at lower voluntary contraction
levels, the MUP size would be biased towards sampling from smaller MUs. Smaller
S-MUPs would therefore give larger, overestimated MUNE values. Additionally, a
considerable amount of time is needed to collect an adequate amount of MUs, with
15-20 MUs requiring more than one hour of collection.
1.0.6 Decomposition-enhanced spike triggered averaging
Decomposition-enhanced STA (DE-STA) was developed to sample a wider range
of MU sizes at higher levels of voluntary contraction, up to 50% of maximum voluntary
force (Doherty & Brown, 2002). A computer algorithm decomposes and extracts
multiple MUPs from a moderate intensity interference pattern. This is collated with
information from the surface EMG waveform to determine the S-MUP corresponding to
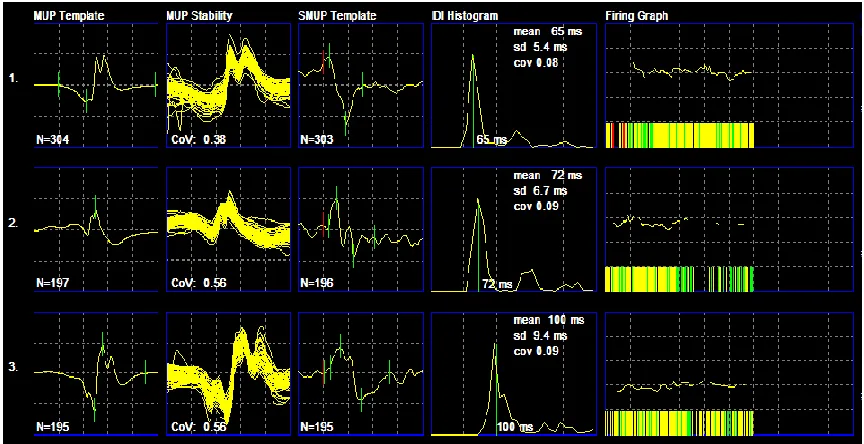
each needle recorded MUP [See Figure 2 for sample output] (Gooch et al., 2014). Both
STA and DE-STA methods are useful because they can sample from both proximal and
distal muscles, as long as a valid CMAP can be obtained (Gooch et al., 2014). They also
provide additional diagnostic and research data not available with other MUNE methods
(i.e. MUP characteristics such as amplitude, duration, and firing pattern). Use of
decomposition-based QEMG (D-QEMG) also makes the process of obtaining S-MUPs
8
9 1.0.7 Conditions studied with motor unit number estimation
Aging has been extensively studied using MUNE in association with measures of
strength to better understand when MU loss begins to affect functional output (Doherty,
2003; McNeil et al., 2005; Power et al., 2010; Roos et al., 1997). MUNE techniques have
also been used to study MU loss, dysfunction and reinnervation in prior polio, spinal
muscular atrophy, Charcot-Marie-Tooth disease, acquired polyneuropathies and
entrapment neuropathies, among other clinical conditions (Gooch et al., 2014). One of
the most extensively studied conditions has been ALS, since the disease is characterized
primarily by MU loss. Upper neuron lesions have also been studied, with several
researchers calculating MUNE of upper limb muscles.
Previous studies have examined reliability of upper limb muscles, including
biceps brachii (BB), first dorsal interosseous (FDI), thenar and hypothenar muscles (Boe,
Stashuk, & Doherty, 2006b; Bromberg, 1993; Doherty & Brown, 1993; Felice, 1995;
Lomen-Hoerth & Olney, 2000; Shefner, Jillapalli, & Bradshaw, 1999). In the past decade,
there has been a shift in how reliability is studied, moving away from the mere
reproducibility of a method within a population, towards clinical reliability within
subjects. Within-subject reliability of D-QEMG was conducted in proximal BB and distal
FDI, with moderate-high intraclass correlation coefficients of 0.97 and 0.72, respectively
(Boe et al., 2006b). Later in an inter-rater study, quantitative data was significantly
different and likely correlated with variability in electrode placement during testing (Boe
10
The current project therefore aimed to investigate a new muscle which would be
anatomically easy to access both in terms of obtaining a maximum CMAP and the
collection of intramuscular and surface EMG data. Flexor carpi radialis was selected as a
new muscle with which to explore intra-rater reliability and generate representative
data for a healthy group of subjects.
1.0.8 Flexor carpi radialis muscle
Flexor carpi radialis (FCR) is located in the anterior compartment of the forearm. It
originates on the medial epicondyle of the humerus, travelling laterally to flexor
digitorum superficialis and inserting at the base of the second metacarpal (Rohen,
Yokochi, & Lutjen-Drecoll, 2011). When the wrist is brought into flexion, the most lateral
tendon observed belongs to FCR. FCR receives blood supply from the radial artery and is
innervated by the median nerve (Rohen et al., 2011). The median nerve has roots from
C5, C6/C7 (lateral cord), and C8/T1 (medial cord), with the lateral cord supplying FCR.
The median nerve travels along the arm between biceps brachii and brachialis,
innervates the forearm muscles including FCR, then divides into anterior and posterior
branches as it enters the hand (Rohen et al., 2011).
FCR is an appropriate muscle to study with D-QEMG because it is superficial and
can be easily accessed with an intramuscular needle with minimal discomfort. The
median nerve is also easy to stimulate to obtain a CMAP. By validating MUNE in the FCR
of healthy individuals, this muscle can then be further explored in aging or
11
involvement as an index C7 muscle in radiculopathy. No previous MUNE studies have
examined this muscle.
1.1 References
Boe, S. G., Antonowicz, N. M., Leung, V. W., Shea, S. M., Zimmerman, T. C., & Doherty, T. J. (2010). High inter-rater reliability in analyzing results of decomposition-based
quantitative electromyography in subjects with or without neuromuscular disorder. Journal of Neuroscience Methods, 192(1), 138–45.
Boe, S. G., Stashuk, D. W., & Doherty, T. J. (2006). Within-subject reliability of motor unit number estimates and quantitative motor unit analysis in a distal and proximal upper limb muscle. Clinical Neurophysiology, 117(3), 596–603.
Bromberg, M. B. (1993). Motor unit estimation: Reproducibility of the spike‐triggered averaging technique in normal and ALS subjects. Muscle & Nerve, 16(5), 466 – 471.
Clamann, H. P. (1993). Motor unit recruitment and the gradation of muscle force. Physical Therapy, 73(12), 830–843.
Conwit, R. A., & Metter, E. J. (2002). Age-Related Changes in Peripheral and Central Conduction. In W. F. Brown, C. F. Bolton, & M. J. Aminoff (Eds.), Neuromuscular Function and Disease: Basic, Clinical, and Electrodiagnostic Aspects (1st ed., pp. 602–617).
Philadelphia: WB Saunders.
Doherty, T. J. (2003). Invited review: Aging and sarcopenia. Journal of Applied Physiology, 95(4), 1717–27.
Doherty, T. J., & Brown, W. F. (1993). The estimated numbers and relative sizes of thenar motor units as selected by multiple point stimulation in young and older adults. Muscle & Nerve, 16(4), 355–66.
Doherty, T. J., & Brown, W. F. (2002). Motor Unit Number Estimation: Methods and Applications. In W. F. Brown, C. F. Bolton, & M. J. Aminoff (Eds.), Neuromuscular Function and Disease: Basic, Clinical, and Electrodiagnostic Aspects2 (1st ed., pp. 274– 290). Philadelphia: W.B. Saunders Company.
12
Neuromuscular Function and Disease: Basic, Clinical, and Electrodiagnostic Aspects (1st ed., pp. 247–273). Philadelphia: W.B. Saunders Company.
Doherty, T. J., & Stashuk, D. W. (2003). Decomposition-based quantitative
electromyography: methods and initial normative data in five muscles. Muscle & Nerve, 28(2), 204–11.
Felice, K. J. (1995). Thenar motor unit number estimates using the multiple point stimulation technique: reproducibility studies in ALS patients and normal subjects. Muscle & Nerve, 18(12), 1412–6.
Gooch, C. L., Doherty, T. J., Chan, K. M., Bromberg, M. B., Lewis, R. A., Stashuk, D. W., Berger, M. J., Andary, M. T., Daube, J. R. (2014). Motor unit number estimation: A technology and literature review. Muscle & Nerve, 50(6), 884 – 893.
Henneman, E., Somjen, G., & Carpenter, D. O. (1964). Functional Significance of Cell Size in Spinal Motoneurons. Journal of Neurophysiology, 28(3), 560–580.
Lexell, J., & Vandervoort, A. A. (2002). Age-Related Changes in the Neuromuscular
System. In W. F. Brown, C. F. Bolton, & M. J. Aminoff (Eds.), Neuromuscular Function and Disease: Basic, Clinical, and Electrodiagnostic Aspects (1st ed., pp. 591–601).
Philadelphia: WB Saunders.
Liddell, E. G. T., & Sherrington, C. S. (1925). Recruitment and some other features of reflex inhibition. Proceedings of the Royal Society of London. Series B, Containing Papers of a Biological Character, 97(686), 488–518.
Lomen-Hoerth, C., & Olney, R. K. (2000). Comparison of multiple point and statistical motor unit number estimation. Muscle & Nerve, 23(10), 1525–33.
McComas, A. J., Fawcett, P. R. W., Campbell, M. J., & Sica, R. E. P. (1971).
Electrophysiologal estimation of the number of motor units within a human muscle. Journal of Neurology, Neurosurgery, and Psychiatry, 34, 121–131.
McNeil, C. J., Doherty, T. J., Stashuk, D. W., & Rice, C. L. (2005). Motor unit number estimates in the tibialis anterior muscle of young, old, and very old men. Muscle & Nerve, 31(4), 461–7.
13
Purves, D., Augustine, G. J., Fitzpatrick, D., Katz, L. C., LaMantia, A.-S., McNamara, J. O., & Williams, S. M. (2001). The Motor Unit. In Neuroscience (2nd ed.). Sunderland, MA: Sinauer Associates.
Rohen, J. W., Yokochi, C., & Lutjen-Drecoll, E. (2011). Color Atlas of Anatomy. (7th, Ed.) (pp. 186, 373, 388–402). Stuttgart: Schattauer.
Roos, M. R., Rice, C. L., & Vandervoort, A. A. (1997). Age-related changes in motor unit function. Muscle & Nerve, 20(6), 679 – 690.
Shefner, J. M., Jillapalli, D., & Bradshaw, D. Y. (1999). Reducing intersubject variability in motor unit number estimation. Muscle & Nerve, 22(10), 1457–60.
Stalberg, E., & Falck, B. (1997). The role of electromyography in neurology. Electroencephalography and Clinical Neurophysiology, 103(6), 579–598.
Stashuk, D. W., & Brown, W. F. (2002). Quantitative Electromyography. In W. F. Brown, C. F. Bolton, & M. J. Aminoff (Eds.), Neuromuscular Function and Disease: Basic, Clinical, and Electrodiagnostic Aspects2 (1st ed., pp. 311–348). Philadelphia: WB Saunders.
14 Chapter 2: Assessment of intra-rater reliability of decomposition-based quantitative
electromyography (D-QEMG) in flexor carpi radialis (FCR) muscle.
2.0 Introduction
Motor unit (MU) loss is a characteristic observed in aging and many acute or
progressive neuromuscular disorders. Collateral reinnervation is the process which
attempts to counteract MU loss. In this process, healthy motor axons sprout new axons
to reinnervate orphaned muscles fibres. Collateral reinnervation is able to preserve
muscle function up until a critical threshold of MU loss (Doherty & Brown, 2002;
McComas et al., 1971; Stalberg & Falck, 1997). Motor unit number estimation (MUNE) is
a technique used to quantify the number of functioning motor units within a muscle
using electrophysiological techniques (McComas et al., 1971). MUNE is dependent on
determining the total electrical size of the muscle, by supramaximal stimulation to the
nerve, resulting in the maximum compound action potential (CMAP). Then, the average
surface motor unit potential (S-MUP) is calculated, representing the average size of a
single MU. By dividing the maximum CMAP by the average S-MUP, an estimation of the
number of functioning motor units can be obtained (Gooch et al., 2014). MUNE is a
unique measurement because it takes into account the effects of collateral
reinnervation by incorporating the mean S-MUP (McComas et al., 1971). This gives
MUNE an advantage over traditional measures of EMG and nerve conduction, as well as
15
Decomposition-based quantitative electromyography (D-QEMG) uses computer
algorithms for MU analysis and decomposition-enhanced spike-triggered averaging
(DE-STA) MUNE (Stashuk, 1999). D-QEMG not only provides estimates of MU number, but it
measures physiological MU properties not assessed in other methods. Additionally,
DE-STA MUNE can sample from distal and proximal muscles, as long as a valid CMAP can be
obtained (Gooch et al., 2014).
Flexor carpi radialis (FCR) is a wrist flexor in the forearm which has not yet been
studied in D-QEMG in the literature. FCR receives innervation from nerve roots C6-C7,
and is therefore frequently implicated in radiculopathies. By establishing a set of
representative data for FCR in healthy individuals, further studies may quantify FCR
MUNE in individuals with clinical disorders affecting this muscle. Additionally, an
important aspect of a measurement tool is that the results are reproducible by the same
examiner at two different time points (Portney & Watkins, 2008). Therefore the
intra-rater reliability of FCR must be studied in order to assess reproducibility and the
inherent variability of the technique.
Intra-rater reliability of DE-STA MUNE has been established in thenar, first dorsal
interosseous, biceps brachii, upper trapezius, and extensor carpi radialis muscles (Boe,
Dalton, Harwood, Doherty, & Rice, 2009; Boe, Stashuk, & Doherty, 2004, 2006a; Calder,
Agnew, Stashuk, & McLean, 2008; Ives & Doherty, 2012). The purpose of this study is to
establish a set of representative data and determine the intra-rater reliability of DE-STA
16 2.1 Methods
2.1.1 Subjects
Twenty subjects (9 females, 11 males) aged 21-51 (29 ± 11) with no self-reported
neuromuscular or musculoskeletal disease volunteered to participate in the study. All
20 subjects successfully completed the test-retest portion of the study. Three subjects
did not complete the third trial involving an altered contraction strategy. All subjects
gave written, informed consent in accordance with The University of Western Ontario
Health Sciences Research Ethics Board, which approved this study [see Appendix A].
2.1.2 Electromyographic data collection
EMG signals were collected using a Viking System (Natus Medical Incorporated,
San Carlos, CA). Signals were then exported and analyzed with D-QEMG (Version 3.4).
Self-adhering Silver Mactrode© electrodes (GE Medical Systems, Milwaukee, WI) were
used to detect surface signals and 25mm x 30 gauge disposable concentric needle
electrodes (TECA™ Elite, CareFusion, Middleton, WI) were used to detect intramuscular
signals. Surface EMG was collected with a bandpass of 5 Hz by 5 KHz and needle EMG
with a bandpass of 10Hz to 10 KHz.
Testing was conducted unilaterally in the subject’s dominant forearm, which was
the right forearm in every subject. Participants were seated upright on an examination
table with their forearm relaxed and supine on their lap. The hand and forearm was
17
The foam support functioned to minimize movement of the hand. One strap secured
the palm of each subject, and another strap was positioned across the distal forearm.
The foam support did not function to completely immobilize the hand and forearm; it
served as a reminder to each subject to contract isometrically and isolate the wrist flexor
group as much as possible. Surface electrodes were cut in strips (1 cm x 3.5 cm) for
active and reference electrodes. The ground electrode was full-sized (2 cm by 3.5 cm).
Skin was cleansed with 70% isopropyl alcohol wipes prior to adherence of surface
electrodes. The reference electrode was placed over the styloid process of the ulna; the
ground electrode was placed distal to the anterior surface of the elbow joint; and the
active electrode was placed transversally over the FCR muscle belly, approximately
mid-forearm and medially.
A hand-held bipolar stimulator was used to elicit a maximum compound muscle
action potential (CMAP), by exciting the median nerve on the medial arm at the
antecubital fossa. The active electrode was repositioned over the belly of FCR in order
to maximize the negative peak amplitude and minimize the rise time of the CMAP. The
median nerve was gradually stimulated until the CMAP reached a plateau, then the
electrodes were secured with surgical tape.
Next, a concentric needle electrode was inserted into the FCR muscle near the
active surface electrode. Participants were asked to perform a series of 30-second
isometric, submaximal wrist flexion contractions during which intramuscular needle and
surface EMG data were collected simultaneously. Contractions were moderate
18
second (pps). Visual feedback from the computer screen allowed subjects to maintain
the contraction at the appropriate intensity. The experimenter also gave verbal
feedback to subjects, with cues to initiate a contraction, alter contraction strength, and
terminate the contraction. Contractions were repeated 5-7 times with 30-60 second
rest periods in between. The needle was removed and reinserted every 2-3 contractions
in order to sample from different MUs. Depth and/or orientation was adjusted after
each contraction. Contractions were performed until a minimum of 20 valid MUP trains
were collected for each trial. In pilot studies, there was concern that active finger
flexion during wrist flexion contraction may alter results. If the other forearm muscles
were activated distant from the surface electrode, this could contaminate the recorded
activity from FCR and decrease the ability to extract FCR S-MUPs. In order to test this
theory, three trials were performed. Trial A and trial B occurred with the hand open and
interphalangeal (IP) and metacarpophalangeal (MCP) joints held straight during wrist
flexion. Trial C explored wrist flexion while fingers were flexed (with flexed IP and MCP
joints).
2.1.3 Electromyographic signal decomposition and analysis
Upon completion of the data collection, the signals were analyzed using the
D-QEMG software. The complex signal derived from the needle EMG was decomposed into
its constituent MUP trains using computer algorithms described previously (Boe,
Stashuk, & Doherty, 2004; Doherty & Stashuk, 2003; Stashuk, 1999). MUPs were first
detected from the needle EMG signal based on amplitude and slope criteria (Stashuk,
19
MUs based on their shape. Then, supervised clustering algorithms used information
from the clustered MUPs to determine the identity of any MUPs left unclassified from
the unsupervised clustering (Stashuk, 1999). Finally, the firing rates of the clustered
MUs were assessed to ensure that MUPs belonging to different MUs fired at the same
time occasionally, and MUPs belonging to the same MU never fired simultaneously
(Stashuk, 1999). MUPs collected by the intramuscular needle were time-locked to the
surface EMG signal, allowing the S-MUP to be extracted for each associated MUP
through spike-triggered averaging.
Once extracted, MUPs were included or excluded based on specific criteria. Any
MUPs failing to meet the criteria were excluded from further analysis (Boe, Stashuk,
Brown, & Doherty, 2005; Boe et al., 2004). First, a minimum of 51 discharges were
required for MUP trains. Second, MUPs were required to display consistent firing rates
as expressed by Gaussian distribution of the main peak in the inter-discharge interval
(IDI) histogram, and a coefficient of variation less than 0.3 (Fuglevand, Winter, & Patla,
1993; Stashuk, 1999). Assessment of the instantaneous firing rate plot also helped
determine whether or not trains were consistent and within physiological range. Third,
MUPs were assessed for the presence of cannula potentials, a mainly positive potential
created by recording the cannula of the needle. Cannula potentials were excluded
because they contain different detection characteristics from the core detection surface
and have less high-frequency energy (Stashuk & Doherty, 2002). However, cannula
potentials still serve as an accurate trigger-point for surface signals, so the associated
20
which were labelled by the program as “disparate” were visually inspected. A pair of
“disparate” trains were detected if they never fired simultaneously and were therefore
potentially derived from the same MU. If the two trains were deemed very similar upon
visual inspection, the MUP train with fewer discharges was excluded from further
analysis. Upon meeting the necessary criteria the onset, positive peak, negative peak
and end markers of the MUPs were visually inspected and repositioned if necessary.
The same visual inspection was done for the negative onset, negative peak and positive
peak S-MUP markers.
Automatic descriptive MUP and S-MUP statistics were generated by D-QEMG.
The average S-MUPs were calculated by data-point averaging of accepted S-MUPs
aligned by the onset markers. This negative peak amplitude of the average S-MUP was
then divided into the negative peak amplitude of the maximal CMAP to obtain the
MUNE.
2.1.4 Intra-rater reliability
The experimental protocol and data analysis was performed three times by the
same evaluator (S.T.) for each subject. All tests occurred on the same day for each
subject. Following completion of the first test (trial A), all electrodes were removed and,
after a 5-10 minute break, a new set of electrodes was applied for the repeat test (trial
B). After trial B, electrodes were removed and following a 5-10 minute break, a new set
of electrodes was applied for trial C. This third trial involved flexion of interphalangeal
21
were not marked for the first test, ensuring that the electrode placement for subsequent
tests were independent of the first test. The experimenter was blinded to the results of
all three tests until all data collection was complete (Boe et al., 2004, 2006b; Ives &
Doherty, 2012).
2.1.5 Statistics
All statistics were analyzed using IBM® SPSS® Statistics (Version 22, SPSS
Incorporated, Chicago, IL). Mean values and their standard deviations are presented
throughout. Relative intra-rater reliability was assessed with a two-way mixed model of
the single measures intraclass correlation coefficient (ICC), assessing for consistency.
ICC was considered low if <0.50, moderate if between 0.50 and 0.75, and high if >0.75
(Portney & Watkins, 2008).
In addition to the ICC, the standard error of measurement (SEM) was calculated
as a measure of absolute intra-rater reliability for maximum CMAP, mean S-MUP and
MUNE values. The SEM represents the amount of variation expected if the same subject
were tested numerous times in a single-testing session (Hopkins, 2000). The SEM
calculation is depicted in equation 1:
SEM = SD / √ 2 (Eq 1)
Where SEM, standard error of measurement; SD, standard deviation of the difference
22
The mean percent difference was also calculated for intra-rater maximum CMAP,
mean S-MUP, and MUNE values, depicted as equation 2 (Boe, Stashuk, & Doherty, 2006;
Ives & Doherty, 2012, 2014).
Mean % difference = ∑ { |x₁ - x₂| / [|x₁ +x₂| / 2] } /n*100 (Eq 2)
Where x₁, subject’s observed value for test 1; x₂, subject’s observed value for test 2; n,
number of subjects.
A repeated measures analysis of variance (ANOVA) was used to determine if
there were significant differences in measurements within each subject between trials.
Bonferroni post hoc tests were used to interpret any significant findings. An alpha level
of p < 0.05 used to denote significance in all cases.
2.2 Results
2.2.1 Subjects
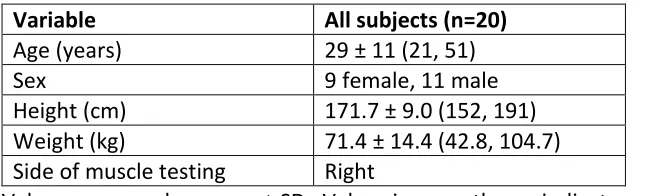
A summary of subject demographic data is found in Table 1.
2.2.2 Data collection results and S-MUP frequency distributions
On average, 25 ± 3, 25 ± 3 and 24 ± 3 acceptable S-MUPs were obtained for each
subject from 5 ± 1, 5 ± 1 and 4 ± 1 contractions for trial A, B and C respectively.
Therefore each trial collected an average of 5 ± 1 acceptable S-MUPs per contraction.
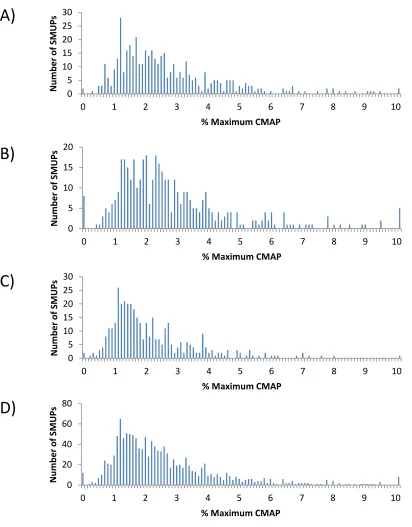
Subjects 1, 3 and 4 did not undergo trial C. The frequency distributions of S-MUP data
23
Table 1: Subject demographics
Variable All subjects (n=20)
Age (years) 29 ± 11 (21, 51)
Sex 9 female, 11 male
Height (cm) 171.7 ± 9.0 (152, 191) Weight (kg) 71.4 ± 14.4 (42.8, 104.7) Side of muscle testing Right
24
Figure 3: Frequency distributions of MUP data from all subjects for trial A (446 S-MUPs) (A), trial B (433 S-MUPS) (B), trial C (383 S-MUPS) (C), and pooled across all three trials (1262 S-MUPS) (D). The negative peak amplitudes of the S-MUPs have been normalized to the maximum CMAP for each subject.
A)
0 5 10 15 200 1 2 3 4 5 6 7 8 9 10
N u m b e r o f SMUPs
% Maximum CMAP
B)
0 5 10 15 20 25 300 1 2 3 4 5 6 7 8 9 10
N u m b e r o f SMUPs
% Maximum CMAP
0 5 10 15 20 25 30
0 1 2 3 4 5 6 7 8 9 10
N u m b e r o f SMUPs
% Maximum CMAP
C)
0 20 40 60 800 1 2 3 4 5 6 7 8 9 10
N u m b e r o f SMUPs
% Maximum CMAP
25
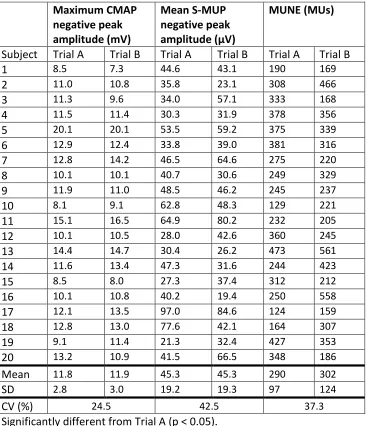
124 and 376 ± 154 MUs, respectively. Values for the first two trials are presented in
Table 2 for maximum CMAP, mean S-MUP and MUNE values, and in Table 3 for
quantitative needle-detected MUP parameters.
2.2.3 Intra-rater reliability of maximum CMAP, mean S-MUP and MUNE
The single measures ICC was selected for analysis because a single rater (S.T.)
performed all tests. Single measures ICC produces a slightly lower value than the
average measures ICC, which is a model that attempts to average across multiple raters.
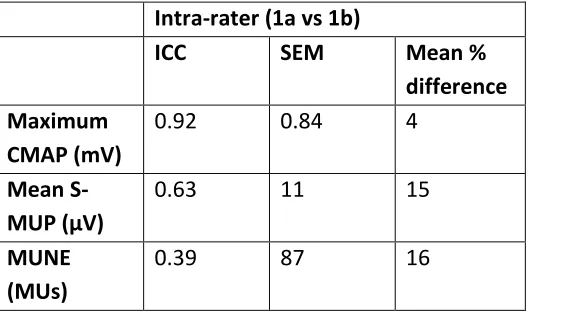
Analysis using the single measures ICC revealed high reliability for maximum CMAP (ICC
= 0.92), moderate reliability for mean S-MUP (ICC = 0.63) and low reliability for MUNE
(ICC = 0.39) between trials A and B. The SEMs for maximum CMAP, mean S-MUP and
MUNE were 0.84 mV, 11 µV and 87 MUs, respectively. The mean percent differences
were highest for MUNE and mean S-MUP (16% and 15%, respectively) and much lower
for maximum CMAP (4%). Coefficients of variation are also presented in Table 2.
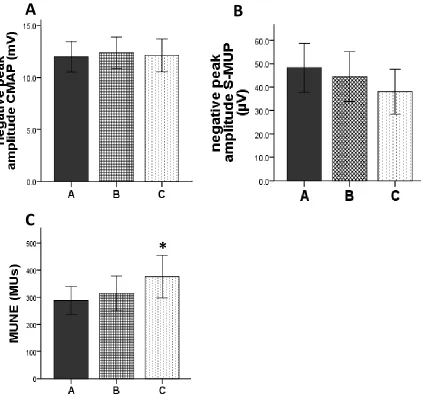
Repeated measures ANOVA for maximum CMAP in trials A, B and C assumed
sphericity (p = 0.367) and found no significant differences (p = 0.299). The repeated
measures one-way ANOVA test for MUNE met the assumption of sphericity (p = 0.948)
and reported a significant difference between measures (p = 0.018). Bonferroni
post-hoc tests showed a significant difference between trials A and C (p = 0.035), but no
significant differences between trials B and C (p = 0.139) or trial A and B (p = 1.00).
Repeated measures ANOVA for mean S-MUP in trials A, B and C assumed sphericity (p =
26
Table 2: Maximum CMAP, mean S-MUP and MUNE values for trials A and B.
Maximum CMAP negative peak amplitude (mV) Mean S-MUP negative peak amplitude (µV) MUNE (MUs)
Subject Trial A Trial B Trial A Trial B Trial A Trial B
1 8.5 7.3 44.6 43.1 190 169
2 11.0 10.8 35.8 23.1 308 466
3 11.3 9.6 34.0 57.1 333 168
4 11.5 11.4 30.3 31.9 378 356
5 20.1 20.1 53.5 59.2 375 339
6 12.9 12.4 33.8 39.0 381 316
7 12.8 14.2 46.5 64.6 275 220
8 10.1 10.1 40.7 30.6 249 329
9 11.9 11.0 48.5 46.2 245 237
10 8.1 9.1 62.8 48.3 129 221
11 15.1 16.5 64.9 80.2 232 205
12 10.1 10.5 28.0 42.6 360 245
13 14.4 14.7 30.4 26.2 473 561
14 11.6 13.4 47.3 31.6 244 423
15 8.5 8.0 27.3 37.4 312 212
16 10.1 10.8 40.2 19.4 250 558
17 12.1 13.5 97.0 84.6 124 159
18 12.8 13.0 77.6 42.1 164 307
19 9.1 11.4 21.3 32.4 427 353
20 13.2 10.9 41.5 66.5 348 186
Mean 11.8 11.9 45.3 45.3 290 302
SD 2.8 3.0 19.2 19.3 97 124
CV (%) 24.5 42.5 37.3
a Significantly different from Trial A (p < 0.05).
27
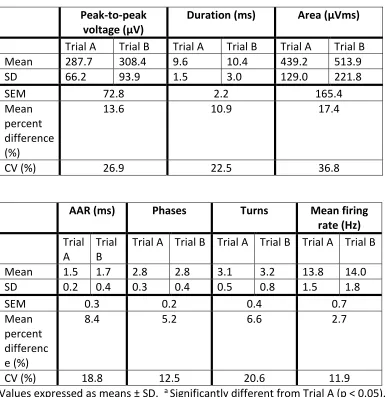
Table 3: Quantitative, needle-detected MUP parameter values for trials A and B
Peak-to-peak voltage (µV)
Duration (ms) Area (µVms)
Trial A Trial B Trial A Trial B Trial A Trial B Mean 287.7 308.4 9.6 10.4 439.2 513.9 SD 66.2 93.9 1.5 3.0 129.0 221.8
SEM 72.8 2.2 165.4
Mean percent difference (%)
13.6 10.9 17.4
CV (%) 26.9 22.5 36.8
AAR (ms) Phases Turns Mean firing
rate (Hz)
Trial A
Trial B
Trial A Trial B Trial A Trial B Trial A Trial B
Mean 1.5 1.7 2.8 2.8 3.1 3.2 13.8 14.0 SD 0.2 0.4 0.3 0.4 0.5 0.8 1.5 1.8
SEM 0.3 0.2 0.4 0.7
Mean percent differenc e (%)
8.4 5.2 6.6 2.7
CV (%) 18.8 12.5 20.6 11.9
Values expressed as means ± SD. a Significantly different from Trial A (p < 0.05).
28
Figure 4: Comparison of maximum CMAP (A), mean S-MUP (B) and MUNE (C) values over the three trials. Error bars denote 95% confidence intervals. * denotes statistical
significance from trial A (p < 0.05).
Abbreviations: CMAP, compound muscle action potential; MUNE, motor unit number estimation; S-MUP, surface-detected motor unit potential.
A
)
B
)
C
29
Analysis using the single measures ICC revealed high reliability for maximum
CMAP (ICC = 0.92), and moderate reliability for mean S-MUP (ICC = 0.63) and MUNE (ICC
= 0.39) between trials A and C. The SEMs for maximum CMAP, mean S-MUP and MUNE
were 0.84 mV, 11 µV and 87 MUs, respectively. The highest mean percent differences
were MUNE and S-MUP (16% and 15%, respectively), and much lower for maximum
CMAP (4%)
2.2.4 Intra-rater reliability of quantitative, needle-detected MUPs
Analysis using the single measures ICC revealed the highest level of reliability for
mean firing rate in trials A and B (ICC = 0.84). The ICC values of the other MUP
parameters were potentially inaccurate due to insufficient between-subject
heterogeneity (Portney & Watkins, 2008). For example, the number of phases and turns
would have inaccurate ICCs because all the data ranged between 2 and 6. This does not
present enough variability to produce an accurate ICC which is dependent on a larger
spread of data.
The SEMs, mean percent differences and coefficients of variation are presented
in Table 3. The repeated measures one-way ANOVA found no significant findings for any
of the MUP parameters (p > 0.05 for all parameters).
2.3 Discussion
The purpose of this study was to explore the use of DE-STA in FCR to establish
30
Electrophysiological properties of MUs and the size of the MU pool was established in
FCR of healthy subjects aged 21-51 using DE-STA. When collected by the same examiner
at two different time points, values for FCR exhibited high reliability for maximum CMAP
(ICC = 0.92), moderate reliability for mean S-MUP (ICC = 0.63) and low reliability for
MUNE (ICC = 0.39) (see Table 4). No differences in maximum CMAP, mean S-MUP,
MUNE or MUP parameters were found between trials A and B (p > 0.05). There were
however, differences in MUNE between trials A and C (p = 0.035), indicating that finger
flexion during wrist contraction produced different results when compared to wrist
flexion alone.
In order for DE-STA MUNE in FCR to be useful as a potential outcome measure, it
must generate reliable results. The maximum CMAP values were very reliable, with a
mean percent difference of just 4% between trials A and B and an ICC of 0.92. These
values are consistent with test-retest reliability data from other muscles (see Table 5)
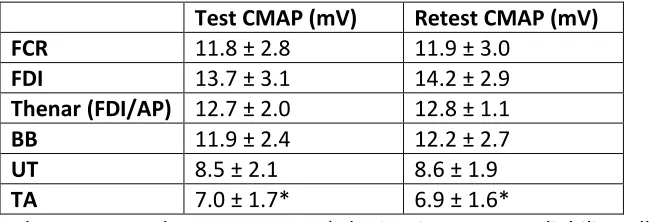
(Boe et al., 2009; Boe et al., 2004, 2006; Ives & Doherty, 2012). Specifically, FCR CMAP
of 11.8 ± 2.8 mV was very similar to other upper limb muscles, including first dorsal
interosseous (13.7 ± 3.1 mV), thenar muscles (12.7 ± 2.0 mV) and biceps brachii (11.9 ±
2.4 mV) (Boe et al., 2009; Boe et al., 2004, 2006). Maximum CMAPs are not directly
comparable between different muscles, due to differences in MU size and motor nerve
stimulation. However, the observed similarities outlined in Table 5 serve to strengthen
the results for this study. Studies in biceps brachii have documented difficulties in
activation of all MUs and volume conduction of nearby muscles, potentially affecting the
31
Table 4: Reliability of maximum CMAP, mean S-MUP and MUNE
Intra-rater (1a vs 1b)
ICC SEM Mean %
difference Maximum
CMAP (mV)
0.92 0.84 4
Mean S-MUP (µV)
0.63 11 15
MUNE (MUs)
0.39 87 16
32
Table 5: Test-retest data for DE-STA CMAP in FCR and other muscles
Test CMAP (mV) Retest CMAP (mV) FCR 11.8 ± 2.8 11.9 ± 3.0
FDI 13.7 ± 3.1 14.2 ± 2.9
Thenar (FDI/AP) 12.7 ± 2.0 12.8 ± 1.1
BB 11.9 ± 2.4 12.2 ± 2.7
UT 8.5 ± 2.1 8.6 ± 1.9
TA 7.0 ± 1.7* 6.9 ± 1.6*
Values expressed as means ± SD. * depicts inter-rater reliability, all others are intra-rater
reliability. Abbreviations: DE-STA, decomposition-enhanced spike triggered averaging;
MU, motor unit; MUNE, motor unit number estimation. Information retrieved from Boe
et al., 2009; Boe et al., 2004, 2006; Ives & Doherty, 2012.
Abbreviations: AP, adductor pollicis, BB, biceps brachii; CMAP, compound muscle action
potential; DE-STA, decomposition-enhanced spike triggered averaging; FCR, flexor carpi
33
CMAP in FCR, and consistent results were obtained from a technician with minimal
training and experience.
Reliability of mean S-MUP data was found to be moderate (ICC = 0.63). The
greater amount of variability within-subjects compared to maximum CMAP data may be
a result of differences in needle data (i.e. depth and position) as well as contraction
intensity between trials A and B. Based on Henneman’s size principle, a consistent
contraction intensity ensures that MUs of similar sizes are recruited for analysis
(Doherty & Brown, 2002). If the average contraction intensity differed between trials,
the size of S-MUPs sampled could be different between groups, potentially affecting the
mean S-MUPs and contributing to decreased within-subject reliability. It is also possible
that the quality of the averaging of the S-MUPs was not consistent. Despite the
variability compared to maximum CMAP results, an ICC of 0.63 is within a moderate and
acceptable range. At 15%, the mean percent difference for mean S-MUP was higher
than maximum CMAP (see Table 4). This value is an appropriate result, as it lies
between mean percent difference results for upper trapezius (31%) and biceps brachii
(8%) in previous intra-rater reliability studies (Boe et al., 2006; Ives & Doherty, 2012).
The large number of small S-MUPs seen in the frequency histograms (Figure 3) is
consistent with previous findings in other muscles such as upper trapezius (UT) and hand
muscles (Boe et al., 2004; Ives & Doherty, 2012) and in other MUNE techniques in
various muscles (Bromberg & Abrams, 1995; Doherty & Brown, 1993). It appears that
there may have been a slight shift to the left in Figure 3C indicating a greater proportion
34
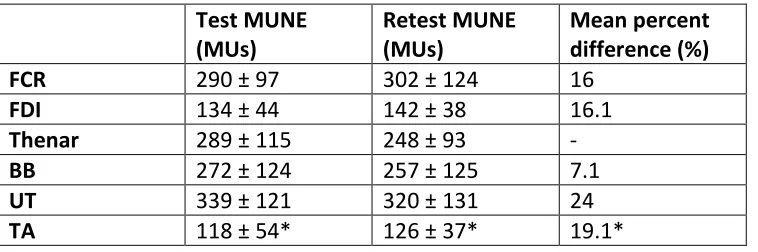
Mean MUNE values for FCR or more accurately, for the median innervated
forearm muscles, were 290 ± 97 and 302 ± 124 MUs in trials A and B. Functionally
speaking, these results are as expected, given the similar DE-STA MUNE values of 272
MUs in biceps brachii (BB), 167 MUs in first dorsal interosseous (FDI) and 153 MUs in
tibialis anterior (TA) muscles (Gooch et al., 2014). BB is a more proximal muscle,
functioning to flex and supinate the forearm, although it does not produce as much
force as brachialis. BB is a larger muscle than FCR, but it is well known that a larger
muscle does not correlate with a considerably larger MUNE (Doherty & Brown, 2002).
This likely reflects the larger innervation ratio in larger, more proximal muscles (Doherty
& Brown, 2002). It would therefore make sense that BB has a similar MUNE to the
median forearm (i.e. FCR). FDI, while smaller than FCR, is needed for more precise
movements to assist in thumb adduction and rotate the index finger slightly. Therefore
it is logical that FDI would have a slightly smaller MUNE than FCR. TA is a lower limb
muscle responsible for dorsiflexion and inversion of the foot. TA has a small innervation
ratio of 329, compared to other distal lower limb muscles in its surroundings (e.g.
gastrocnemius with an innervation ratio of 2000) (Campbell & DeJong, 2005). Given this
information, it may make sense that TA MUNE is smaller than median forearm MUNE.
A great degree of variability between subjects was found for FCR MUNE values,
ranging from 124 to 561 MUs. Anatomical estimates of the number of MUs in FCR could
not be located in the literature for direct comparison, but considerable between-subject
variability using DE-STA from D-QEMG has been reported previously in tibialis anterior
35
Stashuk, & Doherty, 2007; Boe, Dalton, Harwood, Doherty, & Rice, 2009; Ives & Doherty,
2012). The data for FCR from DE-STA MUNE was comparable to results from
within-subject reliability studies of other muscles (see Table 6). The low reliability measured in
the ICC of MUNE could be a reflection of the lack of variability in the data. It is known
that the ICC calculates values most accurately when there is adequate heterogeneity of
data (Portney & Watkins, 2008). If a margin is too small, the ICC will project to a very
low and sometimes even negative value. Too little variability is suspected in the case of
MUNE, especially considering the high and moderate reliability of its constituents, CMAP
and S-MUP (ICC = 0.92, 0.63, respectively). The mean percent difference for MUNE in
FCR was 16% and similar to those found in upper trapezius (24%) and first dorsal
interosseous (16%) muscles, and somewhat higher than biceps brachii (8%) (Boe et al.,
2006; Ives & Doherty, 2012).
Furthermore, the significant difference in MUNE between trials A and C (p =
0.035) provides insight into the need for consistent study protocols which define the
activation of muscles under study. Gehrmann and colleagues measured wrist range of
motion with fingers unconstrained compared to a closed-fist position. A 27% reduction
in wrist range of motion was observed in the closed-fist group compared to the
unconstrained group, indicating that finger position significantly affects wrist range of
motion (Gehrmann, Kaufmann, & Li, 2008). This study sought to determine if the
reduction in wrist range of motion may be coupled with a reduction in activation of the
wrist flexor group. Additional research demonstrated that the fingers flex the most in
36
Table 6: Test-retest reliability of DE-STA MUNE in FCR and other muscles
Test MUNE (MUs)
Retest MUNE (MUs)
Mean percent difference (%) FCR 290 ± 97 302 ± 124 16
FDI 134 ± 44 142 ± 38 16.1
Thenar 289 ± 115 248 ± 93 -
BB 272 ± 124 257 ± 125 7.1
UT 339 ± 121 320 ± 131 24
TA 118 ± 54* 126 ± 37* 19.1*
Values expressed as means ± SD. * from a study of inter-rater reliability, all others are
intra-rater reliability. Information adapted from Boe et al., 2009; Boe et al., 2004, 2006;
Ives & Doherty, 2012.
Abbreviations: BB, biceps brachii; DE-STA, decomposition-enhanced spike triggered
averaging; FCR, flexor carpi radialis; FDI, first dorsal interosseous; MU, motor unit;
37
Since the greatest finger flexion occurs in a supine position, this forearm position was
chosen in the current study to make it easiest to detect any potential differences in
DE-STA MUNE when the wrist was flexed with closed-fist versus open hand with neutral
metacarpophalangeal (MCP) and interphalangeal joints (IP). Results determined
significantly smaller S-MUPs in wrist flexion with flexed MCP and IP joints (i.e. a
closed-fist) compared to wrist flexion alone. A lower mean S-MUP may not be surprising, given
that activation of more distant muscles would take away from activity near the surface
electrode located over FCR, reducing the ability to extract FCR S-MUPs. The lower mean
S-MUP would bias results towards a higher MUNE. It is therefore important that
researchers maintain strict study protocols and educate study participants in proper
contraction positions in order to achieve consistent data collection and draw
appropriate conclusions.
Certain limitations in this study include the small sample size, potential variation
in contractions between subjects, needle position during data collection, and limited
between-subject heterogeneity. First, there was a relatively small number of
participants in this study (n = 20), making it difficult to observe normal distribution for
DE-STA MUNE in FCR. More participants would be required to better understand the
normal range of MUNE in this muscle. However, this study has a relatively large sample
size compared to other reliability studies which used the DE-STA technique, often with
10 or fewer participants (Boe et al., 2006; Calder et al., 2008; Ives & Doherty, 2012). It is
also important to note that smaller sample sizes are acceptable when studying
38
which may seem to bias results towards younger individuals. It is commonly known that
neuromuscular changes associated with aging are not seen until the sixth decade of life
(Doherty, 2003; McNeil et al., 2005; Power et al., 2012). Therefore a subject in their 30s
or 40s should be expected to yield results which are comparable to a subject in their 20s.
Second, it is possible that certain subjects did not perform the ideal voluntary
contraction to isolate the wrist flexors during data collection. Each subject was trained
in how to flex the wrist with minimal contraction of other muscle groups such as the
fingers (in trials A and B) or biceps brachii. The study protocol also attempted to control
for levels of voluntary contraction through the use of a wrist and forearm brace and
verbal cues from the technician. However, slight differences in muscle activation during
voluntary contraction may have affected contraction intensity and the recording of
S-MUP data, leading to moderate reliability for mean S-S-MUP (ICC = 0.63) in comparison to
the high reliability of maximum CMAP (ICC = 0.92).
Third, variation in needle position and depth by the technician could have biased
the collected S-MUPs between subjects (Ives & Doherty, 2014a). The technician had
minimal training and experience. Since FCR is a relatively thin and superficial muscle, it
was difficult to determine if the tip of the needle was located in the anterior, middle or
posterior portion of the muscle for variety in data collection. By moving the needle to a
slightly different depth and orientation for each contraction, the technician attempted
to create heterogeneity in data to control for any potential bias towards a certain region
39
Finally, the limited variability between subjects made it difficult to calculate an
accurate ICC for MUP parameters. If between-subject heterogeneity is low, the
calculated ICC is often too low or produces negative values (Portney & Watkins, 2008).
This limitation is consistent with other literature in the field. Insufficient heterogeneity
appears to be an inherent property of MUP parameters in muscles previously tested
using DE-STA MUNE (Boe et al., 2009; Calder et al., 2008; Ives & Doherty, 2012).
Future research into the causes of S-MUP variability in FCR could lead to
improvements in reliability of this technique. Reliability could be assessed further
through an inter-rater study. Additionally, studies examining FCR of elderly individuals
could provide useful information regarding the changes in FCR and MUP parameters
with aging. Since FCR is used as an index C7 muscle in radiculopathy, studies including
C7 radiculopathy patients may be of benefit. Reporting the differences in MUNE
between healthy subjects and C7 radiculopathy subjects could determine the extent of
MU loss in FCR with this disease.
2.5 Conclusion
MUNE provides a unique approach to studying neuromuscular health at the
whole muscle level, and it can detect MU loss well before other clinical measures.
DE-STA is a technique that incorporates computer algorithms with conventional
spike-triggered averaging of MUPs to determine MUNE and measure other quantitative MU
properties. DE-STA has been used to study aging and neuromuscular disorders. The
40
and discern within-subject reliability of the DE-STA MUNE in the FCR muscle. Twenty
subjects completed three trials: trials A and B assessed test-retest reliability with wrist
flexion and no finger flexion; trial C was completed with flexed MCP and IP joints (i.e. a
closed fist) along with wrist flexion to test for differences. With no significant
differences between trials A and B, a high ICC for maximum CMAP and moderate ICC for
mean S-MUP, DE-STA has proven to be reliable in FCR. Data were consistent with
within-subject reliability data from other muscles using the same method. The
significant difference in MUNE between trials A and C reiterates the need for strict study
protocols and proper participant training on the correct contraction techniques in order
to obtain accurate results. Representative data of FCR in healthy subjects provides a
basis for further research in FCR, perhaps in application to aging or clinical groups such
as C7 radiculopathy patients.
2.5 References
Boe, S. G., Dalton, B. H., Harwood, B., Doherty, T. J., & Rice, C. L. (2009). Inter-rater reliability of motor unit number estimates and quantitative motor unit analysis in the tibialis anterior muscle. Clinical Neurophysiology, 120(5), 947–52.
Boe, S. G., Stashuk, D. W., Brown, W. F., & Doherty, T. J. (2005). Decomposition-based quantitative electromyography: effect of force on motor unit potentials and motor unit number estimates. Muscle & Nerve, 31(3), 365–73.
Boe, S. G., Stashuk, D. W., & Doherty, T. J. (2004). Motor unit number estimation by decomposition-enhanced spike-triggered averaging: control data, test-retest reliability, and contractile level effects. Muscle & Nerve, 29(5), 693–9.
41
Boe, S. G., Stashuk, D. W., & Doherty, T. J. (2006b). Within-subject reliability of motor unit number estimates and quantitative motor unit analysis in a distal and proximal upper limb muscle. Clinical Neurophysiology, 117(3), 596–603.
Boe, S. G., Stashuk, D. W., & Doherty, T. J. (2007). Motor unit number estimates and quantitative motor unit analysis in healthy subjects and patients with amyotrophic lateral sclerosis. Muscle & Nerve, 36(1), 62–70.
Bromberg, M. B. (1993). Motor unit estimation: Reproducibility of the spike‐triggered averaging technique in normal and ALS subjects. Muscle & Nerve, 16(5), 466 – 471.
Bromberg, M. B., & Abrams, J. L. (1995). Sources of error in the spike-triggered averaging method of motor unit number estimation (MUNE). Muscle & Nerve, 18(10), 1139–1146.
Calder, K. M., Agnew, M. J., Stashuk, D. W., & McLean, L. (2008). Reliability of
quantitative EMG analysis of the extensor carpi radialis muscle. Journal of Neuroscience Methods, 168(2), 483–93.
Campbell, W. W., & DeJong, R. N. (2005). The Motor Unit Level. In W. W. Campbell (Ed.), DeJong’s the Neurologic Examination (6th ed., p. 671). Lippincott Williams & Wilkins.
Doherty, T. J. (2003). Invited review: Aging and sarcopenia. Journal of Applied Physiology, 95(4), 1717–27.
Doherty, T. J., & Brown, W. F. (1993). The estimated numbers and relative sizes of thenar motor units as selected by multiple point stimulation in young and older adults. Muscle & Nerve, 16(4), 355–66.
Doherty, T. J., & Brown, W. F. (2002). Motor Unit Number Estimation: Methods and Applications. In W. F. Brown, C. F. Bolton, & M. J. Aminoff (Eds.), Neuromuscular Function and Disease: Basic, Clinical, and Electrodiagnostic Aspects2 (1st ed., pp. 274– 290). Philadelphia: W.B. Saunders Company.
Doherty, T. J., & Stashuk, D. W. (2003). Decomposition-based quantitative
electromyography: methods and initial normative data in five muscles. Muscle & Nerve, 28(2), 204–11.
Fuglevand, A. J., Winter, D. A., & Patla, A. E. (1993). Models of recruitment and rate coding organization in motor-unit pools. Journal of Neurophysiology, 70(6), 2470–88.
42
Gooch, C. L., Doherty, T. J., Chan, K. M., Bromberg, M. B., Lewis, R. A., Stashuk, D. W., Berger, M. J., Andary, M. T., Daube, J. R. (2014). Motor unit number estimation: A technology and literature review. Muscle & Nerve, 50(6), 884 – 893.
Hopkins, W. G. (2000). Measures of reliability in sports medicine and science. Sports Medicine, 30(1), 1–15.
Ives, C. T., & Doherty, T. J. (2012). Intra- and inter-rater reliability of motor unit number estimation and quantitative motor unit analysis in the upper trapezius. Clinical
Neurophysiology, 123(1), 200–5.
Ives, C. T., & Doherty, T. J. (2014). Intra-rater reliability of motor unit number estimation and quantitative motor unit analysis in subjects with amyotrophic lateral sclerosis. Clinical Neurophysiology, 125(1), 170–8.
Lee, K.-S., & Jung, M.-C. (2014). Flexion and extension angles of resting fingers and wrist. International Journal of Occupational Safety and Ergonomics, 20(1), 91–101.
McComas, A. J., Fawcett, P. R. W., Campbell, M. J., & Sica, R. E. P. (1971).
Electrophysiologal estimation of the number of motor units within a human muscle. Journal of Neurology, Neurosurgery, and Psychiatry, 34, 121–131.
McNeil, C. J., Doherty, T. J., Stashuk, D. W., & Rice, C. L. (2005). Motor unit number estimates in the tibialis anterior muscle of young, old, and very old men. Muscle & Nerve, 31(4), 461–7.
Portney, L., & Watkins, M. (2008). Foundations of clinical research: applications to practice (3rd ed.). New Jersey: Prentice Hall.
Power, G. a, Dalton, B. H., Behm, D. G., Doherty, T. J., Vandervoort, A. a, & Rice, C. L. (2012). Motor unit survival in lifelong runners is muscle dependent. Medicine and Science in Sports and Exercise, 44(7), 1235–42.
Stashuk, D. W. (1999). Decomposition and quantitative analysis of clinical electromyographic signals. Medical Engineering & Physics, 21(6-7), 389–404.
Stashuk, D. W., & Doherty, T. J. (2002). Normal motor unit action potential. In W. F. Brown, C. F. Bolton, & M. J. Aminoff (Eds.), Neuromuscular Function and Disease: Basic, Clinical, and Electrodiagnostic Aspects (1st ed., pp. 291–310). Philadelphia: W.B.