Multi network selection algorithm based on service type
Wang Zhenyu1, Tao Yang1 and Zhao Fangjin1
1
School of communication and Information Engineering, Chongqing University of Posts and Telecommunications, Chongqing, 400065, China
Abstract
According to the current access selection algorithm, most focus on how to choose the optimal single network, and for parallel transmission network selection algorithm research is still relatively small and there are few algorithm selection problems based on the type of business, a multi network selection algorithm based on business type (MSA-BTT) is proposed. For the main contents of algorithm, first, we divide business into four different types, and use multiple attribute decision making (MADM) model to select weights for different network parameters according to different types of traffic assignment, Then set up the utility function, and affiliate joint decision parameters, business weights and utility functions to select network combination based on business type. Finally, through the MATLAB simulation, it is proved that the algorithm can improve the business satisfaction and terminal throughput effectively.
Keywords: Network Multiple Access, Business Type, MADM, Utility function.
1. Introduction
Under the environment of heterogeneous wireless integrated network, with the continuous improvement of terminal processing capability, it is possible to establish a connection between multiple network interfaces and multiple wireless access networks simultaneously. Even through the traffic assignment algorithm specific, the multi-mode terminal can transmit in parallel with a business flow in multiple access networks, so that the terminal can split the high-speed traffic to multiple networks which single network does not meet. This not only can meet the needs of the business of QoS, improve the throughput of the terminal, but also can improve the network resource utilization, and balance the load of each access network [1]-[4].
In the selection process of the access network, a lot of factors directly affect the results of the network selection, so the network selection can also be regarded as a multi attribute decision making problem [4]. Reference [5] only choose the received signal strength as the network selection decision factors. The three decision factors of the received signal strength, bandwidth and terminal speed are selected in the reference [6]. However, these algorithms do
not consider the network needs of the business itself, so the decision factors of access network selection must consider all aspects of network, terminal and business.
The rest of this letter is organized as follows. Section II begins with introducing the system model of multi network parallel transmission. In section III the problem to be solved is described. Section IV proposes a multi network selection method. Numerical results are presented in Section V, followed by conclusions in Section VI.
2. System Model
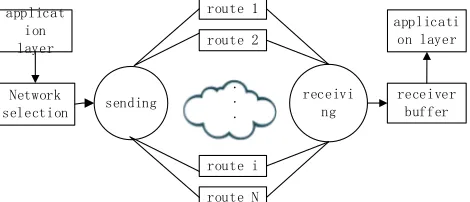
Fig. 1 provides a multimode terminal (MMT) with a number of network interfaces to access different networks at the same time which has the function of business identification after getting the business. Multimode terminal can use the collaboration of one or more networks to transfer the traffic to receiving terminal. There are N mutually independent transmission paths between the transmitter and the receiver, which are recorded asL L1, 2,...,Lk,...LN. Traffic passed by the application layer is divided into data packet sizes when it arrives at the business flow distribution module. Each packet in the transmission process is independent of each other, and choose to send one of N paths in the data according to some scheduling algorithms. The receiving terminal needs to combine the data packets transmitted through various paths, and then transmit it to the upper application processing to complete the whole data transfer process.
Network selection
receivi ng route 1
sending
route i route 2
route N
.
.
.
applicat ion layer
receiver buffer applicati
on layer
www.ijiset.com
3. Problem Description
The access selection algorithm based on heterogeneous terminals is mainly based on a variety of decision parameters, such as available bandwidth, transmission rate, cost, battery power consumption, business type, etc. Different business may have different preferences for different parameters of the selected network when the business is carried out. For example, voice business need high bandwidth, but also must consider the load, session business needs low delay, and high reliability need text business. So it needs to design a network selection algorithm based on the type of business to transmit the business to the appropriate network for transmission. And we transform the multi access selection problem based on terminal business into the attribute decision problem. Access network selection algorithm is to select one or more of the network to meet the requirements from N networks. And the network selection model can be expressed as (1):
AL={AL AL1, 2,⋅⋅⋅,ALk,⋅⋅⋅,ALM } (1)
ALis the collection of network which can provide multi-network selection for business after multi-network aggregation, a total of M .
Set the set of decision criteria in multiple attribute decision makingH={H H1, 2,⋅⋅⋅HQ}, then we can construct multiple
attribute decision making matrices as (2):
11 12 1
21 22 2
1 2
( )
Q
Q MQ M Q
M M MQ
S S S
S S S
A S
S S S
×
= =
(2)
Among them, SMQ represents the value of the network
scheme ALM for decision attributeHQ.
Considering the diversity of the business, according to 3GPP standard, the business is divided into four categories, such as conversation class, current class, text class and background class. Because of the four kinds of business decisions in multi-attribute decision-making performance of the demand for the performance of different weights, we can determine the networks according to the combination of weights and decision attributes
4. Multiple Network Access Selection
4.1 Business division and weight determination
Each type of business is affected by the characteristics of its own, and it will have a different focus on the QoS
needs, as shown in Table 1. For some network selection algorithms, such as the reference [3] in the multi network selection algorithm, the average distribution of the weights of the QoS parameter is not scientific, which ignore the difference between different types of business QoS demand. Therefore, it is very necessary to distinguish the different business type of network selection algorithms for assigning different weights to QoS parameters. We use B to represent bandwidth, T for time delay, Y for packet loss and D for jitter in the paper. For the business, we use Bground to represent background class business.
Table 1: Business parameter requirement list
B(Mbp) T(ms) Y D(ms)
Session demand High Strict limit demand High Strict limit
Stream demand High limited demand High limited
Interact demand Low Non real time demand Low Non real time
Bground demand Low Unlimited demand Low Unlimited
For the determination of weights, we use the analytic hierarchy process (AHP) method. The analytic hierarchy process can be divided into three basic levels: the target layer, the criterion layer and the plan layer. The target layer is the target that is predetermined by analytic hierarchy process. The goal here is to get the QoS parameter weight of the business type. Criteria layer is the QoS parameter to be assigned weight. In general, the key parameters of network QoS are composed of time delay, jitter, bandwidth and packet loss rate. Method layer is to achieve the goal of alternative solutions, where the program is for the business type.
We use the number to measure the importance of the relationship between parameters. mi j represents the
importance level of parameters j to i of the parameter. In this paper, the importance of j to i is as equal, slightly important, important, very important, most important, and the corresponding value is 1, 3, 5, 7, 9. And 2, 4, 6, 8 adjacent to the middle of the judgment of the value. Then, getting judgment matrix as (3):
11 1 1
1
1
( )
j Q
i ij iQ
ij Q Q
Q Qj QQ
m m m
m m m
M m
m m m
×
= =
(3)
In which, mi j >0,
1
ji ij
m m
= ,mii=0.
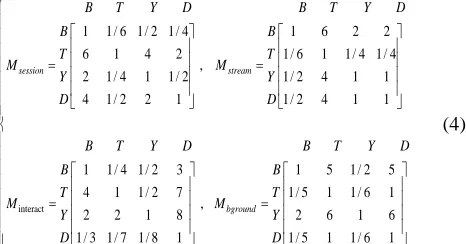
we define the various types of business judgment parameter importance level, then list four categories of business judgment matrix.
1 1/ 6 1/ 2 1/ 4 1 6 2 2 6 1 4 2 1/ 6 1 1/ 4 1/ 4
,
2 1/ 4 1 1/ 2 1/ 2 4 1 1 4 1/ 2 2 1 1/ 2 4 1 1
session stream
B T Y D B T Y D
B B
T T
M M
Y Y
D D
B T Y D B
= =
interact
1 1/ 4 1/ 2 3 1 5 1/ 2 5 4 1 1/ 2 7 1/ 5 1 1/ 6 1
,
2 2 1 8 2 6 1 6
1/ 3 1/ 7 1/ 8 1 1/ 5 1 1/ 6 1 bground
T Y D
B B
T T
M M
Y Y
D D
= =
(4)
After determining the decision matrix M, (5) is used to calculate the weight of each element with respect to the other parameters of the same layer.
1
Q Q
i ij
j
m ω
=
=
∏
(5)Then normalized (5) according to (6).
'
1
i
i Q
i i
ω ω
ω
=
=
∑
(6) Four types of business judgment matrix were brought into the weight calculation formula, we can get four types of business QoS weights, as shown in Table 2.Table 2: Business weight table
B(Mbps) T(ms) Y D(ms)
Session W11=0.074 W12=0.513 W13=0.138 W14=0.275
Stream W21=0.451 W22=0.065 W23=0.242 W24=0.242
Interact W31=0.146 W32=0.360 W33=0.443 W34=0.052
Bground W41=0.333 W42=0.443 W43=0.516 W44=0.076
4.2 Multi Network Selection Scheme
All equations must be typed or written neatly in black. They should be numbered consecutively throughout the text. Equation numbers should be enclosed in parentheses and flushed right. Equations should be referred to as Eq. (X) in the text where X is the equation number. In multiple-line equations, the number should be given on the last line.
We mainly consider 4 decision factors, including available bandwidth, delay, jitter and packet loss rate. And the network selection scheme of multiple networks is implemented as follows:
(1)Detecting the networks asLi which can be used for
parallel transmission,1≤ ≤i n;
(2)Using polynomial method to list all possible network combinations AL={AL AL1, 2,⋅⋅⋅,ALk,⋅⋅⋅,ALM } , in which
1 { }1
AL = L ,···ALM ={ ,L L1 2,LN}. And it has a total of
2N−1 species combination. Because the number of
terminals around the actual available network is limited, this computation method is not exhaustive, and is easy to implement.
(3)The different network combination is regarded as a virtual network, and the aggregated value of each decision factor in the virtual network is calculated.
Aiming at the problem of aggregated bandwidth, the reference [8] is obtained by using the direct superposition method. This paper makes an improvement on the bandwidth loss caused by the distribution of the data flow:
1
(1 ( 1))
L m
N
AL L Li
i
B θ N B
=
= − −
∑
(7)Where BALm is the aggregate bandwidth of ALm , θ
indicates that the aggregated bandwidth loss factor due to the distribution of the data stream is not ideal, and which is related to the number of parallel transmission network.
(NL 1)
θ − indicates that the more the network is used for parallel transmission, the greater the bandwidth loss caused by the distribution is not ideal, and there is only one network, which will not cause the loss of bandwidth.NLis
the number of networks in network combination schemeALm.
We consider the effect of rearrangement on time delay, and obtain a formula for the end to end delay of the business:
(1 ( 1) max( )
m i
AL L L
T = +θ N − T (8)
Where TALmis the aggregate time delay of ALm,θ indicates
that the data is reorganized and ordered to increase the final delay, θ(NL−1) indicates that the more the network is, the greater the additional delay, and only one network will not increase the additional delay. And TLiis the time
delay of networkLi.
Aggregated packet loss rate is more complex compared to aggregated bandwidth and aggregated delay. It has great relationship with the ratio of streaming data and the relative relationship between the network packet loss rate. So difference of packet loss ratio is different under different split ratio. Because of the complexity of the computation of the aggregated packet loss rate, the paper assumes that the packet loss rate of each network is equal as (9):
,
m i
AL AL i m
www.ijiset.com
Where YALmis the packet loss rate of ALm, YALiis the packet
loss rate of one network inALm.
In parallel multi access transmission system in heterogeneous networks, the traffic is different from the time delay of different networks, which is called delay jitter. And the jitter of the network group is represented by the largest network transmission business delay difference as (10):
max , , ,
m i j
AL L L i m j m
D = T −T i≠ j L∈AL L ∈AL (10)
m AL
D is the jitter ofALm,TLi is the time delay of Li, j
L
T is the time delay of Lj.
The traditional multi attribute decision algorithm is used to evaluate the network selection scheme in this paper. First, we identify the type of business according to the business identification module. Then calculate the effectiveness of each decision factor due to the business type. And calculate the total utility value of the network scheme combined with attribute weight information. Finally, the network access scheme, which is the largest value of the total utility value, is the best choice for the business.
1 1
1
max ( ),( )
. .
1,( 1, 2, )
,( 1, 2, ; )
,( 1, 2, ; )
,( 1, 2, ; )
,( 1, 2, ;
m
m i m i m i m i
Q P
i j AL j m i j
Q ij j
AL req m
AL req m
AL req m
AL req m
utility u x AL AL
s t
i P
B B i P AL AL
T T i P AL AL
Y Y i P AL AL
D D i P AL
ω
ω
= =
=
= ∈
= =
≥ = ∈
≤ = ∈
≤ = ∈
≤ = ∈
∑∑
∑
AL)
(11)
ij
ω is the weight value of the business type i to the
decision attribute j , ( )
m AL j
u x is the utility function of
decision attribute j in the scheme of network selection
m
AL ,
1 1
( )
m Q P
i j AL j i j
u x
ω = =
∑∑
is the total utility value of ALm.Here take a number of business type P=4 , in which 1, 2,3, 4
i= are corresponding to the session class, class,
interactive class and background class, The number of decision attributes Q=4 , in which j=1, 2,3, 4 are corresponding to bandwidth, delay, packet loss rate and jitter.
Constraint conditions are the constraints of bandwidth, time delay, packet loss rate and jitter to achieve initial filtering.
In this paper, we use the Sigmoid utility function. On the efficiency index, the form of the utility function is
( ) 1( ) 1
upward a x b
u x
e− − =
+ (12)
And for cost - based indicators, the form of the utility function is
udownward = −1 uupward( )x (13)
We can get the Multi network selection algorithm based on business type as Fig.2.
Algorithm 1 Multi-network selection(MSA-BTT) Initial:get B, T, Y and D of network
loop
identify business, calculate ωij
if BALm ≥Breqi, TALm ≤Treqi m i
AL req
Y ≤Y ,
m i AL req
D ≤D
then calculate
1 1
max ( )
m Q P
i j AL j i j
utility ω u x
= =
=
∑∑
print ALm
else
break
end if end loop
Fig.2. Multi network selection method based on business type
. 5. Simulation Results
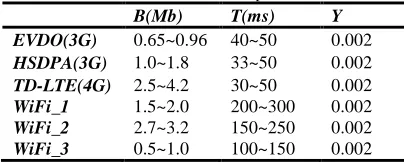
This part shows the simulation results of multi network selection algorithm based on business. The performance is evaluated mainly from two aspects: the satisfaction rate of the business and the total bandwidth utilization ratio of the network. We chose SAW-NS)[9] and TBPA-NS[4]( A Terminal Control Based Parallel Access Network Selection,) to be compared with MSA-BTT. Network environment parameters are shown in Table 3.
Table 3: Network environment parameter table
B(Mb) T(ms) Y
EVDO(3G) 0.65~0.96 40~50 0.002
HSDPA(3G) 1.0~1.8 33~50 0.002
TD-LTE(4G) 2.5~4.2 30~50 0.002
WiFi_1 1.5~2.0 200~300 0.002
WiFi_2 2.7~3.2 150~250 0.002
WiFi_3 0.5~1.0 100~150 0.002
Table 4: Business requirements parameter setting
session stream interact Bground
B(Mb) 0.4~0.6 0.6~1.0 0.3~0.5 0.2~0.3
T(ms) 50~100 50~250 80~150 200~300
Y 0.002~0.004 0.002~0.004 0.001~0.002 0.001
D(ms) 20~70 10~50
The number of business reflects the level of demand for terminal business and the level of the requirements of the data distribution at a certain extent. Therefore, the simulation takes the number of terminal business as variables to observe the performance of MSA-BTT under different traffic conditions and the changing trend of its performance with increasing number of business. The parameters of each business are randomly generated in the range of table 4. For each given number of operations is simulated for 1000 times, and the average value of the simulation results is as evaluation index.
In the simulation, when calculating aggregate bandwidth and aggregate delay, according to the characteristics of the aggregate bandwidth and the aggregate delay time given by (9) and (10), θ=0.01,0.006,0.005,0.006,0.008 as the number of NL in the network scheme are 2, 3, 4, 5, 6. Simulation 1: Business satisfaction rate comparison
Business satisfaction means that the demand is satisfied after a certain data distribution plan. It means that the utility function value is 1 of the number of business accounted for the proportion of the total number of business.
satisfied traffic
total
Q U
Q
= (14)
Where Qsatisfiedrepresents the number of business that are
satisfied by the transmission of the proposed multi network selection strategy, and Qtotalrepresents the total number of
transport business.
0 100 200 300 400 500 600 700 800 900 1000 0.0
0.1 0.2 0.3 0.4 0.5 0.6 0.7 0.8 0.9 1.0
S
er
vi
ce s
at
is
fac
tion r
at
e
Number of traffic
TBPA-NS MSA-BTT SAW
Fig.3. Business satisfaction rate comparison
Fig.3 shows the satisfaction rate of business access scheme for the number of business in different circumstances. As showed in Fig.3, MSA-BTT can achieve higher business satisfaction rate than TBPA-NS and SAW programs, and with the increase of number of business, the advantage is more obvious. With the increasing number of operations, the SAW scheme has a sharp decline in business satisfaction, but business will be assigned to the appropriate network portfolio according to the needs of each business in the transmission of MSA-BTT, which satisfaction rate of business is low by making full use of the advantages of multi network diversity.
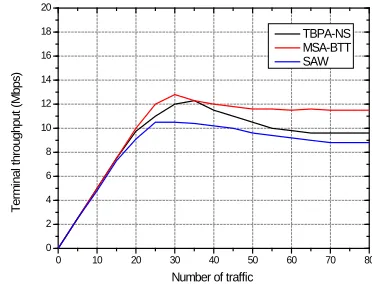
Simulation 2: Terminal throughput comparison
Because this paper is based on the multi-mode terminal to distinguish the business type of access network selection algorithm, so this paper defines the terminal throughput as: the sum of the real time throughput of the selected network in the network selection results of all the operations at time t, which can be represented as (15).
M( ) i( )
i M
TP t TP t
∈
=
∑
(15)
M is selection result vector for all business, and i is the index of M in the network.
0 10 20 30 40 50 60 70 80 0
2 4 6 8 10 12 14 16 18 20
T
er
m
inal
t
hr
oughput
(
M
bps
)
Number of traffic
TBPA-NS MSA-BTT SAW
Fig.4. Terminal throughput comparison
www.ijiset.com
terminal by making traffic transmission in multi network suitable as far as possible.
Simulation 3: Comparison of network bandwidth utilization ratio
Network resource utilization is defined as the ratio of the available bandwidth and the total bandwidth available in the network environment. We can use (16) to calculation it in which Buse represents the allocated bandwidth and represents the total bandwidth available to the network.
Utilization Buse Btotal
= (16)
0 5 10 15 20 25 30 35 40 45 50 55 60 0.0
0.1 0.2 0.3 0.4 0.5 0.6 0.7 0.8 0.9 1.0
U
til
iz
at
ion r
at
io of
bandw
idt
h
Number of traffic
TBPA-NS MSA-BTT SAW
Fig.5. Comparison of network bandwidth utilization ratio
Figure 5 shows the bandwidth utilization ratio of each access scheme in the case of the number of different services. It can be seen from the figure that with the increasing volume of business, the access network algorithm of network bandwidth utilization rate is always higher than that of SAW-NS and TBPA-NS method. And the bandwidth utilization rate increases first and then tends to be stable after reaching the peak value. The MSA-BTT algorithm can assign the service to the suitable network combination to carry on the transmission according to different business needs of QoS In the case of increased traffic. This allows the system to be able to quickly reach the peak bandwidth utilization of the network, and has maintained a relatively high utilization. The results show that the choice of the service transmission path in the sender according to the type of service and as far as possible to make the service in the appropriate multi network transmission, is conducive to improve the utilization rate of multi-mode terminal network bandwidth.
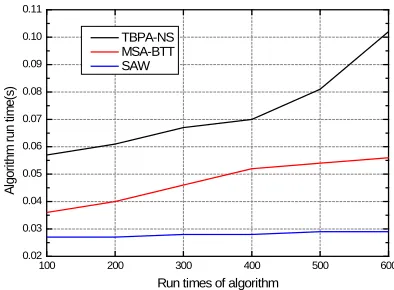
Simulation 4: Algorithm efficiency comparison
In this paper, the efficiency of the algorithm is measured by the time which the algorithm is running on the computer. And the statistical method is used to calculate the running
time of the algorithm. As shown in Figure 6, the efficiency comparison between the algorithm and the two algorithms is presented in this paper.
100 200 300 400 500 600 0.02
0.03 0.04 0.05 0.06 0.07 0.08 0.09 0.10 0.11
A
lgor
ithm
r
un t
im
e(
s)
Run times of algorithm TBPA-NS
MSA-BTT SAW
Fig.6. Algorithm efficiency comparison
From Figure 6 it can be seen that running time of the algorithm is lower than that of the TBPA-NS algorithm. This is because the strategy in the selection of a number of networks gets the initial screening of the network and reduces the number of access network to determine the number of cycles to run the model to shorten the running time. However, the running time of this algorithm is higher than that of single access network selection algorithm SAW. This is because the SAW algorithm only through the comparison of the network to find the highest utility value of a single optimal network after processing the network real-time parameter, and no need to calculate the total utility value of network combination thus shortening the running time.
6. Conclusions
References
[1] Ma X, Sheng M, Li J, et al. “Interference migration using concurrent transmission for energy-efficient HetNets,” Science China Information Sciences, pp.1-10, 2015.
[2] Guannan Xie, Chen Huifang, Xie Lei, et al. “A
User-preference-aware terminal-controlled access network selection scheme in heterogeneous wireless networks,” 2013 IEEE 78th Vehicular Technology Conference(VTC). Las Vegas: Institute of Electrical and Electronics Engineers Inc, 2013, pp. 479-481.
[3] Ali T, Saquib M. “Analysis of an Instantaneous packet loss based vertical handover algorithm for heterogeneous wireless networks,” IEEE Transactions on Mobile Computing , vol.13, no.5 , pp.992-1006, 2014.
[4] Lina Zhang, Qi Zhu. “A Network selection with Parallel
Tranmission based on MADM,” Applied Mechanics and Materials, pp.1662-7482, 2014.
[5] Johnson S, Saranya P, Velmurugan T. “An optimized
algorithm for vertical handoff in heterogeneous wireless networks,” 2013 IEEE Conference on Information and Communication Technologies(ICT). Thuckalay: IEEE Kerala Section, p.1206-1210, 2013.
[6] Kaleem F, Mehbodniya A, Islam A, et al. “Dynamic target
wireless network selection technique using fuzzy linguistic variables,” China Communications, vol.10, no.1 pp.1-16, 2013
[7] Liwen Lu, Xiaoxiang Wang, Dongyu Wang, Peng wei.
“Parallel business Transmission Strategy in Heterogeneous Networks Based on Utility Function,” In World Congress on Computer Applications and information Systems(WCCAIS2015), in Tunisia, January ,2015, pp.17-19.
[8] Zhenhua Jiang. “Research on resource management
technology of heterogeneous wireless network based on the importance of business,” master dissertation, University of Electronic Science and technology, 2015.
[9] Savitha K, Chandrasekar C. “Vertical Handover decision
schemes using SAW and WPM for Network selection in Heterogeneous Wireless Networks,” Global Journal of Computer Science and Technology, vol.11, no.9, pp.19-24, 2011.
[10]Chen Y, Xu Z, He J, et al. “Evaluation of Potential Energy Efficiency Gain of 5G Wireless Networks,” 2015 IEEE Globecom Workshops (GC Wkshps), CA: IEEE Press, in San Diego, 2015, pp.1-6.
[11]Di Renzo M. “Energy efficiency metrics and performance
tradeoffs of GREEN wireless networks,” Green Communications: Principles, Concepts and Practice, pp.43-54, 2015.
[12]Niu Z, Zhou S, Hua Y, et al. “Energy-aware network
planning for wireless cellular system with inter-cell cooperation,” Wireless Communications, IEEE Transactions on, vol.11, no.4, pp.1412-1423, 2013.
Wang Zhenyu was born in Hubei province, China, in 1991. He received
the B.S. degree from Yanan University, Yanan, in 2014. He is now a master candidate of the college of communication and information engineering, in the Chongqing University of Posts and Telecommunication, China. And his research includes network application management and the theory of communication networks.
Tao Yang was born in Chongqing City, China, in 1964. He received the
B.S. degree from National University of Defense Technology, Hunan, in1986 and the M.S. degree from Chongqing University, Chongqing, in 1989. He received Ph.D. degree and the Postdoctoral degree in the Institute of Computing Technology, Chinese Academy. Now, He working as a Professor in the college of communication and information engineering, in the Chongqing University of Posts and Telecommunication. His main research includes the theory of communication networks, network application management.