ISSN 2348 – 7968
Classification of Breast Mass Classification - CAD System and
Performance Evaluation Using SSNE
Mohan Kumar S. P
1
P
Balakrishnan G.P
2
P
1
P
Associate Professor,
Department of Computer Science and Engineering, New Horizon College of Engineering, Bangalore,
Karnataka, India [email protected]
P
2
P
Director,
Indra Ganesan College of Engineering, Trichy,
Tamil Nadu, India
Abstract
Mammogram is measured the most consistent method for early detection of breast cancer. Computer-aided diagnosis system is also able to support radiologist to detect abnormalities earlier and more rapidly. In this paper the performance evaluation of the computer aided diagnostic system for the classification of microcalcification in digital mammogram based on Discrete Wavelet Transform (DWT), Stochastic Neighbor Embedding (SNE) and the Support Vector Machine (SVM) is presented. This proposed system classifies the mammogram images into normal or abnormal, and the abnormal severity into benign or malignant. The performance evaluation is completed using Symmetric SNE. Mammography Image Analysis society (MIAS) database is used to evaluate the proposed system. The average classification rate achieved is very satisfied.
Keywords: Discrete Wavelet Transform, Stochastic Neighbor Embedding, Digital mammograms, Mass Classification, SSNE, MIAS.
1. INTRODUCTION
Breast cancer is the most extensive cancerous pathology among women. It is also an important public health problem in the world. As causes of its onset are still unknown, there are no efficient ways to avoid breast cancer. For this reason, an efficient diagnosis in its early stage can give women a better chance of full healing and survival. Therefore, early detection of breast cancer is the key for reducing the associated morbidity and death rates.
To study the human breast, Mammography is widely used as a diagnostic and a screening tool that uses
X-rays. The objective of mammography is the premature revealing of breast cancer, usually through detection of characteristic microcalcifications and/or masses. Mammography is the only effective and viable technique to detect breast cancer in particular in the case of minimal tumors. About 30% to 50%of breast cancers reveal deposits of calcium called microcalcifications. Computer aided diagnosis system is also able to support radiologist to detect abnormalities earlier and faster. Mammography is believed to decrease mortality from breast cancer. 1.1 All the following mentioned related research works are reviewed aptly to construct the proposed system with the high efficiency, A Computer Aided Diagnosis (CAD) system for the automatic detection of clustered microcalcifications in digitized mammograms is presented by (Song yang Yu, 2000). A computerized scheme for detecting early stage microcalcification clusters in mammograms is proposed by (Ryohei Nakayama, 2006). A computer aided decision support system for an automated diagnosis and classification of breast tumor using mammogram is presented by (M. Suganthi, 2009). A new method of feature extraction from Wavelet coefficients for classification of digital mammograms is proposed by (Ibrahima Faye, 2009). A novel methodology for the classification of suspicious areas in digital mammograms is presented by (Peter Mc Leod, 2010), Initial study with microwave imaging of the axilla to aid breast cancer diagnosis is presented by(Eleuterio, R.; Medina, A.; Conceicao, R.C- 2014) and so on.
In this research the proposed system uses, two techniques for building a computer aided diagnostic system for the classification of
microcalcification in digital mammograms based on DWT and SNE are presented. The SNE applied to wavelet transformed image and also applied on sub-bands of wavelet transformed image individually. SNE is essentially used for reducing high dimensionality data into relatively low dimensional data, efficiently. Then classifier system based on Support Vector Machine (SVM) is constructed and the same is compared with the results of the KNN Classifier. Experiments are conducted on Mammography Image Analysis society (MIAS) database. The MIAS is an organization of UK research groups interested in the understanding of mammograms and has generated a database of digital mammograms. Films taken from the UK National Breast Screening programme have been digitized to 50 micron pixel edge with a Joyce -Loebl scanning microdensitometer. It is a device linear in the optical density range 0 to 3.2 and representing each pixel with an 8-bit word. MIAS database consists of a total of 322 digital mammogram images (161 breast pairs) in the mediolateral oblique view. The performance of the proposed system is carried on 99 normal images and 25 microcalcification images. Among the 25 abnormal images, there are 12 benign and 13 malignant images available. All the images are considered for the classification test.
This proposed system classifies the mammogram images into normal or abnormal, and the abnormal severity into benign or malignant. The proposed methods are implemented in MATLAB and the performances of these methods are also analyzed productively. Finally, in order to serve the cancer patients with due diagnosis, the classification accuracy rate is sensibly derived from our proposed system.
2 . METHODOLOGY
The proposed system for the classification of microcalcification in digital mammograms is built based on DWT, SNE and by applying KNN and SVM for building the classifiers. In this following section the theoretical background of all the approaches are introduced.
2.1 Discrete Wavelet Transform
Nowadays, wavelets have been used quite frequently in image processing and used for feature extraction, denoising, compression, face recognition, and image super-resolution. The decomposition of images into different frequency ranges permits the isolation of the frequency components introduced by “intrinsic
deformations” or “extrinsic factors” into certain sub-bands. This process results in isolating small changes in an image mainly in high frequency sub-band images.
The 2-D wavelet decomposition of an image is performed by applying 1-D DWT along the rows of the image first, and, then, the results are decomposed along the columns. This operation results in four decomposed sub-band images referred to as low–low (LL), low–high (LH), high–low (HL), and high–high (HH). The frequency components of those sub-band images as shown in Figure 1 (b) cover the frequency components of the original image in Figure 1 (a).
2.2 Stochastic Neighbor Embedding
SNE is a probabilistic approach to the task of placing objects, described by high-dimensional vectors or by pair-wise dissimilarities in a low-dimensional space in a way that preserves neighbor identities. A Gaussian is centered on each object in the high-dimensional space and the densities under this Gaussian (or the given dissimilarities) are used to define a probability distribution over all the potential neighbors of the object.
In the proposed approach for the classification of breast microcalcification system, SNE is used as a dimension reduction technique. Among the various state of art dimension reduction techniques, Principal component analysis (PCA) is a very popular technique for dimensionality reduction.
SNE is a probabilistic approach to the task of placing objects, described by high-dimensional vectors or by pair-wise dissimilarities in a low-dimensional space in a way that preserves neighbor identities. A Gaussian is centered on each object in the high-dimensional space and the densities under this Gaussian (or the given dissimilarities) are used to define a probability distribution over all the potential neighbors of the object. The aim of the embedding is to approximate this distribution as well as possible when the same operation is performed on the low-dimensional “images” of the objects. A natural cost function is a sum of Kullback-Leibler divergences, one per object, which leads to a simple gradient for adjusting the positions of the low-dimensional images.
ISSN 2348 – 7968
by the formula that 𝑖 would pick 𝑗 as its neighbor is given by
𝑝𝑖𝑗= ∑ exp𝑒𝑥𝑝�−𝑑�−𝑑𝑖𝑗2�
𝑖𝑘2� 𝑘≠𝑖 ( 1)
The dissimilarities, 𝑑𝑖𝑗2 , may be given as part of the problem definition (and need not be symmetric), or they may be computed using the scaled squared Euclidean distance (“affinity”) between two high-dimensional points, 𝑋𝑖; 𝑋𝑗 :
𝑑𝑖𝑗2 = �𝑋𝑖−𝑋𝑗�
2
2𝜎𝑖2 (2)
Where 𝜎𝑖 is either set by hand or found by a binary search for the value of 𝜎𝑖 that makes the entropy of the distribution over neighbors equal to log𝑘. Here, k is the effective number of local neighbors or “perplexity” and is chosen by hand. In the low-dimensional space, the Gaussian neighborhoods are used with a fixed variance so the induced probability
𝑞𝑖𝑗 that point 𝑖 picks point 𝑗 as its neighbor is a function of the low-dimensional images 𝑦𝑖 of all the objects and is given by the expression
𝑞𝑖𝑗= 𝑒𝑥𝑝 �−�𝑦𝑖− 𝑦𝑗� 2
� ∑𝑘≠𝑖𝑒𝑥𝑝�−�𝑦𝑖− 𝑦𝑗�2�
(3)
The aim of the embedding is to match these two distributions as well as possible. This is achieved by minimizing a cost function which is a sum of Kullback-Leibler divergences between the original (𝑝𝑖𝑗) and induced (𝑞𝑖𝑗) distributions over neighbors for each object is given by (4)
𝐶= ∑ ∑ 𝑝𝑖𝑗 𝑙𝑜𝑔𝑖 𝑗 𝑝𝑖𝑗𝑞𝑖𝑗= ∑ 𝐾𝐿(𝑃𝑖 𝑖||𝑄𝑖) (4)
The minimization of the cost function in Equation 4 is performed using gradient method. The gradient has the simple form as
𝜕𝐶
𝜕𝑌𝑖= 2��𝑦𝑗 𝑖− 𝑦𝑗� �𝑝𝑖𝑗− 𝑞𝑖𝑗+𝑝𝑖𝑗− 𝑞𝑖𝑗� (5)
The gradient descent is initialized by sampling map points randomly from an isotropic Gaussian with small variance that is center around the origin. For speed up the optimization and avoid been stuck in local optima, a momentum term is added to the gradient [4]. The current gradient is added to an exponentially decay sum of previous gradients in order to determine the changes in the coordinates of the map points at each iteration of gradient search. Mathematically, the gradient with a momentum term is given by
𝑦(𝑡)=𝑦(𝑡−1)𝜂 𝜕𝐽
𝜕𝑦𝑖+𝛼(𝑡)�𝑦
(𝑡−1)− 𝑦(𝑡−2)� (6)
Where 𝑦(𝑡) indicate the solution at iteration𝑡, 𝜂 indicates the learning rate, and 𝛼(𝑡) represents the momentum at iteration 𝑡. In the early stages of the optimization, after the each iteration, a random jitter
is added to the map points. Then gradually reducing the variance of this noise performs a type of simulated annealing that helps the optimization to escape local minima in the cost function.
2.3 Principle Component Analysis:
Given a set of data on
n
dimensions, PCA aims to find a linear subspace of dimensiond
lower thann
such that the data points lie mainly on this linear subspace .Such a reduced subspace attempts to maintain most of the variability of the data. The linear subspace can be specified byd
orthogonal vectors that form a new coordinate system, called the `principal components'. The principal components are orthogonal, linear transformations of the original data points, so there can be no more thann
of them.However, the hope is that only
d
<
n
principal components are needed to approximate the space spanned by the
n
original axes. The most common definition of PCA is that, for a given set of data vectorsx
ii
∈
1
,...
t
, thed
principal axes are those orthonormal axes onto which the variance retained under projection is maximal. In order to capture as much of the variability as possible, let us choose the first principal component, denoted byU
1, to have maximum variance. Suppose that all centered observations are stacked into the columns of an
×
t
matrix
X
, where each column corresponds to ann
-dimensional observation and there aret
observations. Let the first principal component be a linear combination of X defined by coefficients (or weights)2 1
...
w
w
w
=
.In matrix form:
X
w
U
1=
TSw
w
X
w
U
)
=
var(
T)
=
Tvar(
1(7) where
S
is then
×
n
sample covariance matrix ofX
. Clearly
var(
U
1)
can be made arbitrarily large by increasing the magnitude ofw
Therefore,w
ischosen in order to maximize
w
TSw
while constrainingw
to have unit length.Sw
w
Tmax
1
=
w
w
to
subject
T (8))
1
(
)
,
(
w
=
w
Sw
−
1w
w
−
L
α
Tα
T(9) Differentiating with respect to
w
givesn
equations,w
Sw
=
α
1(10)
Premultiplying both sides by
w
T ,we get1
1
α
α
=
=
w
w
Sw
w
T T(11)
)
var(
U
1 is maximized ifα
1is the largest Eigenvalue of
S
.Clearlyα
1and w are an Eigen value and an eigenvector ofS
. Differentiating with respect to the Lagrange multiplierα
1 gives us back the constraint:1
=
w
w
T (12)This shows that the first principal component is given by the normalized eigenvector with the largest associated Eigen value of the sample
covariance matrix
S
. A similar argument can show that thed
dominant eigenvectors of covariance matrixS
determine the first d principal components.Another nice property of PCA, closely related to the original discussion is that the projection onto the
principal subspace minimizes the squared
reconstruction error,
.
2 1 1∑
=−
t i ix
x
(13) In other words, the principal components ofa set of data in
ℜ
n provide a sequence of best linear approximations to that data, for all ranksd
≤
n
.
Consider the rank-
d
linear approximation model as:y
U
x
y
f
(
)
=
+
d(14)
This is the parametric representation of a hyper plane of rank
d
.For convenience, suppose
x
=
0
(otherwise the observations can be simply replaced by their centered versions~
x
=
x
i−
x
.
Under this assumption the rankd
linear model would bey
U
y
f
(
)
=
d whereU
dis an
×
d
(15)matrix with
d
orthogonal unit vectors as columns andy
is a vector of parameters. Fitting this model to the data by least squares leaves us to minimize the reconstruction error:2
,
min
∑
−
t i i d i y
Ud i
x
U
y
(16) By partial optimization for
y
iwe obtain:i T d i i
x
U
y
dy
d
=
⇒
=
0
(17) Now we need to find the orthogonal matrixU
d:
2
min
∑
−
t i i T d d i
Ud
x
U
U
x
(18)
Define
H
d=
U
dU
dT.H
d is an
×
n
matrix which acts as a projection matrix and projects each data pointx
i onto its rankd
reconstruction. In other words,H
dx
iis the orthogonalprojection ofx
ionto the subspace spanned by the columns ofU
d A unique solutionU
can obtained by finding the singular value decomposition ofX
.
For each rankd
,
U
dconsists of the firstd
columns ofU
.Clearly the solution forU
can be expressed as singular value decomposition (SVD) ofX
( J. Friedman,2002).T
V
U
X
=
Σ
(19)
Since the columns of
U
in the SVD contain the eigenvectors ofXX
T .D: SNE Vs SSNE
The variation of SNE, Symmetric SNE is also used to evaluate the proposed approach. Compared with an earlier method Stochastic Neighbor Embedding (SNE), SSNE uses a symmetries cost function with simpler gradients. Suppose the pair wise similarities of a set of m
-dimensional data points
{ }
x
i
ni
x
1
=
=
are encodedin a symmetric matrix
p
∈
R
n+×n,wherep
=
0
ii
and. Symmetric Stochastic Neighbor Embedding (SSNE) seeks
r
-dimensional(
r
<<
m
)
representations of x denoted byy
=
{ }
yi
ni=1 ,such that ( )( )
(
( ) ( ))
,
|
1 1 − = ++
−
∂
∂ℑ
+
=
t tY Y t
t
t
Y
Y
Y
Y
ISSN 2348 – 7968
( )
(
)
Q
P
p
Q
P
D
y
ij ij
j i ij KL
||
=
∑
log
=
ℑ
≠
(20) is minimized, where
Q
ij=
q
ij∑
a≠bq
ab are thenormalized similarities in low dimensional embedding and
(
||
||
)
exp
y
y
2q
ij=
−
i−
j ,q
=
0
ii (21)
The optimization of SSNE uses the gradient descent method with
(
P
Q
)(
y
y
)
y
j ij ij i ji
−
∑
−
=
∂
∂ℑ
4
(22)
A momentum term is added to the gradient in order to speed up the optimization:
where
Y
( )[
y
( )y
( )t]
R
r n nt
t
=
∈
×...
1 is the solution in
matrix form at iteration
t
;
η
is the learning rate; and( )
t
β
is the momentum amount at iterationt
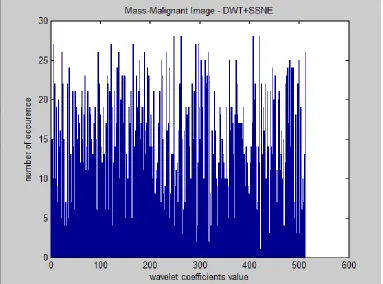
. Figure1 and 2 shows the histogram plot for normalmammogram and benign and malignant
mammograms images using SSNE based dimension reduction.
2.4 SNE Vs SSNE
The comparative analysis between PCA and
SNE provides the performance of SNE over PCA. In
this section, a variation of SNE called SSNE is
analyzed with SNE.
t
. Figure 1 and 2 show the histogram plot for normal mammogram and benignand malignant mammograms images using SSNE
based dimension reduction. The classification
accuracy obtained by the proposed system using
SVM classifier for first stage and final stage is shown
in Table 1 and 2.
Figure 2 Histogram plot of dimension reduced 2-level wavelet coefficients of a mass- malignant image by SSNE Table 1 Classification results of proposed mass classification system for first stage based on SNE and SSNE using
SVM classifier
Normal/Abnormal classification
Level of decomposition
Wavelet Wavelet Sub-bands SNE
(%)
SSNE (%)
SNE (%)
SSNE (%)
2 90.84 91.72 85.25 88.28
3 91.22 90.06 89.05 89.16
4 89.94 90.21 89.44 88.55
5 88.55 89.43 88.28 88.15
6 93.39 88.81 86.88 88.78
It is clearly shown from the above table;
high average classification accuracy is achieved by
SNE in comparison with SSNE. The symmetries cost
function with simpler gradients used by SSNE does
not affect the performance of the standard SNE
ISSN 2348 – 7968
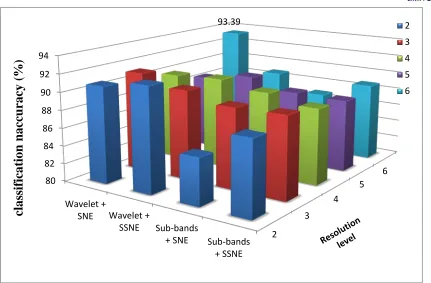
Figure 3 Graphical representations of performance of normal/abnormal mass classification using SNE and SSNE
Table 2 Classification results of proposed mass classification system for final stage based on SNE and SSNE using SVM classifier
Mass Benign/Malignant classification
Level of decomposition
Wavelet Wavelet Sub-bands
SNE (%)
SSNE (%)
SNE (%)
SSNE (%)
2 88.12 92.10 92.10 89.47
3 92.10 93.39 92.10 89.47
4 90.75 93.39 90.75 89.47
5 92.10 93.39 93.39 92.10
6 90.83 90.75 89.47 89.47
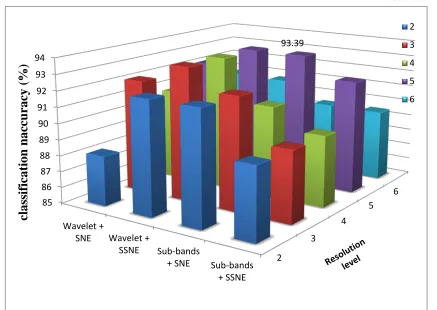
The maximum classification accuracy
achieved by SNE and SSNE is 93.39%. SSNE
reduced features produces better performance than
SNE while the dimension reduction is applied on the
whole wavelet transformed image. It fails on wavelet
sub-bands processing. The performance of SNE is
very consistent on both techniques.
2 3
4 5
6 80
82 84 86 88 90 92 94
Wavelet +
SNE Wavelet +
SSNE Sub-bands
+ SNE Sub-bands
+ SSNE 93.39
cl
a
ss
ifi
ca
ti
o
n
n
a
cc
u
ra
cy
(%
)
Figure 4 Graphical representations of performance of benign/malignant mass classification using SNE and SSNE
3 CONCLUSION:
The classification accuracy shows in the above table gives the accuracy of SNE and SSNE for mass classifications severity into benign or malignant.
There is no high variation in the classification accuracy obtained by the SNE and SSNE reduced features. However, the SNE reduced features higher classification accuracy over SSNE.
It is clearly noted that the maximum classification accuracy is obtained by the SNE dimension reduction technique indicated in bold letters. The Graphical
representations of the above two tables in Figure 1 and 2 clearly show SNE performance over SSNE technique.
The most of the highest bars in the charts are belongs to SNE that shows the efficiency of SNE over SSNE.
This proposed system classifies the mammogram images into normal or abnormal, and the abnormal severity into benign or malignant. The proposed methods are implemented in MATLAB and the performances of these methods are also analyzed productively. Finally, in order to serve the cancer patients with due diagnosis, the classification accuracy rate is sensibly derived from our proposed system.
4 REFERENCES:
[1] Songyang Yu and Ling Guan, “A CAD System for the Automatic Detection of Clustered Microcalcifications in Digitized
Mammogram Films”, IEEE Transactions on
Medical imaging, vol. 19, no. 2, February 2000, pp 115-126.
[2] Ryohei Nakayama and Yoshikazu
Uchiyama, “Computer-Aided Diagnosis Scheme Using a Filter Bank for Detection of Microcalcification Clusters in
Mammograms”, IEEE Transactions on
2
3 4
5 6 85
86 87 88 89 90 91 92 93 94
Wavelet +
SNE Wavelet +
SSNE Sub-bands
+ SNE Sub-bands
+ SSNE
93.39
cl
a
ss
ifi
ca
ti
o
n
n
a
cc
u
ra
cy
(%
)
ISSN 2348 – 7968
Biomedical engineering, vol. 53, no. 2, February 2006, pp 273-283.
[3] M.Suganthi and M.Madheswaran,
“Mammogram Tumor Classification using Multimodal Features and Genetic
Algorithm”, IEEE International Conference
on “Control, Automation, Communication and Energy conservation, June 2009, pp 1-6. [4] Ibrahima Faye and Brahim Belhaouari
Samir, “Digital Mammograms
Classification Using a Wavelet Based
Feature Extraction Method”, IEEE
conference on Computer and Electrical Engineering, 2009, pp 318-322.
[5] Peter Mc Leod and Brijesh Verma, “A Classifier with Clustered Sub Classes for the Classification of Suspicious Areas in Digital
Mammograms”, IEEE conference on Neural
Networks, July 2010, pp 1-8.
[6] Viet Dzung Nguyen, Thu Van Nguyen and Tien Dzung Nguyen, “Detect Abnormalities in Mammograms by Local Contrast Thresholding and Rule-based
Classification”, IEEE third International
Conference on Communications and Electronics, August 2010, pp 207-210.
[7] Andy Tirtajaya and Diaz D. Santika,
“Classification of Microcalcification Using Dual-Tree Complex Wavelet Transform and
Support Vector Machine”, IEEE
International Conference on Advances in Computing, Control and Telecommunication Technologies, December 2010, pp 164-166. [8] Fatemeh Saki and Amir Tahmasbi, “A Novel
Opposition-based Classifier for Mass
Diagnosis in Mammography Images”, IEEE
Iranian Conference of Biomedical Engineering, November 2010, pp 1-4.
[9] Alireza Shirazi Noodeh and Hossein Rabbani, “Detection of Cancerous Zones in Mammograms using Fractal Modeling and Classification by Probabilistic Neural
Network” IEEE Iranian Conference of
Biomedical Engineering, November 2010, pp 1-4..
[10] K. Thangavel and A. Kaja Mohideen,
“Semi-Supervised K-Means Clustering for Outlier Detection in Mammogram
Classification”, IEEE Trendz in Information
Sciences & Computing, December 2010, pp 68-72.
[11] Mohamed Meselhy Eltoukhy and Ibrahima Faye, “Curvelet Based Feature Extraction Method for Breast Cancer Diagnosis in
Digital Mammogram”, IEEE International
Conference on Intelligent and Advanced Systems, June 2010, pp 1-5.
[12] Dheeba.J and Tamil Selvi.S, “Classification of Malignant and Benign Microcalcification
Using SVM Classifier”, IEEE International
Conference on Emerging Trends in Electrical and Computer Technology, March 2011, pp 686-690.
[13] Y.Ireaneus Anna Rejani, S.Thamarai Selvi
“Early detection of breast cancer using
SVM classifier technique” International
Journal on Computer Science and Engineering, Vol 1(3), 2009, 127-130.
[14] Smola A. J., Scholkopf B., and Muller K. R.,
“The connection between regularization operators and support vector kernels”,
Neural Networks New York, vol.11, November 1998, pg 637-649.
[15] MIAS:database, 28TUhttp://peipa.essex.ac.uk/ipa/
pix/mias/U28T.
[16] 34TEleuterio, R.34T35T;0T35T0T34TMedina, A.34T35T;0T35T0T34TConceicao, R.C,
“34TInitial study with microwave imaging of the
axilla to aid0T0T25Tbreast0T25T0T25Tcancer 25Tdiagnosis”,
Radio Science Meeting (Joint with AP-S Symposium), USNC-URSI- 41TIEEE