Cancer Management and Research 2018:10 6143–6156
Cancer Management and Research
Dovepress
submit your manuscript | www.dovepress.com 6143
O R i g i n a l R e s e a R C h
open access to scientific and medical research
Open Access Full Text Article
Construction of a nomogram predicting the
overall survival of patients with distantly
metastatic non-small-cell lung cancer
Jianqing Deng Zhipeng Ren Jiaxin Wen Bo Wang Xiaobin hou Zhiqiang Xue Xiangyang Chu
Department of Thoracic surgery, Chinese Pla general hospital, Beijing, People’s Republic of China
Purpose: This study aimed to establish a nomogram to predict the overall survival (OS) of the
general non-small-cell lung cancer (NSCLC) patients with distant metastasis.
Patients and methods: We investigated Surveillance, Epidemiology, and End Results
data-base for NSCLC patients with distant metastasis diagnosed between 2010 and 2014. Statisti-cally significant prognostic factors were identified using uni- and multivariable Cox regression analyses. A nomogram incorporating these prognostic factors was developed and evaluated by the Harrell’s concordance index (C-index), calibration plots, and risk group stratifications.
Results: We finally included 18,209 patients for analysis. These patients were divided into two
groups, 14,567 cases for the training cohort and 3,642 for the validation cohort. Marital status, sex, race, age, histology, T stage, N stage, histological differentiation, bone metastasis, brain metastasis, liver metastasis, with M1a disease, surgery of primary cancer, and chemotherapy were identified as the prognostic factors of the OS and integrated to construct the nomogram. The nomogram had a C-index of 0.704 (95% CI: 0.699–0.709) in the training set and 0.699 (95% CI: 0.689–0.709) in the validation set. The calibration curves for 1- and 2-year OS in the training and validation sets showed acceptable agreement between the predicted and observed survival. Also, the nomogram was capable of stratifying patients into different risk groups within the patients who presented with bone, liver, or brain metastasis, as well as in each T, N stage, respectively.
Conclusion: A nomogram was established and validated to predict individual prognosis for the
general patients with distantly metastatic NSCLC. Global prospective data with the latest TNM classification and more comprehensive prognostic factors are needed to improve this model.
Keywords: nomogram, metastatic lung cancer, SEER, prognosis, overall survival, prediction
Introduction
Lung cancer is one of the most common malignancies as well as the leading cause of cancer-related death both in males and females worldwide.1 Non-small-cell lung cancer (NSCLC) constitutes for about 80% of all lung cancer cases. About 55% of NSCLC patients present with distant metastasis at diagnosis and have a poor prog-nosis with a median survival time of 8–9 months,2 despite medical progresses that have been made. In reality, metastatic lung cancer is a heterogeneous disease with various prognoses,3 which are affected by physical conditions of patients, such as age, sex, marital status, performance status as well as the TN stage, pathological or genotype characteristics, type of metastatic organ, number of metastatic sites, and medical treatments.2–8 Estimating prognosis of every patient accurately may benefit patients and doctors alike in all aspects of decision-making.9 The TNM stage released Correspondence: Xiangyang Chu
Department of Thoracic surgery, Chinese Pla general hospital, 28 Fuxing Road, haidian District, Beijing100853, People’s Republic of China
Tel +86 173 4309 0236 Fax +86 173 4309 0236 email [email protected]
Journal name: Cancer Management and Research Article Designation: Original Research Year: 2018
Volume: 10
Running head verso: Deng et al
Running head recto: A nomogram predicting the OS of patients with distantly metastatic NSCLC DOI: http://dx.doi.org/10.2147/CMAR.S183878
Cancer Management and Research downloaded from https://www.dovepress.com/ by 118.70.13.36 on 20-Aug-2020
For personal use only.
Dovepress Deng et al
by International Association for the Study of Lung Cancer International Staging Project is widely accepted as a tool to predict the prognosis of patients and had been updated to the eighth edition. The eighth TNM stage took the number of metastatic sites into consideration and divided the cases with distant metastasis into M1b (single metastatic site) and M1c (multiple metastatic sites) subgroups. However, differ-ent metastatic organs are associated with differdiffer-ent prognosis, and it ignores patients’ physical condition,7,9 pathological or genotype characteristics, and treatments. Therefore, it is still difficult to predict individual prognosis of metastatic lung cancer precisely and accurately by this tool.
Nomogram is a commonly feasible tool to predict disease prognostication of patients.9 In recent decades, several nomo-grams have been developed for metastatic NSCLC patients with brain metastasis,10 or treated with chemotherapy,3,6 but no nomogram is constructed for the general distantly metastatic NSCLC cohort. In addition, EGFR-tyrosine kinase inhibitors (EGFR-TKIs) have been widely used since 2010,11 which would change the prognosis of distantly metastatic NSCLC. Therefore, the present study aimed to develop and validate a novel nomogram for this cohort by examining the cases diagnosed between 2010 and 2014 from the Surveil-lance, Epidemiology, and End Results (SEER) database, which covers 34.6% of the US population.12
Patients and methods
study population and data processing
In this study, data were extracted from the SEER program (www.seer.cancer.gov) SEER*Stat Database: Incidence-SEER 18 Regs Custom Data (with additional treatment fields), Nov 2017 Sub (1973–2015 varying)-Linked to County Attributes-Total US, 1969–2016 Counties, National Cancer Institute, DCCPS, Surveillance Research Program, released in April 2018, based on the November 2017 submis-sion using the SEER*Stat software (versubmis-sion 8.3.5). SEER research data are publicly available, and we obtained the permission from the SEER program to access the research data (username: dengji). Informed consent was not required for this study. The inclusion and exclusion criteria are listed as follows:inclusion criteria
1. Lung cancer patients were pathologically confirmed (Site codes: C34.0, C34.1, C34.2, C34.3, C34.8, and C34.9) to have pathological types of NSCLC (histologic codes: 8010, 8012, 8013, 8020, 8046, 8050, 8052, 8070–8078, 8140, 8141, 8143, 8147, 8250–8255, 8260, 8310, 8430,
8480, 8481, 8490, 8560, and 8570–8575) diagnosed from 2010 to 2014.
2. Patients had at least one distant organ metastasis (SEER code: at least one of CS Mets at dx-bone, brain, or liver code was “Yes”, there was no information about adrenal or renal metastasis)
3. Lung cancer was the first and only primary cancer diagnosis.
exclusion criteria
1. Diagnosis was obtained through death certificate or autopsy.
2. Patients had missing or incomplete information about marital status, race, bone, brain, liver metastasis, surgery of primary cancer, or radiation.
3. Survival time was 0 month.
4. There existed unknown detailed information on accom-panied metastasis information (CS Mets at dx code was 26, 70, and 75).
The following demographic, clinicopathological, and fol-low-up variables, including marital status, race, age, histology, tumor grade, American Joint Committee on Cancer (AJCC) T and N stage, primary site, laterality, bone metastasis, brain metastasis, liver metastasis, CS Mets at dx code, surgery of primary cancer, radiation, chemotherapy, vital status recode, and survival time were collected from the SEER program. According to the Collaborative Stage Data Collection System Coding Instructions, Version 02.05, the CS Mets at dx code: 15–25, 32, 33, 36, 38, 41–43, 52, 53 indicate the presence of separate tumor nodule(s) in a contralateral lobe, malignant pleural or pericardial effusion, or tumor involved with pleural or pericardial nodule(s).13 We defined a new item “With M1a”. If the CS Mets at dx code of a patient was coded as one of them, his/her “With M1a” item would be coded as “Yes”. Age is a continuous variable and was transformed into cat-egorical variables according to the cutoff values determined by the X-tile software (https://medicine.yale.edu/lab/rimm/ research/software.aspx). The software can divide continuous variable into several subgroups with the largest chi-squared log-rank value and the minimum P-value rationally.14 Surgery of primary cancer and radiation therapy was divided into two categories (“yes” or “no”). Overall survival (OS) was defined as the time from diagnosis to death despite the causes.
statistical analysis
The cases that we finally included were assigned randomly into the training and validation sets in a 4:1 ratio by the digital method. We performed a descriptive analysis of
Cancer Management and Research downloaded from https://www.dovepress.com/ by 118.70.13.36 on 20-Aug-2020
Dovepress a nomogram predicting the Os of patients with distantly metastatic nsClC
the demographic and clinicopathological features of the included patients in training and validation sets. At the same time, we calculated the median survival time (95% CI) for each subgroup using the Kaplan–Meier analysis. In the training cohort, prognostic risks of the OS were identified using the unadjusted univariable Cox regression analysis. Variables that reached statistical significance (P<0.05) were involved into multivariable analyses. According to the results of the Cox proportional hazards model, variables that remained statistically significance (P<0.05) were incor-porated to construct the nomogram by R software version 3.3.3 (Institute for Statistics and Mathematics, Vienna, Austria; www.r-project.org) with the “rms” and “survival” package. The nomogram adopted the 1- and 2-year OS as the endpoints. We used the Harrell’s concordance index (C-index) with a 95% CI to evaluate the discriminative ability of the nomogram by 1,000 bootstraps resamples for internal validation in the training cohort and external validation in the validation set, respectively. We developed calibration blots in the two sets to visualize the agreement between the predicted and observed 1- and 2-year OS to assess the predicted accuracy of the nomogram. In addition, patients in the validation set were assigned into different risk groups according to quartile of prognostic scores in training cohort. Survival curves for different risk groups
in the validation set were generated by the Kaplan–Meier analysis and compared using the log-rank test in order to investigate the discriminate ability of the nomogram. Two-sided P-values <0.05 were considered as statistically significance. All statistical analysis procedures were per-formed using SPSS 23.0 (SPSS Inc., Chicago, IL, USA).
Results
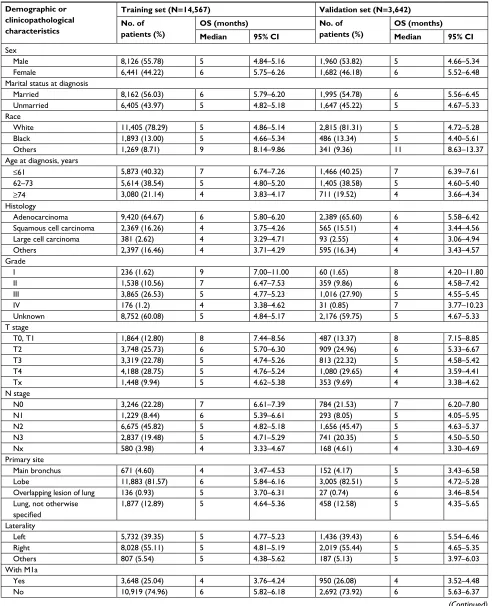
Baseline clinicopathological features
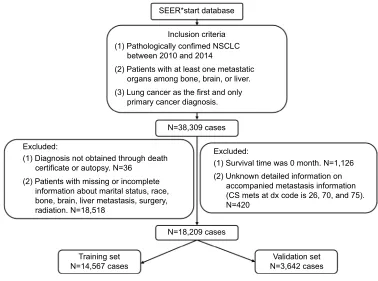
Finally, a total of 18,209 cases that met our criteria were extracted from the SEER database. The details of case-selection procedures are demonstrated in Figure 1. The entire cohort was randomly allocated into two groups, 14,567 cases in the training cohort and 3,642 cases in the validation cohort, respectively. The demographic and clinicopathological fea-tures of the patients in the two cohorts are shown in Table 1, as well as the OS (95% CI) of each subgroup. The median age (25th–75th percentile) of the training set at diagnosis was 64 (57–72) years. Age is a continuous variable and was trans-formed into three categories according to the cutoff value: Min–61, 62–73, and 74–Max, which were determined by x-tiles with the maximum Chi-squared log-rank value. There were 58.84%, 58.04%, 19.79%, and 25.04% of the patients who presented with bone, brain, liver metastasis, and M1a diseases at diagnosis, respectively. The median OS (25–75
N=38,309 cases
N=18,209 cases
Training set
N=14,567 cases N=3,642 casesValidation set
Inclusion criteria (1) Pathologically confimed NSCLC between 2010 and 2014
(2) Patients with at least one metastatic organs among bone, brain, or liver. (3) Lung cancer as the first and only primary cancer diagnosis.
Excluded:
(1) Diagnosis not obtained through death certificate or autopsy. N=36
(2) Patients with missing or incomplete information about marital status, race, bone, brain, liver metastasis, surgery, radiation. N=18,518
Excluded:
(1) Survival time was 0 month. N=1,126 (2) Unknown detailed information on accompanied metastasis information (CS mets at dx code is 26, 70, and 75). N=420
SEER*start database
Figure 1 The flowchart of cases selection.
Abbreviations: nsClC, non-small-cell lung cancer; seeR, surveillance, epidemiology, and end Results
Cancer Management and Research downloaded from https://www.dovepress.com/ by 118.70.13.36 on 20-Aug-2020
Dovepress Deng et al
Table 1 Demographic and clinicopathological characteristics of the training cohort and validation cohort
Demographic or clinicopathological characteristics
Training set (N=14,567) Validation set (N=3,642) No. of
patients (%)
OS (months) No. of patients (%)
OS (months) Median 95% CI Median 95% CI
sex
Male 8,126 (55.78) 5 4.84–5.16 1,960 (53.82) 5 4.66–5.34
Female 6,441 (44.22) 6 5.75–6.26 1,682 (46.18) 6 5.52–6.48
Marital status at diagnosis
Married 8,162 (56.03) 6 5.79–6.20 1,995 (54.78) 6 5.56–6.45
Unmarried 6,405 (43.97) 5 4.82–5.18 1,647 (45.22) 5 4.67–5.33
Race
White 11,405 (78.29) 5 4.86–5.14 2,815 (81.31) 5 4.72–5.28
Black 1,893 (13.00) 5 4.66–5.34 486 (13.34) 5 4.40–5.61
Others 1,269 (8.71) 9 8.14–9.86 341 (9.36) 11 8.63–13.37
age at diagnosis, years
≤61 5,873 (40.32) 7 6.74–7.26 1,466 (40.25) 7 6.39–7.61
62–73 5,614 (38.54) 5 4.80–5.20 1,405 (38.58) 5 4.60–5.40
≥74 3,080 (21.14) 4 3.83–4.17 711 (19.52) 4 3.66–4.34
histology
adenocarcinoma 9,420 (64.67) 6 5.80–6.20 2,389 (65.60) 6 5.58–6.42
squamous cell carcinoma 2,369 (16.26) 4 3.75–4.26 565 (15.51) 4 3.44–4.56
large cell carcinoma 381 (2.62) 4 3.29–4.71 93 (2.55) 4 3.06–4.94
Others 2,397 (16.46) 4 3.71–4.29 595 (16.34) 4 3.43–4.57
grade
i 236 (1.62) 9 7.00–11.00 60 (1.65) 8 4.20–11.80
ii 1,538 (10.56) 7 6.47–7.53 359 (9.86) 6 4.58–7.42
iii 3,865 (26.53) 5 4.77–5.23 1,016 (27.90) 5 4.55–5.45
iV 176 (1.2) 4 3.38–4.62 31 (0.85) 7 3.77–10.23
Unknown 8,752 (60.08) 5 4.84–5.17 2,176 (59.75) 5 4.67–5.33
T stage
T0, T1 1,864 (12.80) 8 7.44–8.56 487 (13.37) 8 7.15–8.85
T2 3,748 (25.73) 6 5.70–6.30 909 (24.96) 6 5.33–6.67
T3 3,319 (22.78) 5 4.74–5.26 813 (22.32) 5 4.58–5.42
T4 4,188 (28.75) 5 4.76–5.24 1,080 (29.65) 4 3.59–4.41
Tx 1,448 (9.94) 5 4.62–5.38 353 (9.69) 4 3.38–4.62
n stage
n0 3,246 (22.28) 7 6.61–7.39 784 (21.53) 7 6.20–7.80
n1 1,229 (8.44) 6 5.39–6.61 293 (8.05) 5 4.05–5.95
n2 6,675 (45.82) 5 4.82–5.18 1,656 (45.47) 5 4.63–5.37
n3 2,837 (19.48) 5 4.71–5.29 741 (20.35) 5 4.50–5.50
nx 580 (3.98) 4 3.33–4.67 168 (4.61) 4 3.30–4.69
Primary site
Main bronchus 671 (4.60) 4 3.47–4.53 152 (4.17) 5 3.43–6.58
lobe 11,883 (81.57) 6 5.84–6.16 3,005 (82.51) 5 4.72–5.28
Overlapping lesion of lung 136 (0.93) 5 3.70–6.31 27 (0.74) 6 3.46–8.54
lung, not otherwise
specified
1,877 (12.89) 5 4.64–5.36 458 (12.58) 5 4.35–5.65
laterality
left 5,732 (39.35) 5 4.77–5.23 1,436 (39.43) 6 5.54–6.46
Right 8,028 (55.11) 5 4.81–5.19 2,019 (55.44) 5 4.65–5.35
Others 807 (5.54) 5 4.38–5.62 187 (5.13) 5 3.97–6.03
With M1a
Yes 3,648 (25.04) 4 3.76–4.24 950 (26.08) 4 3.52–4.48
no 10,919 (74.96) 6 5.82–6.18 2,692 (73.92) 6 5.63–6.37
(Continued)
Cancer Management and Research downloaded from https://www.dovepress.com/ by 118.70.13.36 on 20-Aug-2020
Dovepress a nomogram predicting the Os of patients with distantly metastatic nsClC
percentile) was only 5 (2–12) months. The 1- and 2-year OS survival rate was only 23.8% and 8.0%, respectively.
independent prognostic factors in the
training set
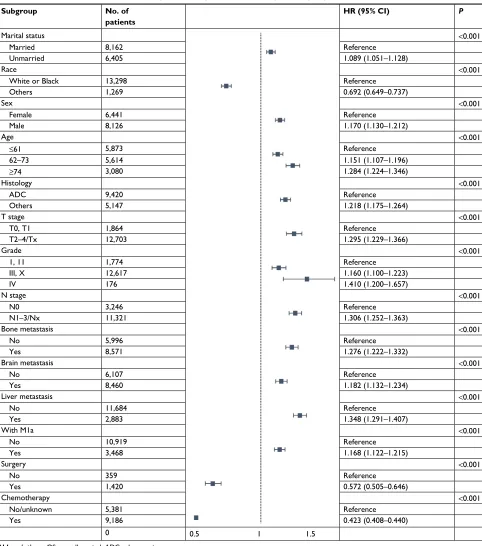
We performed univariable unadjusted Cox analysis to the fol-lowing variables: marital status (married vs unmarried), race (White vs Black vs others), sex (male vs female), age (≤61 vs 62–73 vs ≥74 years), histology type (adenocarcinoma [ADC] vs squamous cell carcinoma vs large cell carcinoma vs others), tumor sites (main bronchus vs lobe vs overlapping lesion of lung vs lung, not otherwise specified), laterality (left vs right vs others), T stage (T0, T1 vs T2 vs T3 vs T4 vs Tx), N stage (N0 vs N1 vs N2 vs N3 vs Nx), histological differentiation (grade I vs grade II vs grade III vs grade IV vs grade X), bone metastasis (yes vs no), brain metastasis (yes vs no), liver metastasis (yes vs no), with M1a (yes vs no), surgery of primary cancer (yes vs no), radiation (yes vs no), and chemotherapy (yes vs no/unknown) using the training cohort. All aforementioned variables except later-ality (P=0.821) were identified as statistically significant prognostic factors (all P<0.001) (Table S1). These prognostic factors were then included in the multivariable analysis, and we observed that radiation therapy was not significantly associated with the OS (P=0.143) (Table S1). During the analysis process, we found that some subgroups of patients had similar OS, we thereby combined these subgroups as one category in the multivariable analysis, including White and Black populations, T2, T3, T4, and Tx, grade I and grade II,
as well as grade III and grade X, N1, N2, N3, and Nx. After combining these subgroups, we conducted the multivariable analysis again. The results showed that all of these factors were still significantly associated with OS. All factors were then incorporated to develop the nomogram. However, we found that four subgroups of tumor sites scored 0, therefore, these variables were removed from the following analysis. After that, we performed the multivariable analysis again, and the remaining 14 variables remained the prognostic factors of OS (Table 2).
nomogram development and validation
We then constructed a nomogram integrating these prog-nostic factors using the training cohort (Figure 2). As is shown in the nomogram, chemotherapy made the largest contribution to the prognosis, followed by surgery of primary cancer, interestingly. Race, tumor grade, presence of liver, bone metastasis, age, T stage, N stage, and histology, which showed moderate impacts on the OS, while the presence of M1a disease, brain metastasis, sex, and marital status made the modest difference to the prognosis. Each negative sub-type within these variables was assigned a score (Table 3). By adding up these scores according to a patient’s condition, the total score was obtained. Then, the total score was located on the total point line, and a straight line could be drawn to estimate the patient’s probability of 1- and 2-year OS. The nomogram had a C-index of 0.704 (95% CI: 0.699–0.709) in the training set and 0.699 (95% CI: 0.689–0.709) in the validation set. The calibration curves for 1- and 2-year OS Table 1 (Continued)Demographic or clinicopathological characteristics
Training set (N=14,567) Validation set (N=3,642) No. of
patients (%)
OS (months) No. of patients (%)
OS (months) Median 95% CI Median 95% CI
Brain metastasis
Yes 8,460 (58.08) 6 5.80–6.20 2,143 (58.84) 5 4.59–5.41
no 6,107 (41.92) 5 4.82–5.18 1,499 (41.16) 5 4.62–5.38
liver metastasis
Yes 2,883 (19.79) 4 3.81–4.19 680 (18.67) 3 2.68–3.32
no 11,684 (80.21) 6 5.83–6.17 2,962 (81.33) 6 5.64–6.36
Radiation
Yes 14,304 (98.19) 5 4.86–5.14 3,582 (98.35) 5 4.74–5.26
no 263 (1.80) 2 1.66–2.35 60 (1.65) 2 1.37–2.63
Chemotherapy
Yes 9,186 (63.06) 8 7.79–8.21 2,330 (63.98) 8 7.56–8.44
no/Unknown 5,381 (36.94) 2 1.92–2.08 1,312 (36.02) 2 1.84–2.16
surgery
Yes 359 (2.46) 13 11.10–14.90 95 (2.61) 13 9.95–16.05
no 14,208 (97.54) 5 4.87–5.13 3,547 (97.39) 5 4.75–5.25
Cancer Management and Research downloaded from https://www.dovepress.com/ by 118.70.13.36 on 20-Aug-2020
Dovepress Deng et al
showed acceptable agreement between the predicted and actual survival in both cohorts (Figures 3 and 4).
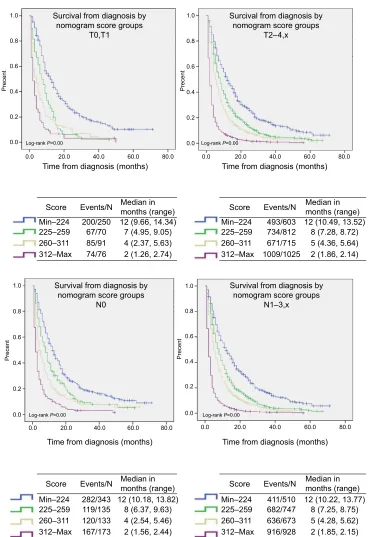
Risk stratifications
We added the total score for every patient in the training set, and then sorted the patients according to the scores to
get the quartile of prognosis scores: Min–224, 225–259, 260–311, and 312–Max. Each risk group represented a dis-tinct prognosis. We observed significant disdis-tinctions between the Kaplan–Meier curves (P=0.00) within overall patients or patients with brain, liver, bone metastasis, as well as T0, T1 stage, T2–4, Tx stage, N0 stage, and N1–3, Nx stage, Table 2 Results of the multivariable Cox regression analysis after combining the subgroups with similar Os
Subgroup No. of patients
HR (95% CI) P
Marital status <0.001
Married 8,162 Reference
Unmarried 6,405 1.089 (1.051–1.128)
Race <0.001
White or Black 13,298 Reference
Others 1,269 0.692 (0.649–0.737)
sex <0.001
Female 6,441 Reference
Male 8,126 1.170 (1.130–1.212)
age <0.001
≤61 5,873 Reference
62–73 5,614 1.151 (1.107–1.196)
≥74 3,080 1.284 (1.224–1.346)
histology <0.001
aDC 9,420 Reference
Others 5,147 1.218 (1.175–1.264)
T stage <0.001
T0, T1 1,864 Reference
T2–4/Tx 12,703 1.295 (1.229–1.366)
grade <0.001
1, 11 1,774 Reference
iii, X 12,617 1.160 (1.100–1.223)
iV 176 1.410 (1.200–1.657)
n stage <0.001
n0 3,246 Reference
n1–3/nx 11,321 1.306 (1.252–1.363)
Bone metastasis <0.001
no 5,996 Reference
Yes 8,571 1.276 (1.222–1.332)
Brain metastasis <0.001
no 6,107 Reference
Yes 8,460 1.182 (1.132–1.234)
liver metastasis <0.001
no 11,684 Reference
Yes 2,883 1.348 (1.291–1.407)
With M1a <0.001
no 10,919 Reference
Yes 3,468 1.168 (1.122–1.215)
surgery <0.001
no 359 Reference
Yes 1,420 0.572 (0.505–0.646)
Chemotherapy <0.001
no/unknown 5,381 Reference
Yes 9,186 0.423 (0.408–0.440)
0 0.5 1 1.5
Abbreviations: Os, overall survival; aDC, adenocarcinoma.
Cancer Management and Research downloaded from https://www.dovepress.com/ by 118.70.13.36 on 20-Aug-2020
Dovepress a nomogram predicting the Os of patients with distantly metastatic nsClC
respectively, after applying the cutoff values to divide the patients in the validation cohort, as shown in Figures 5 and 6.
Discussion
In the current study, we established a nomogram to predict the prognosis of general distantly metastatic NSCLC patients using the data retrieved from the SEER database. A total of 18,209 cases were included, and 14 significant prognosis
factors that represent demographic, pathological, and treat-ment data were identified by conducting uni- and subsequent multivariable analysis in the training set and then integrated to construct the nomogram. The validation showed that the nomogram is of acceptable discrimination ability with a C-index of 0.704 (95% CI: 0.699–0.709) in the training set and 0.699 (95% CI: 0.689–0.709) in the validation set. As is shown in the calibration blots, the nomogram can predict Bone metastasis
N stage Grade T stage Histology Age Sex Race Marital status
0
Unmarried Married
Others
Female 62–73
≤61 Others ≥74
White or Black
ADC T0 I,II
No No
No No
No
No/unknown No
Yes Yes
Yes
Yes Yes
Yes N1–3/Nx T2–4/Tx
IV III,X
0 50
0.8 0.8
0.7 0.6 0.5 0.4 0.3 0.2 0.1
0.7 0.6 0.5 0.4 0.3 0.2 0.1
100 150 200 250 300 350 400 450 500
Male
10 20 30 40 50 60 70 80 90 100
Points
2-year survival 1-year survival Total points Chemotherapy Surgery With M1a Liver metastasis Brain metastasis
Figure 2 nomogram for predicting 1- and 2-year Os of nsClC patients with distant organ metastasis (“surgery” refers to surgery to the primary cancer site).
Abbreviations: aDC, adenocarcinoma; nsClC, non-small-cell lung cancer; Os, overall survival.
1–year survival 2–year survival
0.0 0.0 0.2 0.4 0.6 0.8 1.0
0.2 0.4
Predicted survival probability
Observed survival probabilit
y
0.6 0.8 1.0
Figure 3 Calibration plots of the internal training cohort.
Cancer Management and Research downloaded from https://www.dovepress.com/ by 118.70.13.36 on 20-Aug-2020
Dovepress Deng et al
1- and 2-year OS accurately. The nomogram was also capable of stratifying patients into different risk groups within the patients presented with bone, liver, or brain metastasis, as well as T, N stages.
To the best of our knowledge, this is the first prog-nosis nomogram developed for general NSCLC patients
with distant organ metastasis based on a large, diverse, population-based cohort that was collected from the SEER program. This nomogram can easily predict the prognosis of a patient and inform individual benefits of certain medical treatments as well as stratify the patient into different risk subgroups, which might be meaning-ful and informatory for clinical decision-making. For example, for the metastatic EGFR-mutated NSCLC, the National Comprehensive Cancer Network guideline rec-ommended the EGFR-TKIs as their first-line therapy,15 among them, this nomogram can help to recognize the high-risk subgroups that may need more intensive treat-ments like chemotherapy at the same time. In addition, for the high-risk subgroup among the whole population determined by our nomogram, we should pay closer atten-tion and shorten the follow-up period in order to adjust treatment methods in a timely manner according to the changes of their tumor condition. We can also give them more palliative care like psychological or sentimental sup-port and encourage them to participate in clinical trials of anticancer drugs. Furthermore, these tools may help the designers of clinical trials to get more equivalent baselines between different study groups. It is also worth noting that the SEER database covers 34.6% of the US population,12 which, therefore, guarantees the representativeness of our nomogram and implies the potential universal application of our nomogram, which has an acceptable discrimination ability and excellent prediction accuracy.
1–year survival 2–year survival
0.0 0.0 0.2 0.4 0.6 0.8 1.0
0.2 0.4
Predicted survival probability
Observed survival probabilit
y
0.6 0.8 1.0
Figure 4 Calibration plots of the external validation cohort.
Table 3 scores of every subgroup within each variable
Variables Points Variables Points
Marital status grade
Married 0 i, ii 0
Unmarried 9 iii, X 17
Race iV 40
White or Black 42 Bone metastasis
Others 0 no 0
sex Yes 29
Female 0 Brain metastasis
Male 17 no 0
age Yes 20
≤61 0 liver metastasis
62–73 17 no 0
≥74 29 Yes 35
histology With M1a
aDC 0 no 0
Others 23 Yes 18
T stage surgery
T0, T1 0 no 62
T2–4/Tx 30 Yes 0
n stage Chemotherapy
n0 0 no/unknown 100
n1–3/nx 31 Yes 0
Abbreviation: aDC, adenocarcinoma.
Cancer Management and Research downloaded from https://www.dovepress.com/ by 118.70.13.36 on 20-Aug-2020
Dovepress a nomogram predicting the Os of patients with distantly metastatic nsClC
Notably, we did not include the NSCLC patients with stage M1a. It is because the prognosis of M1a patients is significantly better than M1b patients, and the presence with M1a disease would have a contradictory impact on M1a and M1b patients, which would result in wrong scores in M1a item of the nomogram.
Marital status, sex, race, age, histology, T stage, N stage, histological differentiation, the presence of bone metastasis,
brain metastasis, liver metastasis, M1a disease, surgery of primary cancer, and chemotherapy were identified as the prognostic factors of the OS, which was in line with the previous studies.5,7,8,11,16–18 Among them, surgery of primary cancer could notably improve the prognosis. Thus, we ana-lyzed the characteristics of these patients who underwent surgery and found that all of them received radiation therapy, and most of them received chemotherapy. Surgery to the Time from diagnosis (months)
Score Min–224 225–259 260–311 312–Max 693/853 801/882 756/806 1083/1101
12 (10.75, 13.25) 8 (7.32, 8.68) 5 (4.53, 5.47) 2 (1.84, 2.16)
Events/N Median inmonths (range)
Time from diagnosis (months) Survival from diagnosis by
nomogram score groups overall 0.0 0.0 0.2 0.4 0.6 0.8 1.0 20.0 Precent
Log-rank P=0.00
40.0 60.0 80.0
Survival from diagnosis by nomogram score groups
bone metastasis 0.0 0.0 0.2 0.4 0.6 0.8 1.0 20.0 Precent
Log-rank P=0.00
40.0 60.0 80.0
Survival from diagnosis by nomogram score groups
brain metastasis 0.0 0.0 0.2 0.4 0.6 0.8 1.0 20.0 Precent
Log-rank P=0.00
40.0 60.0 80.0
Survival from diagnosis by nomogram score groups
liver metastasis 0.0 0.0 0.2 0.4 0.6 0.8 1.0 20.0 Precent
Log-rank P=0.00
40.0 60.0 Score Min–224 225–259 260–311 312–Max 298/362 471/519 545/581 700/713
13 (10.91, 15.09) 8 (6.96, 9.04) 5 (4.30, 5.70) 2 (1.83, 2.17)
Events/N Median inmonths (range)
Time from diagnosis (months)
Score Min–224 225–259 260–311 312–Max 450/568 464/512 420/450 604/613
13 (11.44, 14.56) 7 (6.18, 7.82) 5 (4.53, 5.66) 2 (1.82, 2.18)
Events/N Median inmonths (range)
Time from diagnosis (months)
Score Min–224 225–259 260–311 312–Max 30/35 86/95 239/250 294/267
7 (1.21, 12.80) 6 (4.55, 7.45) 5 (4.09, 5.91) 2 (1.68, 2.32)
Events/N Median inmonths (range)
Figure 5 Risk group stratification within overall patients and each metastatic site.
Cancer Management and Research downloaded from https://www.dovepress.com/ by 118.70.13.36 on 20-Aug-2020
Dovepress Deng et al
primary cancer site was treated as a part of the multimodality regimens. David et al queried the California Cancer Reg-istry and identified 34,016 patients to make an unmatched survival analysis; they also found that the stage IV NSCLC patients who underwent surgical procedures as a part of their multimodality therapy had significantly longer median OS than these receiving non-surgical treatments (9.4–28 vs
2–10 months).19 Given the patients’ favorable responses to systemic therapies like targeted therapy and immunotherapy, surgery to the primary cancer might be reconsidered as a part of multimodality therapy. Surgery can provide enough tissue to enable detailed molecular and genetic subtyping of NSCLC.20 It can also decrease patients’ tumor burden and alleviate or eliminate the complications caused by tumors to Time from diagnosis (months)
Score Min–224 225–259 260–311 312–Max 200/250 67/70 85/91 74/76
12 (9.66, 14.34) 7 (4.95, 9.05) 4 (2.37, 5.63) 2 (1.26, 2.74)
Events/N Median inmonths (range)
Time from diagnosis (months) Surcival from diagnosis by
nomogram score groups T0,T1 0.0 0.0 0.2 0.4 0.6 0.8 1.0 20.0 Precent
Log-rank P=0.00
40.0 60.0 80.0
Surcival from diagnosis by nomogram score groups
T2–4,x 0.0 0.0 0.2 0.4 0.6 0.8 1.0 20.0 Precent
Log-rank P=0.00
40.0 60.0 80.0
Survival from diagnosis by nomogram score groups
N0 0.0 0.0 0.2 0.4 0.6 0.8 1.0 20.0 Precent
Log-rank P=0.00
40.0 60.0 80.0
Survival from diagnosis by nomogram score groups
N1–3,x 0.0 0.0 0.2 0.4 0.6 0.8 1.0 20.0 Precent
Log-rank P=0.00
40.0 60.0 80.0
Score Min–224 225–259 260–311 312–Max 493/603 734/812 671/715 1009/1025
12 (10.49, 13.52) 8 (7.28, 8.72) 5 (4.36, 5.64) 2 (1.86, 2.14)
Events/N Median inmonths (range)
Time from diagnosis (months)
Score Min–224 225–259 260–311 312–Max 282/343 119/135 120/133 167/173
12 (10.18, 13.82) 8 (6.37, 9.63) 4 (2.54, 5.46) 2 (1.56, 2.44)
Events/N Median inmonths (range)
Time from diagnosis (months)
Score Min–224 225–259 260–311 312–Max 411/510 682/747 636/673 916/928
12 (10.22, 13.77) 8 (7.25, 8.75) 5 (4.28, 5.62) 2 (1.85, 2.15)
Events/N Median inmonths (range)
Figure 6 Risk group stratification within TN stage with similar OS.
Abbreviations: Tn, tumor node; Os, overall survival.
Cancer Management and Research downloaded from https://www.dovepress.com/ by 118.70.13.36 on 20-Aug-2020
Dovepress a nomogram predicting the Os of patients with distantly metastatic nsClC
improve patients’ life quality. However, it should be noted that not all patients can benefit from surgery; whether sur-gical treatment should be performed on metastatic NSCLC patients should take various individual, treatment-related and disease-related factors into consideration and care-fully discussed in a multidisciplinary setting.21 Moreover, surprisingly, radiation therapy did not remain significant statistically in the multivariable analysis (P=0.143), which indicates that radiotherapy has a modest impact on OS, just as a previous study reported.22 But radiation therapy is still an option of palliative care to relieve pain or complications of patients and may have potential to prolong patients’ OS. AD was associated with the best prognosis, which might be partly interpreted by the fact that AD presents with much more EGFR gene mutations, making AD more sensitive to EGFR-TKIs. Among distant metastatic sites, liver metasta-sis was associated with the poorest prognometasta-sis, followed by bone metastasis, that was in high concordance with a previ-ous research, which analyzed 17,431 lung cancer patients in Sweden.7 In a word, our nomogram included rational prognostic factors of distantly metastatic NSCLC patients.
Limitations: 1) The important prognostic factors of advanced lung cancer that were identified in previous studies, such as performance status score, body mass index, smoking status, appetite condition, genotype characteristics, serum markers, skin/adrenal metastasis, the usage of EGFR-TKIs or vascular endothelial growth factor-targeted drugs, and the detailed information of chemotherapy were not taken into consideration in this study because there were no such information provided by the SEER database.2,3,6,23 2) All patients were staged according to the seventh edition of the TNM classification for lung cancer; however, the coding rules on tumor extension made us difficult to restage the patients according to the latest eighth edition of the TNM classification. For example, CS extension code 600 included lung cancers extended to diaphragm, chest wall, or Pancoast cancer. Lung cancers extended to chest wall, Pancoast cancer, which are at stage T3 according to the seventh and eighth edition of the TNM classification while lung cancers extended to diaphragm is already changed to stage T4 according to the latest eighth edition of the TNM classification.13,24 As a result, we cannot determine the T stage of a patient with this code in the latest eighth edition of the TNM classifica-tion, which may result in inconvenience in the use of the nomogram. 3) The third limitation is the retrospective nature of the data collection from the SEER database. Moreover, overall sensitivity was 68% and 80% for chemotherapy and radiotherapy, respectively, despite a high specificity of these data.25 4) The nomogram is only generalized based on the data
of the patients in the USA and thus, might not be representa-tive of the patients worldwide. 5) The SEER database only provided information on metastasis to bone, brain, and liver at diagnosis, without taking the metastasis during follow-up periods into consideration. Therefore, global prospective data with the latest TNM classification and more comprehensive prognostic factors are needed to improve this model.
Conclusion
A nomogram was established and validated to predict indi-vidual prognosis for the general distantly metastatic NSCLC patients. Global prospective data with the latest TNM clas-sification and more comprehensive prognostic factors are needed to improve this nomogram.
Acknowledgments
We thank all the members of the National Cancer Institute, who have been involved with the SEER program for their hard work in data collection.
Author contributions
Conception and design: Jianqing Deng, Xiangyang Chu. Collection and assembly of data: Jianqing Deng, Zhipeng Ren, Jiaxin Wen. Data analysis and interpretation: all authors. Manuscript writing: all authors. All authors contributed to data analysis, drafting and revising the article, gave final approval of the version to be published, and agree to be accountable for all aspects of the work.
Disclosure
The authors report no conflicts of interest in this work.
References
1. Siegel RL, Miller KD, Jemal A. Cancer statistics, 2017. CA Cancer J Clin. 2017;67(1):7–30.
2. He YY, Zhang XC, Yang JJ, et al. Prognostic significance of genotype and number of metastatic sites in advanced non-small-cell lung cancer. Clin Lung Cancer. 2014;15(6):441–447.
3. Hoang T, Xu R, Schiller JH, Bonomi P, Johnson DH. Clinical model to predict survival in chemonaive patients with advanced non-small-cell lung cancer treated with third-generation chemotherapy regimens based on eastern cooperative oncology group data. J Clin Oncol. 2005;23(1):175–183.
4. Collaud S, Stahel R, Inci I, et al. Survival of patients treated surgically for synchronous single-organ metastatic NSCLC and advanced patho-logic TN stage. Lung Cancer. 2012;78(3):234–238.
5. Dai C, Ren Y, Xie D, et al. Does lymph node metastasis have a negative prognostic impact in patients with NSCLC and M1a disease? J Thorac Oncol. 2016;11(10):1745–1754.
6. Hoang T, Dahlberg SE, Sandler AB, Brahmer JR, Schiller JH, Johnson DH. Prognostic models to predict survival in non-small-cell lung cancer patients treated with first-line paclitaxel and carboplatin with or without bevacizumab. J Thorac Oncol. 2012;7(9):1361–1368.
7. Riihimäki M, Hemminki A, Fallah M, et al. Metastatic sites and survival in lung cancer. Lung Cancer. 2014;86(1):78–84.
Cancer Management and Research downloaded from https://www.dovepress.com/ by 118.70.13.36 on 20-Aug-2020
Dovepress Deng et al
8. Shen H, Cao Y, Li X, et al. Surgical intervention improves sur-vival for metastatic non-small cell lung cancer patients. Medicine. 2016;95(21):e3800.
9. Balachandran VP, Gonen M, Smith JJ, Dematteo RP. Nomo-grams in oncology: more than meets the eye. Lancet Oncol. 2015;16(4):e173–e180.
10. Barnholtz-Sloan JS, Yu C, Sloan AE, et al. A nomogram for individual-ized estimation of survival among patients with brain metastasis. Neuro Oncol. 2012;14(7):910–918.
11. Ren Y, Dai C, Zheng H, et al. Prognostic effect of liver metasta-sis in lung cancer patients with distant metastametasta-sis. Oncotarget. 2016;7(33):53245–53353.
12. Surveillance, Epidemiology, and End Results Program: Overview of the SEER Program. Available from: https://seer.cancer.gov/about/overview. html. Accessed November 02, 2018.
13. Collaborative Stage Data Collection System Coding Instructions, Version 02.05. Available from: http://web2.facs.org/cstage0205/lung/ Lungschema.html. Accessed November 02, 2018.
14. Camp RL, Dolled-Filhart M, Rimm DL. X-tile: a new bio-informatics tool for biomarker assessment and outcome-based cut-point optimiza-tion. Clin Cancer Res. 2004;10(21):7252–7259.
15. NCCN. Clinical practice guidelines in oncology. Non-small cell lung cancer, Version 6; 2018. Available from: https://www.nccn. org/patients/guidelines/cancers.aspx#nsclc. Accessed October 25, 2018.
16. Kawano D, Takeo S, Katsura M, Tsukamoto S, Masuyama E, Nakaji Y. Surgical treatment of stage IV non-small cell lung cancer. Interact Cardiovasc Thorac Surg. 2012;14(2):167–170.
17. Siddiqui F, Bae K, Langer CJ, et al. The influence of gender, race, and marital status on survival in lung cancer patients: analysis of Radiation Therapy Oncology Group trials. J Thorac Oncol. 2010;5(5):631–639. 18. Lo Russo G, Imbimbo M, Garassino MC. Is the chemotherapy era in
advanced non-small cell lung cancer really over? Maybe not yet. Tumori. 2016;2016(3):223–225.
19. David EA, Canter RJ, Chen Y, Cooke DT, Cress RD. Surgical manage-ment of advanced non-small cell lung cancer is decreasing but is associ-ated with improved survival. Ann Thorac Surg. 2016;102(4):1101–1109. 20. David EA, Clark JM, Cooke DT, Melnikow J, Kelly K, Canter RJ. The
role of thoracic surgery in the therapeutic management of metastatic non-small cell lung cancer. J Thorac Oncol. 2017;12(11):1636–1645. 21. Abdel-Rahman O. Outcomes of surgery as part of the management of
metastatic non-small-cell lung cancer: a Surveillance, Epidemiology and End Results database analysis. Cancer Invest. 2018;36(4):238–245. 22. Cai Y, Wang WL, Xu B, Zhu GY, Zhang SW. Survival status of stage
IV non-small cell lung cancer patients after radiotherapy – a report of 287 cases. Ai Zheng. 2006;25(11):1419–1422.
23. Kogure Y, Ando M, Saka H, et al. Histology and smoking status predict survival of patients with advanced non-small-cell lung cancer. Results of West Japan Oncology Group (WJOG) Study 3906L. J Thorac Oncol. 2013;8(6):753–758.
24. Goldstraw P, Chansky K, Crowley J, et al. The IASLC Lung Cancer Staging Project: proposals for revision of the TNM stage groupings in the forthcoming (eighth) edition of the TNM classification for lung cancer. J Thorac Oncol. 2016;11(1):39–51.
25. Noone AM, Lund JL, Mariotto A, et al. Comparison of SEER treatment data with medicare claims. Med Care. 2016;54(9):e55–e64.
Cancer Management and Research downloaded from https://www.dovepress.com/ by 118.70.13.36 on 20-Aug-2020
Dovepress a nomogram predicting the Os of patients with distantly metastatic nsClC
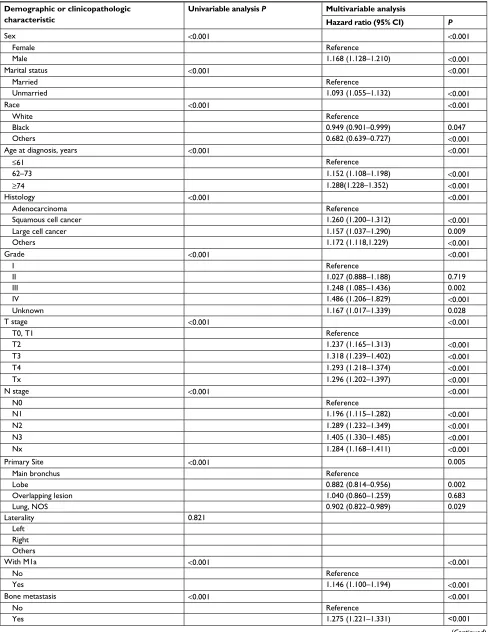
Supplementary material
Table S1 Results of the univariable and multivariable Cox regression analysis before combining the subgroups with similar Os
Demographic or clinicopathologic characteristic
Univariable analysis P Multivariable analysis
Hazard ratio (95% CI) P
sex <0.001 <0.001
Female Reference
Male 1.168 (1.128–1.210) <0.001
Marital status <0.001 <0.001
Married Reference
Unmarried 1.093 (1.055–1.132) <0.001
Race <0.001 <0.001
White Reference
Black 0.949 (0.901–0.999) 0.047
Others 0.682 (0.639–0.727) <0.001
age at diagnosis, years <0.001 <0.001
≤61 Reference
62–73 1.152 (1.108–1.198) <0.001
≥74 1.288(1.228–1.352) <0.001
histology <0.001 <0.001
adenocarcinoma Reference
squamous cell cancer 1.260 (1.200–1.312) <0.001
large cell cancer 1.157 (1.037–1.290) 0.009
Others 1.172 (1.118,1.229) <0.001
grade <0.001 <0.001
i Reference
ii 1.027 (0.888–1.188) 0.719
iii 1.248 (1.085–1.436) 0.002
iV 1.486 (1.206–1.829) <0.001
Unknown 1.167 (1.017–1.339) 0.028
T stage <0.001 <0.001
T0, T1 Reference
T2 1.237 (1.165–1.313) <0.001
T3 1.318 (1.239–1.402) <0.001
T4 1.293 (1.218–1.374) <0.001
Tx 1.296 (1.202–1.397) <0.001
n stage <0.001 <0.001
n0 Reference
n1 1.196 (1.115–1.282) <0.001
n2 1.289 (1.232–1.349) <0.001
n3 1.405 (1.330–1.485) <0.001
nx 1.284 (1.168–1.411) <0.001
Primary site <0.001 0.005
Main bronchus Reference
lobe 0.882 (0.814–0.956) 0.002
Overlapping lesion 1.040 (0.860–1.259) 0.683
lung, nOs 0.902 (0.822–0.989) 0.029
laterality 0.821
left Right Others
With M1a <0.001 <0.001
no Reference
Yes 1.146 (1.100–1.194) <0.001
Bone metastasis <0.001 <0.001
no Reference
Yes 1.275 (1.221–1.331) <0.001
(Continued)
Cancer Management and Research downloaded from https://www.dovepress.com/ by 118.70.13.36 on 20-Aug-2020
Dovepress
Cancer Management and Research
Publish your work in this journal
Submit your manuscript here: https://www.dovepress.com/cancer-management-and-research-journal Cancer Management and Research is an international, peer-reviewed open access journal focusing on cancer research and the optimal use of preventative and integrated treatment interventions to achieve improved outcomes, enhanced survival and quality of life for the cancer patient. The manuscript management system is completely online and includes
a very quick and fair peer-review system, which is all easy to use. Visit http://www.dovepress.com/testimonials.php to read real quotes from published authors.
Dovepress
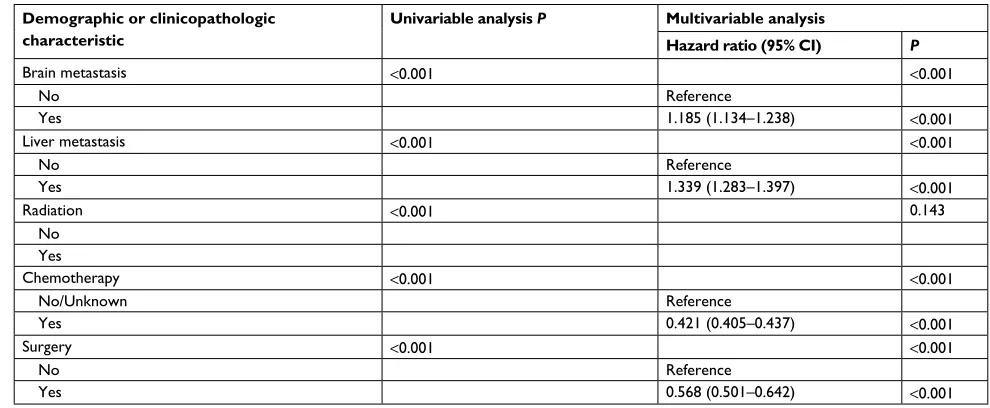
Deng et alDemographic or clinicopathologic characteristic
Univariable analysis P Multivariable analysis
Hazard ratio (95% CI) P
Brain metastasis <0.001 <0.001
no Reference
Yes 1.185 (1.134–1.238) <0.001
liver metastasis <0.001 <0.001
no Reference
Yes 1.339 (1.283–1.397) <0.001
Radiation <0.001 0.143
no Yes
Chemotherapy <0.001 <0.001
no/Unknown Reference
Yes 0.421 (0.405–0.437) <0.001
surgery <0.001 <0.001
no Reference
Yes 0.568 (0.501–0.642) <0.001
Abbreviation: Os, overall survival.
Table S1 (Continued)
Cancer Management and Research downloaded from https://www.dovepress.com/ by 118.70.13.36 on 20-Aug-2020