Mapping of Quantitative Trait Loci Controlling Adaptive Traits in Coastal
Douglas Fir. III. Quantitative Trait Loci-by-Environment Interactions
Kathleen D. Jermstad,* Daniel L. Bassoni,*
,1Keith S. Jech,
†Gary A. Ritchie,
†Nicholas C. Wheeler
†and David B. Neale*
,‡,2*Institute of Forest Genetics, Pacific Southwest Research Station, U.S. Department of Agriculture Forest Service, Placerville, California 95667, †Weyerhaeuser Technical Center, Tacoma, Washington 98063-9777 and‡Department of Environmental Horticulture,
University of California, Davis, California 95616 Manuscript received February 20, 2003
Accepted for publication July 7, 2003
ABSTRACT
Quantitative trait loci (QTL) were mapped in the woody perennial Douglas fir (Pseudotsuga menziesii var.menziesii[Mirb.] Franco) for complex traits controlling the timing of growth initiation and growth cessation. QTL were estimated under controlled environmental conditions to identify QTL interactions with photoperiod, moisture stress, winter chilling, and spring temperatures. A three-generation mapping population of 460 cloned progeny was used for genetic mapping and phenotypic evaluations. An all-marker interval mapping method was used for scanning the genome for the presence of QTL and single-factor ANOVA was used for estimating QTL-by-environment interactions. A modest number of QTL were detected per trait, with individual QTL explaining up to 9.5% of the phenotypic variation. Two QTL-by-treatment interactions were found for growth initiation, whereas several QTL-QTL-by-treatment interactions were detected among growth cessation traits. This is the first report of QTL interactions with specific environmental signals in forest trees and will assist in the identification of candidate genes controlling these important adaptive traits in perennial plants.
D
OUGLAS fir (Pseudotsuga menziesii var. menziesii ble of releasing dormancy, with the optimal tempera-ture beingⵑ4.5⬚(Ritchie1984). In a “normal” North-[Mirb.] Franco) is the most ecologically andeco-nomically important forest tree species in the Pacific western winter, Douglas fir is exposed to⬎2000 hr of winter chill (Ritchie1984). The ambient temperature Northwest region of the United States and Canada. Like
most temperate woody plants, Douglas fir is well adapted of the air and soil in the spring is also important in the timing of dormancy release and rate of cell expansion to strong seasonal cycles and attendant environmental
signals. Environmental signals such as photoperiodicity, in the spring. In locations or years in which the winter chilling requirement is unsatisfied, warm spring temper-temperature, and winter chilling affect dormancy
re-lease, cell cycling, and elongation of meristematic tissue atures and extended day length compensate, initiating the release of dormancy (CampbellandSugano1975). in the spring (CampbellandSugano1975;Campbell
Photoperiod, temperature, and moisture stress affect andSorensen1978;Steiner1979;BigrasandD’Aoust
growth cessation and hardening in the fall (Eriksson
1993;Ha¨nninen 1995). The signals that modulate the
et al. 1978;MacDonald and Owens 1993;Partanen
timing of spring bud flush are, predominately, winter
andBeuker 1999;Repoet al. 2000). The key environ-chilling and spring temperatures. These signals have a
mental signal governing timing of bud set, for most synergistic effect on the release of dormancy in the
temperate woody plants, is photoperiod (Vegis 1964; spring, providing the adaptive plasticity needed to
sur-Perry 1971). In summer, as day length begins to de-vive yearly climatic fluctuations. Winter chilling is
pro-crease, the shoot responds by forming a resting bud. longed exposure to low temperatures and the winter
Coastal Douglas fir, however, is also responsive to water chill requirement is an elegant adaptation of a broad
stress (Lavenderet al. 1968), reflecting its adaptation spectrum of woody plants (Sorensen1983), which
en-to prolonged summer droughts typical of the climate ables them to “sense” when winter is over, so that growth
in which it grows. As soil moisture declines in mid- to resumption can occur with minimal risk of frost damage.
late summer, shoot elongation is suspended and buds Winter temperatures ranging from⫺1⬚to 12⬚are
capa-begin to form. If young Douglas fir seedlings are ex-posed to an increase in soil moisture during late sum-mer, they will flush again and produce a new shoot
1Present address:Virtual Arrays, Inc., Sunnyvale, CA 94089.
2Corresponding author:Institute of Forest Genetics, Pacific Southwest called a “lammas” shoot, which will eventually form an
Research Station, U.S. Department of Agriculture Forest Service, De- overwintering bud but is less cold hardy than a normal partment of Environmental Horticulture, University of California, 1
shoot. Growth from a lammas bud is referred to as “free Shields Ave., Davis, CA 95616.
E-mail: [email protected] growth” and considered distinct from growth from the
overwintering bud, which is referred to as “predeter- rhythm, depending on the environment in which the trees are grown. Therefore, it is important to know how mined growth” (Kayaet al.1994). The timing of growth
initiation and cessation is associated with susceptibility environmental signals interact with QTL that control growth rhythm in trees.
to late spring and early fall frosts, respectively, and is
therefore important to the long-term survival and vigor QTL ⫻ E interactions have been mapped in angio-sperm species using recombinant inbred lines (RILs), of the tree.
Controlled environments have been used to estimate near-isogenic lines (NILs), and doubled haploids (DH). Using these materials, different treatments can be ap-the effects of winter chilling, spring heat, photoperiod,
and moisture stress on Douglas fir bud phenology plied to replicated progeny in controlled environments (Patersonet al. 1991;Stuberet al.1992;Jansenet al. (CampbellandSugano1975;Kaya1992;MacDonald
andOwens1993).CampbellandSugano(1975) con- 1995;Borevitzet al. 2002;Rauhet al. 2002). Thus far, QTL⫻Einteractions have been identified in only two cluded that the effects of spring flushing temperature
and winter chill sum on spring bud flush were highly forest tree species, poplar (Wuet al. 1998) and Douglas fir (Jermstadet al. 2001a). In both studies, the progeny variable, depending upon the provenance being tested.
The effect of photoperiod was significant on the timing were clonally propagated by rooted cuttings, which were then planted at multiple test sites where height or phe-of spring bud flush only when the winter chilling
re-quirement was not met. In reference to bud set,Mac- nology traits were measured. To date, QTL⫻E interac-tions have not been estimated in forest trees under
experi-Donald and Owens (1993) reported that the effect
of moisture on bud scale initiation was dependent on mental application of specific environmental treatments. We have designed two experiments to estimate QTL⫻ photoperiod and secondarily on temperature. Moisture
stress decreased mitotic activity, reduced the size of the Einteractions for growth initiation and growth cessation traits by subjecting cloned progeny from a full-sib family apical dome and the number of bud leaf primordia,
and slowed the rate of bud formation. These controlled- to different levels of key environmental signals in con-trolled environments. In the growth initiation (bud flush) environment experiments were valuable for
multivari-ate dissection of environmental factors affecting bud experiment, QTL interacting with winter chill and spring flushing temperatures were mapped. In the phenology traits in Douglas fir. However, information
about the number of genes controlling these traits, the growth cessation experiment (bud set and related growth-rhythm traits), QTL interacting with day length degree of their individual effects, and their interactions
with environmental signals could not be determined. and moisture stress were mapped. A third experiment was performed, measuring bud flush in replicated field Growth-rhythm traits in temperate trees are typically
under moderate to strong genetic control. Narrow-sense tests to evaluate repeated detection of QTL in multiple environments and to also map QTL interacting with heritabilities for bud flush in Douglas fir range from
0.44 to 0.95 (reviewed inJermstadet al.2001a) while site.
To facilitate these experiments, a new mapping popu-heritabilities for bud set range from 0.30 for seedlings
to⬎0.80 for saplings (LiandAdams1993;O’Neillet lation (cohort) was derived from the same parents and grandparents that were used in previous QTL studies al. 2001). Until recently, the inheritance of quantitative
traits was studied solely by measurements on the pheno- (Jermstadet al.2001a,b) and clonally replicated through rooted cuttings. The use of clones provided precision type. The development of genetic maps has now made
it possible to obtain knowledge about the number of for estimating phenotypic values and enabled the esti-mation of QTL for multiple treatments using a single genes responsible for quantitative traits, their location
within the genome, and their individual effects. Over mapping population. More than 9000 plants were evalu-ated in this study.
the last two decades, quantitative trait loci (QTL) map-ping of complex traits has become common in agricul-tural research (Edwards et al. 1987; Lander and
MATERIALS AND METHODS
Botstein1989;LippmanandTanksley2001;
Georgi-adyet al. 2002). The number of reports of QTL mapping Plant materials:A clonal mapping population (cohort 2) was generated from the same parents of an earlier QTL map-in forest trees for economically important traits, such
ping population (cohort 1; Figure 1A;Jermstadet al. 2001a,b). as growth, phenology, and development, is increasing
Seeds were sown in a greenhouse in early 1997 and grown (Grooveret al. 1994;BradshawandStettler1995;
continuously for 9 months to produce stock for rooted cutting
Frewen et al. 2000; Hurme et al. 2000; Sewell et al. production. Cuttings were harvested from 474 stock plants in 2000, 2002;Jermstadet al. 2001a). Nonetheless, all of February 1998, placed in 50:50 peat:perlite rooting mix in Multipot 104 trays, and then maintained under operational these experiments were conducted under field
condi-rooted cutting conditions (Ritchie1993). Thirty-two cuttings tions with no control over influential environmental
per clone were propagated and the stock plants were dis-signals such as temperature, moisture, and photoperiod.
sets (11 Styro-45 containers per set) were created and placed two for each of four treatment combinations. Pots were placed outdoors on tables and given overhead fertigation as needed. in an outdoor growing area with overhead fertigation for the
remainder of the growing season. The remaining cuttings The cuttings in two of the four treatment combinations re-ceived extended day length (supplemental light set to 16 hr) were transplanted to nursery holding beds, or permanent
clone banks, or were sacrificed for genotyping purposes. from June 21, 1999 ( JD 172; Figure 1B) until September 21, 1999. The cuttings in the remaining two treatment combina-In December 1998, all cuttings were moved to another
out-door growing area and randomly assigned, by set, to one of tions received natural daylight and were separated from those receiving extended day length by a permanent shade wall. two experiments. The growth initiation and growth cessation
experiments were performed in controlled environments in Irrigation was withheld on one-half of the cuttings in each day-length treatment. Moisture stress was monitored by predawn 1998–1999. Field test sites near Longview, Washington, and
Springfield, Oregon, were established (n ⬎ 400) in 2000, pressure chamber readings, using a portable Scholander pres-sure chamber (RitchieandHinckley1975). Cuttings were using cuttings from the growth initiation and growth cessation
experiment. An incomplete randomized block design was used watered to capacity when water potentials reached⫺1.0 MPa on 70% of the cuttings tested (from a sample of 20). Moisture with four blocks per site, and clones were planted in two-tree
clonal plots. Test sites were fairly uniform with little microenvi- stress was induced four times between June 21 and the end of August. Cuttings in the nonstressed moisture treatments ronmental variation. The Washington site is at 300 feet
eleva-tion and has a rocky loam soil; the Oregon site has a deep were irrigated thoroughly and regularly.
Cuttings were monitored twice weekly starting in April 1999 loam soil situated on a steep slope (ⵑ15⬚) at 650 feet elevation.
The Oregon site is 160 km south of the Washington site and to obtain phenotypic data for a number of growth-rhythm traits. The JD of terminal bud flush (tbfGC), the JD of observed
has a warmer, drier climate.
Treatments and phenotypic measurements:Three experi- terminal bud set (tbs), and the JD of lammas bud flush (lbf) were recorded (Table 1). The proportion of cuttings within ments were conducted in this study. The first two involved
controlled treatments, whereas the third experiment involved a clone with lammas bud flush (plf) was determined for each treatment. The duration of first flush (dff), defined as the field tests at two sites.
Growth initiation experiment: The growth initiation experi- elapsed time between bud flush and bud set, and the elapsed time between first and second bud flushes (ebf) were deter-ment was designed to identify QTL controlling growth
initia-tion that interact with winter chill and spring flushing tempera- mined, in days, by subtraction. Incremental height growth from spring bud flush (ht1) and incremental height growth tures. Growth commences in the meristematic tissue several
weeks prior to external evidence (FielderandOwens1989). from lammas flush (ht2) were recorded weekly for each cut-ting. Total incremental height growth (htt) was determined To avoid destructive methods of determining growth
initia-tion, the surrogate trait spring bud flush was used to measure by summing ht1 and ht2. From these data, the following variables were calculated: the duration of shoot extension growth initiation. Terminal bud flush (tbfGI) was defined as
the date upon which the first visible green needles emerged (dse), calculated as the number of days between the date of initial bud flush and the date of complete growth cessation; from the bud scales. Winter chill (WC) was defined as the
number of hours at or below 4⬚. Flushing temperature (FT) the JD upon which 90% of complete growth had occurred (dcg); and shoot extension intensity (sei), or the average was defined as the temperature of the greenhouses in which
the cuttings were grown. The experimental design was a 2⫻ increase in incremental height growth between initial bud flush anddcg(millimeters per day). Clonal means were calcu-3 factorial with two winter chill levels (750 and 1500 hr) and
three flushing temperature levels (10⬚, 15⬚, and 20⬚), which lated for all traits measured in the growth cessation experi-ment for all treatexperi-ment combinations (Table 2).
produced six treatment combinations (Figure 1A).
Cuttings were allowed to accumulate chilling hours in out- Field experiment:Terminal bud flush was scored in the spring of 2001 on cuttings planted at the field test sites in Longview, door ambient conditions through the fall and winter of 1998–
1999. Upon accumulation of 750 hr of winter chill (late De- Washington (tbfFL) and Springfield, Oregon (tbfFS; Figure
1A, Table 1). Bud flush was scored on a single JD upon which cember 1998), two complete sets of replicates were moved to
each of three greenhouses maintained at constant conditions it was determined, from monitoring, thatⵑ50% of the cuttings in the trial had flushed. Terminal buds were scored on the of 10⬚, 15⬚, and 20⬚. The remaining six sets were moved into
the same houses in late February, upon accumulation of 1500 basis of the stage of development as described inJermstad
et al.(2001a). Clonal means, across replications, were calcu-hr of winter chill. Cuttings were monitored twice weekly and
the Julian day ( JD) of terminal bud flush was recorded for lated at each site and used for QTL mapping (Table 2).
Genotyping, linkage map construction, and QTL analyses:
each cutting. The number of days between greenhouse entry
and bud flush was determined and used for analyses (tbfGI; Interval mapping and single-factor ANOVA were used to
esti-mate QTL for traits measured in the growth initiation, growth Table 1). Clonal means were calculated fortbfGIfor all
treat-ment-combinations (Table 2). cessation, and field experiments. Our first approach was to scan the genome for the presence of QTL using an interval Growth cessation experiment:The growth cessation experiment
was designed to evaluate the effects of moisture stress and day mapping method and subsequently to estimate QTL⫻E inter-actions at individual markers using single-factor ANOVA. The length on growth cessation. Growth cessation is a prolonged
physiological process, beginning with the initiation of bud QTL ⫻ E interactions are reported as QTL-by-treatment (QTL⫻ T) interactions for the controlled experiment and scales shortly following bud flush. These processes are not
easily monitored except by destructive dissection and there- QTL-by-site (QTL⫻S) interactions for the field experiment. Genotypic data and linkage map construction:Seventy-two evenly fore are best evaluated by measuring a series of seasonal
growth rhythm traits (MacdonaldandOwens1993). Treat- spaced and informative restriction fragment length polymor-phism markers used in construction of a sex-averaged genetic ments were tested in a 2 ⫻ 2 factorial, with two levels of
moisture stress [moisture stress (MS) and no moisture stress linkage map (cohort 1) were used to genotype 429 of the mapping population clones (cohort 2; Figure 1A). Segregation (NMS)] and two levels of day length [natural day length
(NDL) and extended day length (EDL)] producing four treat- data from both cohorts were combined and linkage analysis was performed using JoinMap version 1.4 (Stam and van
ment combinations (Figure 1A).
was suboptimal and thus the statistical model was not “full
TABLE 1
rank.” In such cases, the numerator degrees of freedom were
Traits measured in growth initiation, growth cessation, reduced and theP(F) was determined according toKnottet and field experiments al.(1997).
The proportion of phenotypic variance explained (PPVE) by each QTL was calculated as
Growth initiation experiment
tbfGI Terminal bud flush (days from greenhouse entry 2
p⫽[(reduced model SS/d.f.)
to flush)
⫺(full model SS/d.f.)]/[reduced model SS/d.f.]. Growth cessation experiment
tbfGC Terminal bud flush ( Julian date) LGs based solely on markers segregating in only one parent,
tbs Terminal bud set ( Julian date) as is the case in LGs 9, 10, and 15, failed to meet full rank
dff Duration of first flush (no. of days) criteria, andP(F) and PPVE were calculated on the basis of
ht1 Incremental height of first flush (mm) the reduced degrees of freedom for the full model.
lbf Lammas (second) flush ( Julian date) A QTL scan was performed for each treatment combination
plf Proportion of trees that had lammas flush (%) [e.g., six separate genome scans for the growth initiation
exper-ebf Elapsed time between first and second flush (days) iment (n ⫽ 429) and four separate genome scans for the
dcg Date of 90% complete growth ( Julian date) growth cessation experiment (n⫽ 406)] for each trait. For
ht2 Incremental height of second flush (mm) the field experiment, genome scans were performed using
htt Total incremental height (mm) the clonal mean of replicates within each test site. Although
dse Duration of shoot extension (days) ⬎440 clones were planted at the test sites, only 408 clones
sei Shoot extension intensity (mm/day) were genotyped and common to both sites (Figure 1A). Single-factor ANOVA for detection of QTL⫻E interactions:ANOVA Field experiment (PROC GLM, SAS 8.02; SAS Institute) was used to estimate
tbfFL Terminal bud flush at test site in Longview, QTL⫻Tor QTL⫻Sinteractions for all traits measured in
Washington the growth initiation, growth cessation, and field experiments.
tbfFS Terminal bud flush at test site in Springfield, Oregon The same 72 markers that were used for interval mapping
were also used in the ANOVAs. The experimental unit used in the ANOVA for traits measured in the controlled experi-ments was the individual cutting. For the field experiment, for grouping markers into linkage groups (LGs) and for order- clonal means for each site were used in the ANOVA. An approxi-ing markers, respectively. The map consists of 15 LGs, rather mate chromosome-wide experimental threshold ofP(F)ⱕ0.005 than 17 LGs as reported in earlier analyses (Jermstadet al. was used for reporting QTL⫻Einteractions, which is compa-1998, 2001a,b). (In Douglas fir, the haploid number of chro- rable to the chromosome-wide experimental threshold used mosomes is 13.) The order of markers remained consistent for interval mapping.
within LGs even though, in some cases, the additional data The model for estimation of QTL⫻Tinteractions in the slightly affected the estimated distances between markers. growth initiation experiment was
There was a negligible increase in map distance from 896.9
to 897.5 cM. Yijkm(l)⫽ ⫹Ri⫹Wj⫹Tk⫹Gl⫹Cm(l)⫹(WT)jk⫹(WG)jl
Genome scan for the presence of QTL:The all-marker multiple
⫹(TG)kl⫹(WTG)jkl⫹(WC)jm(l)⫹(TC)km/(l)
regression method ofKnottet al.(1997) was used to scan
the genome for the presence of QTL at 5-cM intervals follow- ⫹(WTC)
jkm(l)⫹ ⌼ijkm(l),
ing both a one- and two-QTL model (Knottet al.1997;
Jerm-stadet al.2001a,b). For each model, the mapping software where providedF-statistics for the most likely QTL per LG, as well
is the trait mean; as the sum of squares (SS); degrees of freedom; and the effects
Riis the replication effect,i⫽1, 2;
for the paternal, maternal, and paternal⫻maternal
interac-Wjis the winter chill effect,j⫽1, 2;
tion components. Critical thresholds of the F-distribution,
Tkis the flushing temperature effect,k⫽1, 2, 3;
P(F), for suggestive and significant QTL were established at
Glis the genotype effect,l⫽1 . . .n, wherenequals number
Pⱕ0.01 andPⱕ0.005, respectively. TheseP-value thresholds
of genotypic classes; were found to be comparable to chromosome-wide
experi-Cm(l)is the random clone within genotype effect,m(l)⫽1 . . .
mental thresholds obtained from permutation tests (MapQTL
x, wherexequals the number of observations per genotypic v. 4.0,van Ooijenet al.2002) conducted on several traits in
class; the current study and were the same as those used in previous
(WT)jkis the winter chill⫻flushing temperature interaction
QTL studies (Knottet al.1997;Sewellet al.2000;Jermstad
effect; et al.2001a,b). In some regions of the genome, and in some
cases whole LGs (discussed below), marker informativeness (WG)jlis the winter chill⫻genotype interaction effect;
Figure1.—(A) Three-generation pedigree of Douglas fir showing two mapping populations (cohorts), treatment combinations
for the growth initiation and growth cessation experiments, and sample sizes used in QTL analyses. Two levels of winter chill (WC) and three levels of flushing temperature (FT) produced six treatment combinations in the growth initiation experiment. Two levels of day length (NDL, natural daylength; EDL, extended daylength) and two levels of moisture stress (MS, moisture stress; NMS, no moisture stress) produce four treatment combinations in the growth cessation experiment. Two test sites were used in the field experiment. (B) Temporal relationships among traits that were evaluated during the seasonal growth cycle. The average Julian date ( JDAVG), calculated from clonal means, is shown fortbfGC,tbs,lbf, anddcg, and the JD that growth
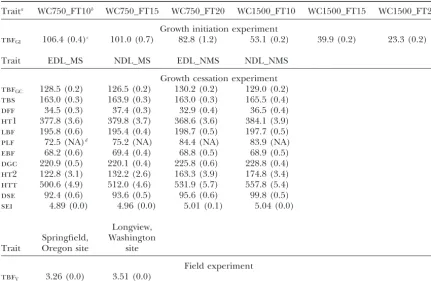
TABLE 2
Trait means and standard errors estimated in the growth initiation, growth cessation, and field experiments
Traita WC750_FT10b WC750_FT15 WC750_FT20 WC1500_FT10 WC1500_FT15 WC1500_FT20
Growth initiation experiment
tbfGI 106.4 (0.4)c 101.0 (0.7) 82.8 (1.2) 53.1 (0.2) 39.9 (0.2) 23.3 (0.2)
Trait EDL_MS NDL_MS EDL_NMS NDL_NMS
Growth cessation experiment
tbfGC 128.5 (0.2) 126.5 (0.2) 130.2 (0.2) 129.0 (0.2)
tbs 163.0 (0.3) 163.9 (0.3) 163.0 (0.3) 165.5 (0.4)
dff 34.5 (0.3) 37.4 (0.3) 32.9 (0.4) 36.5 (0.4)
ht1 377.8 (3.6) 379.8 (3.7) 368.6 (3.6) 384.1 (3.9)
lbf 195.8 (0.6) 195.4 (0.4) 198.7 (0.5) 197.7 (0.5)
plf 72.5 (NA)d 75.2 (NA) 84.4 (NA) 83.9 (NA) ebf 68.2 (0.6) 69.4 (0.4) 68.8 (0.5) 68.9 (0.5)
dgc 220.9 (0.5) 220.1 (0.4) 225.8 (0.6) 228.8 (0.4)
ht2 122.8 (3.1) 132.2 (2.6) 163.3 (3.9) 174.8 (3.4)
htt 500.6 (4.9) 512.0 (4.6) 531.9 (5.7) 557.8 (5.4)
dse 92.4 (0.6) 93.6 (0.5) 95.6 (0.6) 99.8 (0.5)
sei 4.89 (0.0) 4.96 (0.0) 5.01 (0.1) 5.04 (0.0)
Longview, Springfield, Washington Trait Oregon site site
Field experiment
tbfV 3.26 (0.0) 3.51 (0.0)
aSee Table 1 for trait descriptions.
bSee Figure 1 for treatment-combination nomenclature. cStandard errors are in parentheses.
dNA, not available.plfis the proportion of cuttings within clone with lammas flush and thus standard errors
could not be estimated.
(TG)kl is the flushing temperature ⫻ genotype interaction Cm(l)is the random clone within genotype effect,m(l)⫽1 . . .
effect; x, wherexequals the number of observations per genotypic (WTG)jklis the winter chill⫻flushing temperature⫻genotype class;
interaction effect; (DM)jkis the day length⫻moisture stress interaction effect;
(WC)jm(l)is the winter chill⫻clone within genotype effect; (DG)jlis the day length⫻genotype interaction effect;
(TC)km(l)is the flushing temperature⫻clone within genotype (MG)klis the moisture stress⫻genotype interaction effect;
effect; (DMG)jklis the day length⫻moisture stress⫻genotype
inter-(WTC)jkm(l)is the winter chill⫻flushing temperature⫻clone action effect;
within genotype effect; and (DC)jm(l)is the day length⫻clone within genotype effect; ⌼ijkm(l)is the sampling error. (MC)km(l)is the moisture stress⫻clone within genotype effect;
(DMC)jkm(l)is the day length⫻moisture stress⫻clone within
Genotype, winter chill, and flushing temperature were fixed
genotype effect; and effects, along with their two- and three-way interactions. Terms ⌼
ijkm(l)is the sampling error.
involving clone were considered random and the SAS Random
statement was used to obtain correctF-tests for the fixed ef- Genotype, day length, and moisture stress were fixed effects, fects. along with their two- and three-way interactions. Terms involv-The model for estimation of QTL⫻Tinteractions in the ing clone were considered random, and the SAS Random growth cessation experiment was statement was used to obtain correctF-tests for the fixed
ef-fects. Yijkm(l)⫽ ⫹Ri⫹Dj⫹Mk⫹Gl⫹Cm(l)⫹(DM)jk⫹(DG)jl
To test for QTL⫻Sinteractions affecting bud flush in the
⫹(MG)kl⫹(DMG)jkl⫹(DC)jm(l)⫹(MC)km(l) field experiment, ANOVA was performed using PROC MIXED
with the SAS Repeat statement to account for clonal
replica-⫹(DMC)jkm(l)⫹ ⌼ijkm(l),
tion at two test sites (tbfFLandtbfFS).
where The model for estimation of QTL⫻S interactions in the field experiment was
is the trait mean;
Riis the replication effect,i⫽1, 2; Y
ijk⫽ ⫹Gi⫹Sj⫹(G⫻Sij)⫹Ck⫹ ␥ijk,
Djis the day length effect,j⫽1, 2;
Mkis the moisture stress effect,k⫽1, 2, 3; where
Glis the genotype effect,l⫽1 . . .n, wherenequals number
Gi is the genotype effect,i ⫽ 1 . . .n, wheren equals the not presented here. Tabulated results from both the
one-number of genotypic classes; and two-QTL models, including F-values, F-distribution Sjis the site effect,j⫽1, 2;
probabilities, parental effects, parent-interaction effects, G⫻Sijis the genotype⫻site interaction effect;
and PPVE, are presented at http://dendrome.ucdavis. Ckis the clone effect,k⫽1 . . .n, wherenequals the number
of clones for the given markerm; and edu/NealeLab/publications.html. Critical thresholds of
␥ijkis the sampling error. theF-distribution probabilitiesP(F) for suggestive and
significant QTL were established atP ⱕ0.01 and Pⱕ Genotype, site, and genotype⫻ site interaction were fixed
effects, and the clone term was considered random. 0.005, respectively. The critical F-value threshold for suggestive QTL (P ⱕ 0.01) is shown by a dotted hori-zontal line and the criticalF-value threshold for signifi-RESULTS
cant QTL (Pⱕ0.005) is shown by a dashed horizontal line. The criticalF-value thresholds for suggestive and The effect of environment on phenotypic variance in
growth rhythm traits: The treatments applied in the significant QTL were higher for LGs 9, 10, and 15
be-cause the regression model was not full rank. The range growth initiation experiment had significant effects on
the timing of bud flush (Pⱕ0.0001). On average, cut- in PPVE for individual QTL in this study was 0.7–9.5%. QTL were largely additive in effect with the exception tings receiving 750 hr of winter chill took ⬎60 days
longer to flush than cuttings that received 1500 hr of of the incremental height growth traits.
A small number of QTL⫻Einteractions (0–5) were winter chill. As anticipated, increased flushing
tempera-tures accelerated bud flush, with cuttings brought into found per individual trait (Figures 2–15). Markers that mapped close to one another and detected interactions the warmest houses (20⬚) flushing nearly 40 days earlier
than those in the coolest houses (10⬚). Treatments ap- with the same treatment were inferred as a single QTL interaction. Also, only interactions found near QTL plied in the growth cessation experiment had significant
effects on the phenotype for many of the traits measured peaks identified by interval mapping were considered relevant. A tabulated summary of the ANOVA results (P ⱕ 0.01). The phenotypic responses to day length
and moisture stress in the growth cessation experiment for each marker is available at http://dendrome.ucdavis. edu/NealeLab/publications.html.
were typically less pronounced than those observed for winter chill and flushing temperature in the growth initiation experiment. However, large sample sizes (⬍800
DISCUSSION cuttings per treatment combination) made even very
small differences statistically significant. The effects of It is of basic scientific interest to understand the ge-netic control of the seasonal growth cycle in perennial day length on phenotype were unexpected in some
growth-rhythm traits. Day length treatments may have plants. Genetic control of seasonal growth rhythm is complex (quantitative), and thus we have used a QTL been confounded by unintentional temperature effects
caused by the shade wall that was used to separate the mapping approach to begin to dissect the quantitative inheritance of perennial growth. In this study, we have day length environments. Nonetheless, sufficient
varia-tion was found in the traits measured in the growth identified sets of QTL that control different phases of growth, beginning with bud flush in the spring and cessation experiment to enable QTL mapping. Although
trait data appeared to approximate normal distribu- ending with growth cessation in mid- to late summer. Furthermore, we have identified interactions between tions, 7 of 11 tests for nonnormality were significant
(Martinez-Iglewicz test, Number Cruncher Statistical several QTL and some of the environmental signals influencing perennial growth phases. To our knowl-Software, v. 2001). Past experience has shown that
trans-formation of such data has not substantially influenced edge, this is the first time QTL have been mapped in forest trees under experimental treatment of environ-QTL detection. Consequently, no adjustments to data
were made in these analyses. Analyses of the phenotypic mental signals that affect perennial growth.
Our main objective was to discover QTL for growth data, including phenotypic correlations and phenotypic
distributions, can be viewed at http://dendrome.ucdavis. initiation and growth cessation traits that interact with specific environmental signals,e.g., winter chill, flushing edu/NealeLab/publications.html.
QTL detection and QTL⫻Tinteractions:A modest temperature, day length, and moisture stress. The
ratio-nale for studying these QTL is twofold. First, QTL number of QTL (4–11) were detected per individual
trait analyzed in this study. QTL were found on 14 of governed by environmental signals are fundamentally important and will promote understanding of the physi-the 15 linkage groups; no QTL were detected on LG
13. QTL detected within 20 cM of each other were ological and biochemical processes that govern patterns of seasonal growth. The knowledge derived from these counted as a single QTL for a given trait. Genome scan
profiles from the one-QTL model interval mapping comprehensive QTL mapping experiments will be in-valuable in our future efforts to identify candidate genes analyses and QTL⫻Einteractions for the growth
initia-tion, growth cessainitia-tion, and field experiments are shown controlling the annual growth cycle in conifers. Second, knowledge of QTL controlling these growth-rhythm in Figures 2–15. For the sake of simplicity and also due
Figure
2.—Terminal
bud
flush
(
tbf
GI
)
w
as
used
as
a
surrogate
trait
to
measure
growth
initiation
in
the
spring.
The
overwintering
bud
is
released
from
dormancy
and
growth
is
initiated.
S
even
QTL
for
terminal
bud
flush
were
detected
in
the
growth
initiation
experiment
(
tbf
GI
).
QTL
were
found
on
six
LGs
(2,
3
,
4
,
5
,
1
2,
and
1
4)
and
were
detected
in
five
of
the
six
treatment
combinations.
Only
two
QTL
⫻
T
interactions
were
found,
one
for
w
inter
chill
on
LG
2
a
nd
one
for
flushing
temperature
on
LG
5.
The
interaction
detected
on
LG
5
is
located
at
a
m
arker
that
is
intermediate
between
two
QTL
detected
by
interval
m
apping.
Figure
3.—Terminal
bud
flush
(
tbf
GC
)
w
as
also
measured
in
the
growth
cessation
e
xperiment
(
tbf
GC
).
Cuttings
were
measured
2
months
prior
to
the
application
o
f
treatments
(Figure
1B);
thus
treatment
interactions
were
not
estimated.
E
leven
QTL
were
detected
on
seven
LGs
(2,
5,
6,
8,
10,
11,
a
nd
12).
The
differen
ces
of
QTL
scans
among
treatment
combinations
are
due
to
block
effect
and
most
notable
on
LGs
5,
6,
8,
and
1
Figure
6.—Incremental
height
growth
from
the
first
flush
(
ht
1)
is
essentially
growth
determined
by
the
p
reformed
bud,
which
is
formed
in
the
p
revious
year.
Genes
contributing
to
g
rowth,
through
cell
expansion
a
nd
or
subapical
cell
division,
may
possibly
be
influenced
by
environmental
signals.
Four
QTL
for
ht
1
w
ere
detected
on
four
LGs
(1,
9
,
1
2,
and
1
4).
QTL
⫻
T
interactions
were
detected
on
two
LGs
(5
and
9);
however,
only
one
(LG
9
)
w
as
at
a
position
where
a
QTL
was
detected
by
interval
mapping.
This
QTL
showed
a
three-way
interaction
(genotype
⫻
daylength
⫻
moisture
stress).
Similarities
in
QTL
scans
w
ere
found
among
ht
1,
tbs
(Figure
4),
a
nd
dff
(Figure
5).
Figure
7.—Lammas
bud
flush
(
lbf
)
signals
the
initiation
and
expansion
o
f
n
eo-formed
cells
that
have
not
undergone
a
hardening
phase.
E
ight
QTL
were
detected
for
lammas
bud
flush
on
LGs
1,
2,
3,
5,
7,
8,
9,
and
1
1.
A
QTL
⫻
T
interaction
w
as
detected
on
LG
11
proximal
to
a
suggestive
QTL
detected
by
interval
be useful for marker-aided breeding. Moreover, the re- the genome scan profiles were notably dissimilar and support the hypothesis that these traits are controlled peated detection of QTL controlling growth-rhythm
traits in multiple environments lays a foundation for by unique suites of genes (Rehfeldt1983;Campbell
1986), especially in young trees (Li andAdams 1993; tree breeders to develop a better understanding of
quan-titative trait architecture and the underlying molecular AdamsandBastien1994).
Comparisons of genome scan profiles among the basis of genotype-by-environment interactions.
Number of QTL controlling growth initiation and traits can help identify QTL affecting more than one
trait. Such QTL were mostly found within three groups
growth cessation in Douglas fir:Initially, the genome
was scanned for the presence of QTL controlling growth of traits: (1) predetermined growth from an overwinter-ing preformed bud (tbfGC,tbs,dff, andht1), (2) free initiation and growth cessation using an interval
map-ping method. A total of 90 QTL were detected at the growth from a neoformed or lammas bud (lbf, plf, dcg,andht2), or (3) traits that represent a capitulation suggestive level among all traits, 55 of which were
de-tected at the significant level (Figures 2–15). However, of both (ebf, htt, dse, andsei; Figure 1B). For exam-ple, the genome scan profiles amongtbs, dff,andht1 because some QTL were repeatedly detected in
corre-lated traits, the number of unique QTL is⬍90. (Figures 4, 5 and 6, respectively) were similar and the genome scan profiles forlbf, plfandht2 (Figures 7, The estimation of the number of QTL and the PPVE
by each QTL is heavily dependent upon the number of 8 and 11, respectively) were similar. Likewise, QTL for growth traits that capitulated the growth cycle (htt,
progeny evaluated (Beavis1995). The PPVE among all
traits and all treatments ranged from 0.7 to 9.5%. Early dse, and sei), showed strong relationships to one an-other, and most likely represent similar functionality studies reported small numbers of QTL controlling
traits, often with overestimated PPVE (Kearsey and (subapical cell expansion or elongation). The QTL for incremental height growth from an overwintering bud
Farquhar1998). In most cases, these results have been
shown to be due to small sample size (Beavis 1995; (ht1) were notably dissimilar from the QTL for incre-mental height growth from a lammas bud (ht2),
sug-Wilcoxet al.1997;Frewenet al.2000) and to the lack
of statistical power to detect all the QTL present on a gesting different genetic control for these two forms of growth. Kayaet al. (1989) found low genetic correla-chromosome (Hyneet al.1995;KearseyandFarquhar
1998). Sample sizes ⬎300 are recommended to accu- tions between predetermined growth and free growth in open-pollinated Douglas fir seedlings grown in two rately estimate the number and effects of QTL
control-ling a trait (Hyneet al.1995). In this study, we increased environments. The same study also showed that the amount and duration of predetermined growth was the sample size from our previous QTL study by nearly
twofold (n⬎400; Figure 1A), while retaining the preci- highly correlated to the size of the preformed bud, which in turn was highly correlated to the timing of sion of phenotypic evaluation provided by clonal
repli-cation of the mapping population. Nonetheless, the bud set in the previous year. The pattern of QTL re-ported here strongly suggests separate genetic control number of QTL for bud flush detected in this
experi-ment and the estimated size of effects did not show for growth from the two bud types.
Resolving whether QTL that are detected in multiple substantial differences from those found in the previous
study (cohort 1;Jermstadet al. 2001a). In both studies, a traits represent pleiotropy or tightly linked QTL is diffi-cult in large genomes such as conifers, where hundreds modest number of QTL (5–10) of modest effect (5–10%
PPVE) were found to be controlling adaptive traits in of genes may be encoded per centimorgan. Further-more, repeated detection of QTL could be the result Douglas fir.
The amount of phenotypic variation explained by of autocorrelation between traits. For example, ebf is highly correlated withlbf(phenotypicrAVG⫽0.86); the
an individual QTL was generally small, but sometimes
fluctuated depending upon the treatment. For example, measurement of both traits relies on the date of lammas flush, so it is not surprising that the genome scans for a QTL forebfwas detected on LG 3 at 25 cM in all four
treatment combinations and the PPVE varied almost these two traits are similar.
QTL for growth initiation interacting with winter chill threefold among treatments,e.g., 7.5% (EDL_MS), 5.1%
(NDL_MS), 3.5% (EDL_NMS), and 2.7% (NDL_NMS). and flushing temperature: The timing of spring bud flush in Douglas fir varies depending on geographic In this example, where large and balanced samples were
used, differences in the PPVE for the same QTL illus- origin. Elevation and latitude, which largely determine winter and spring temperatures, have been shown to trate that sample size is not the only important criterion
for accurate estimation of QTL effects, but that environ- play a critical role in adaptation to the timing of dor-mancy release and the initiation of shoot growth (
Camp-ment also plays an important role.
Seasonal growth in this study is marked by four pheno- bell and Sorensen 1978; Campbell 1986). Because QTL⫻E interactions were identified for bud flush in logical events: spring bud flush, bud set, lammas bud
flush, and growth cessation (tbfCG,tbs,lbf, anddcg; a previous Douglas fir study (Jermstad et al. 2001a), we expected to find QTL interacting with key environ-Figures 3, 4, 7, and 10). Although a small number of
tempera-ture) that influence this trait. We detected one QTL⫻ for each of the two sites were compared and QTL⫻S interactions were estimated. Five of the six QTL were T interaction with winter chill (P ⱕ 0.005) and one
QTL ⫻ Tinteraction with flushing temperature (P ⱕ detected at both sites (LGs 2, 6, 8, and 12; Figure 15), one of which (LG 2) showed an interaction with site. 0.005). The QTL interacting with winter chill on LG 2
is at the same map location as a QTL interacting with Furthermore, genome scan profiles for both sites were remarkably similar, regardless of whether the critical site at the Longview and Springfield test sites (Figure
15). It is plausible that the interaction with site detected F-value threshold was met. This finding is encouraging, given that so few QTL were found in common between in the field experiment is actually a QTL interaction
with winter chill. previously replicated field tests. It appears that the large
number of progeny used in the current field study con-QTL for growth cessation interacting with day length
and moisture stress: In the same manner that winter tributed to the repeatability of detection. Although the
test sites differed in elevation, latitude, and climate, and spring temperatures vary at different elevations and
latitudes and affect the timing of growth initiation, pho- nearly all of the QTL detected in this experiment were detected at each site. This finding supports the assertion toperiod and moisture stress also vary and play a critical
role in determining when a tree ceases annual growth that bud flush is a highly heritable trait (Rehfeldt1983;
LiandAdams1993;AitkenandAdams1997). and prepares for winter dormancy. QTL interacting with
light quality and moisture stress have been successfully It is important to evaluate the reliability of QTL detec-tion, but this is rarely done in forest trees due to a mapped in other plant species. QTL for growth interact
with moisture stress in barley (Teulatet al. 2001) and variety of constraints. Replication of QTL experiments is rarely performed and comparisons of QTL detected inArabidopsis thaliana, QTL for germination, hypocotyl
length, rosette leaf number, and date of flowering inter- in different mapping populations are confounded by either genetic background or environment (Brownet act with light quality (van der Schaar et al. 1997;
Stratton 1998;Borevitz et al. 2002). In this experi- al. 2003). In this study, the same clonal mapping popula-tion was tested for the timing of bud flush at each of ment, we tested whether QTL controlling growth
cessa-tion and growth-rhythm traits interact with day length two field sites. In addition, the QTL detected in the field sites were compared to QTL for bud flush detected or moisture stress. A small number of QTL that interact
exclusively with each environmental signal were de- in the growth initiation and growth cessation experi-ments (Figures 2, 3, and 15). In spite of the environmen-tected. The only traits for which QTL⫻Tinteractions
were not detected weretbs,plf, andht2. In addition, tal variation introduced in this study, repeated detection of QTL was observed on LGs 2, 5, 6, 8, and 12, affirming we found QTL for several traits (ht1, ebf, dcg, and
dse) that interacted with both environmental signals. the reliability of detection methods used and the spatial stability of QTL governing bud flush. QTL on LGs 2 Twice as many QTL⫻ Tinteractions with day length
(seven) as those with moisture stress (three) were de- and 12 were detected in the growth initiation, growth cessation, and field experiments. By comparative map-tected among all traits evaluated in the growth cessation
experiment. Because of the possible confounding effect ping, QTL for bud flush reported in this article were compared with those detected in the earlier study of temperature associated with the day length
treat-ments, some of the QTL ⫻ T interactions with day (Jermstadet al. 2001a); the QTL on LG 2 was detected in all genetic tests evaluated.
length may actually be due to an interaction with tem-perature. In some populations of Douglas fir, tempera-ture interacts with day length to optimize growth
pro-CONCLUSION cesses (Campbell and Sorensen 1978; MacDonald
andOwens1993). A future experiment might include QTL interacting with the environment are of great interest to plant physiologists and geneticists wishing to temperature as an additional treatment.
QTL-by-site interactions for bud flush at the field test understand the effects of specific environmental signals
and the genetic and biochemical responses they induce.
sites:Replicated tests have been used in a small number
of angiosperm species for identifying QTL-by-environ- Phenology of flowering time (Sheldonet al.2000), ver-nalization requirement (Johanson et al. 2000; Oka et ment interactions (Stuber et al.1992; Wuet al. 1998;
Sourdilleet al. 2000;Saranga et al. 2001; Teulat et al. 2001), dormancy release (Lopez-Molinaet al.2001), cell cycling (den Boer and Murray 2000), and the al. 2001). We previously evaluated QTL for bud flush
in replicated test environments (Jermstadet al. 2001a) response to environmental signaling, including plant hormones (Fankhauser2002;Garcı´a-Martinezand and found only a small fraction of QTL repeatedly
de-tected at both sites. This result was possibly due to the Gil 2002), have been studied in depth in angiosperm species. Genotype-by-environment interactions for growth small number of clones (n⫽78) established at one of
the test sites (Figure 1A). In the current experiment, and phenology traits in Douglas fir were known to exist on the basis of findings from previous genetic research, we used the same three-generation pedigree as in the
Fankhauser, C., 2002 Light perception in plants: cytokinins and interact with environmental signals governing the growth
red light join forces to keep phytochrome B active. Trends Plant cycle in Douglas fir. We have also discovered that the Sci.7:143–145.
Fielder, P., andJ. N. Owens, 1989 A comparative study of shoot genes governing predetermined growth are unique from
and root development of interior and coastal Douglas-fir seed-those governing free growth, or lammas growth, which
lings. Can. J. For. Res.19:539–549.
frequently occurs in young trees. Several QTL for termi- Frewen, B. E., T. H. H. Chen, G. T. Howe, J. Rohde, A. Daviset
al., 2000 Quantitative trait loci and candidate gene mapping nal bud flush have been identified in multiple genetic
of bud set and bud flush inPopulus.Genetics154:837–845. tests, indicating that a subset of QTL controlling this
Garcı´a-Martinez, J. L., and J.Gil, 2002 Light regulation of gibber-trait are spatially stable and can be detected in diverse ellin biosynthesis and mode of action. J. Plant Growth Regul.20:
354–368. environments. The knowledge gained from this study
Georgiady, M. S., R. W. WhitkusandE. M. Lord, 2002 Genetic will prove invaluable in current efforts to identify growth
analysis of traits distinguishing outcrossing and self-pollinating cycle candidate genes for use in association studies and forms of currant tomato,Lycopersicon pimpinellifolium( Jusl.) Mill.
Genetics161:333–344. detection of allelic variation contributing to patterns of
Groover, A., M. Devey, T. Fiddler, J. Lee, R. Megrawet al., 1994 phenology and growth.
Identification of quantitative trait loci influencing wood specific gravity in an outbred pedigree of loblolly pine. Genetics 138:
We thank Celine Casias and Eilene Colen for biotechnical
assis-1293–1300. tance, Patty Ward and Sue Masters for propagation and cultivation
Ha¨nninen, H., 1995 Effects of climatic change on trees from cool of clonal material, Steve Duke and Sylvia Mori for statistical assistance,
and temperate regions: an ecophysiological approach to model-and Claudia Graham for graphic designs. We are grateful to Zeki
ing of bud burst phenology. Can. J. Bot.73:183–199. Kaya and Glenn Howe for editorial comments. This research was
Hurme, P., M. J. Sillanpa¨a¨, E. Arjas, T. RepoandO. Savolainen, supported by the United States Department of Agriculture Coopera- 2000 Genetic basis of climatic adaptation in Scots pine by Bayes-tive State Research, Education, and Extension Service—National Re- ian quantitative trait locus analysis. Genetics156:1309–1322. search Initiative Competitive Grants Program, no. 97-35300-4623. Hyne, V., M. J. Kearsey, D. J. PikeandJ. W. Snape, 1995 QTL
analysis: unreliability and bias in estimation procedures. Mol. Breed.1:273–282.
Jansen, R. C., J. W. van Ooijen, P. Stam, C. ListerandC. Dean, 1995 Genotype-by-environment interaction in genetic mapping LITERATURE CITED
of multiple quantitative trait loci. Theor. Appl. Genet.91:33–37. Adams, W. T., andJ.-C. Bastien, 1994 Genetics of second flushing Jermstad, K. D., D. L. Bassoni, N. C. WheelerandD. B. Neale, in a French Plantation of coastal Douglas-fir. Silvae Genet.43: 1998 A sex-averaged genetic linkage map in coastal Douglas-fir 345–352. (Pseudotsuga menziesii [Mirb.] Franco var ‘menziesii’) based on Aitken, S. N., andW. T. Adams, 1997 Spring cold hardiness under RFLP and RAPD markers. Theor. Appl. Genet.97:762–770.
strong genetic control in Oregon populations of coastal Douglas- Jermstad, K. D., D. L. Bassoni, K. S. Jech, N. C. WheelerandD. B. fir. Can J. For. Res.27:1773–1778. Neale, 2001a Mapping of quantitative trait loci controlling Beavis, W. D., 1995 The power and deceit of QTL experiments: adaptive traits in coastal Douglas-fir: I. Timing of vegetative bud
lessons from comparative QTL studies, pp. 304–312 inProceedings flush. Theor. Appl. Genet.102:1142–1151.
of the 49th Annual Corn and Sorghum Industry Research Conference, Jermstad, K. D., D. L. Bassoni, N. C. Wheeler, T. S. Anekonda, edited byD. Wilkinson. American Seed Trade Association, Wash- S. N. Aitken et al., 2001b Mapping of quantitative trait loci ington, DC. controlling adaptive traits in coastal Douglas-fir. II. Spring and Bigras, F. J., and L. D.D’aoust, 1993 Influence of photoperiod fall cold-hardiness. Theor. Appl. Genet.102:1152–1158.
on shoot and root frost tolerance and bud phenology of white Johanson, U., J. West, C. Lister, S. Michaels, R. Amasinoet al., spruce seedlings (Picea glauca). Can. J. For. Res.23:219–228. 2000 Molecular analysis ofFRIGIDA, a major determinant of Borevitz, J. O., J. N. Maloof, J. Lutes, T. Dabi, J. L. Redfernet natural variation inArabidopsisflowering time. Science290:344–
al., 2002 Quantitative trait loci controlling light and hormone 347.
response in two accessions ofArabadopsis thaliana.Genetics160: Kaya, Z., 1992 The effects of test environments on estimation of 683–696. genetic parameters for seedling traits in 2-year-old Douglas-fir. Bradshaw, H. D., andR. F. Stettler, 1995 Molecular genetics of Scan. J. For. Res.7:287–296.
growth and development in Populus. IV. Mapping QTLs with Kaya, Z., R. K. CampbellandW. T. Adams, 1989 Correlated re-large effects on growth, form and phenology traits in a forest sponses of height increment and components of increment in tree. Genetics139:963–973. 2-year-old Douglas-fir. Can. J. For. Res.19:1124–1130. Brown, G. R., D. L. Bassoni, G. P. Gill, J. R. Fontana, N. C. Wheeler Kaya, Z., W. T. Adamsand R. K.Campbell, 1994 Adaptive
signifi-et al., 2003 Identification of quantitative trait loci influencing cance of intermittent shoot growth in Douglas-fir seedlings. Tree wood property traits in loblolly pine (Pinus taedaL.). III. QTL Physiol.14:1277–1289.
verification and candidate gene mapping. Genetics164:1537– Kearsey, M. J., andA. J. L. Farquhar, 1998 QTL analysis in plants; 1546. where are we now? Heredity80:137–142.
Campbell, R. K., 1986 Mapped genetic variation of Douglas-fir to Knott, S., D. B. Neale, M. M. SewellandC. S. Haley, 1997 Multi-guide seed transfer in southwest Oregon. Silvae Genet.35:85–96. ple marker mapping quantitative trait loci in an outbred pedigree Campbell, R. K., andF. C. Sorensen, 1978 Effect of test environ- of loblolly pine. Theor. Appl. Genet.94:810–820.
ment on expression of clines and on delimitation of seed zones Lander, E. S., andD. Botstein, 1989 Mapping Mendelian factors in Douglas-fir. Theor. Appl. Genet.51:233–246. underlying quantitative traits using RFLP linkage maps. Genetics Campbell, R. K., andA. I. Sugano, 1975 Phenology of bud burst 121:185–199.
in Douglas-fir related to provenance, photoperiod, chilling and Lavender, D. P., K. K. ChingandR. K. Hermann, 1968 Effect of flushing temperature. Bot. Gaz.136:290–298. environment on development of dormancy and growth in Doug-den Boer, B. G. W., andJ. A. H. Murray, 2000 Triggering the cell las-fir seedlings. Bot. Gaz.129:70–83.
cycle in plants. Trends Cell Biol.10:245–250. Li, P., andW. T. Adams, 1993 Genetic control of bud phenology Eriksson, G., I. Ekberg, I. DormlingandB. Matern, 1978 Inheri- in pole-size trees and seedlings of coastal Douglas-fir. Can. J. For.
tance of bud-set and bud-flushing inPicea abies(L) Karst. Theor. Res.23:1043–1051.
Appl. Genet.52:3–19. Lippman, Z., andS. D. Tanksley, 2001 Dissecting the genetic path-Edwards, M. D., C. W. StuberandJ. F. Wendel, 1987 Molecular- way to extreme fruit size in tomato using a cross between the marker-facilitated investigations of quantitative-trait loci in maize. small-fruited wild speciesLycopersicon piminellifoliumandL.
esculen-I. Numbers, genomic distribution and types of gene action. Genet- tumvar. Giant Heirloom. Genetics158:413–422.
tion developmental arrest checkpoint is mediated by abscisic acid erty traits in loblolly pine (Pinus taedaL.). II. Chemical wood properties. Theor. Appl. Genet.104:214–222.
and requires the AB15 transcription factor inArabidopsis.Proc.
Sheldon, C. C., D. T. Rouse, E. J. Finnegan, W. J. PeacockandE. S. Natl. Acad. Sci. USA98:4782–4787.
Dennis, 2000 The molecular basis of vernalization: the central Macdonald, J. E., and J. N. Owens, 1993 Bud development in
role ofFLOWERING LOCUS C (FLC).Proc. Natl. Acad. Sci. USA coastal Douglas-fir seedlings under controlled-environment
con-97:3753–3758. ditions. Can. J. For. Res.23:1203–1212.
Sorensen, F. C., 1983 Geographic variation in seedling Douglas-fir Oka, M., Y. Tasaka, M. Iwabuchi andM. Mino, 2001 Elevated
(Pseudotsuga menziesii) from the western Siskiyou Mountains of sensitivity to gibberellin by vernalization in the vegetative rosette
Oregon. Ecology64:696–702. plants ofEustoma grandiflorumandArabidopsis thaliana.Plant Sci.
Sourdille, P., J. W. Snape, T. Cadalen, G. Charmet, N. Nakataet
160:1237–1245.
al., 2000 Detection of QTLs for heading time and photoperiod O’neill, G. A., S. N.Aitkenand W. T.Adams, 2001 Genetic
selec-response in wheat using a doubled-haploid population. Genome tion for cold hardiness in coastal Douglas-fir seedlings and
sap-43:487–494. lings. Can. J. For. Res.30:1799–1807.
Stam, P. J., and J. W.van Ooijen, 1995 JoinMap Version 2.0: Software
Partanen, J., andE. Beuker, 1999 Effects of photoperiod and
ther-for the Calculation of Genetic Linkage Maps. CPRO-DLO, Wagen-mal time on the growth rhythm ofPinus sylvestrisseedlings. Scand.
ingen, The Netherlands. J. For. Res.14:487–497.
Steiner, K. C., 1979 Variation in bud-burst timing among popula-Paterson, A. H., S. Damon, J. D. Hewitt, D. Zamir, H. D. Raino- tions of interior Douglas-fir. Silvae Genet.28:76–79.
witch et al., 1991 Mendelian factors underlying quantitative Strattton, D. A., 1998 Reaction norm functions and QTL-environ-traits in tomato: comparison across species, generations and envi- ment interactions for flowering time inArabidopsis thaliana. He-ronments. Genetics127:181–197. redity81:144–155.
Perry, T. O., 1971 Dormancy of trees in winter. Science171:29–36. Stuber, C. W., S. E. Lincoln, D. W. Woff, T. HelentjarisandE. S. Rehfeldt, G. E., 1983 Genetic variability within Douglas-fir popula- Lander, 1992 Identification of genetic factors contributing to tions: implications for tree improvement. Silvae Genet.32:9–14. heterosis in a hybrid from two elite maize inbred lines using Repo, T., G. Zhang, A. Ryyppo, R. TikalaandM. Vuorinen, 2000 molecular markers. Genetics132:823–839.
The relation between growth cessation and frost hardening in Teulat, B., O. Merah, I. Souyris andD. This, 2001 QTLs for Scots pines of different origins. Trees14:456–464. agronomic traits from a Mediterranean barley progeny grown in Rauh, B. L., C. BastenandE. S. Buckler, IV, 2002 Quantitative several environments. Theor. Appl. Genet.103:774–787.
trait loci analysis of growth response to varying nitrogen sources van der Schaar, W., C. Alonso-Blanco, K. M. L. E´ on-Kloosterziel, R. C. Jansen, J. W. van Ooijenet al., 1997 QTL analysis of inArabidopsis thaliana.Theor. Appl. Genet.104:743–750.
seed dormancy inArabidopsisusing recombinant inbred lines and Ritchie, G. A., 1984 Effect of freezer storage on bud dormancy
MQM mapping. Heredity79:190–200. release in Douglas-fir seedlings. Can. J. For. Res.14:186–190.
van Ooijen, J. W., M. P. Boer, R. C. JansenandC. Maliepaard, Ritchie, G. A., 1993 Production of Douglas-fir rooted cuttings for
2002 MapQTL 4.0, Software for the Calculation of QTL Positions on
reforestation by Weyerhaeuser Company. Int. Plant Propag. Soc.
Genetic Maps. Plant Research International, Wageningen, The Proc.43:68–72.
Netherlands. Ritchie, G. A., andT. M. Hinckley, 1975 The pressure chamber as
Vegis, A., 1964 Dormancy in higher plants. Annu. Rev. Plant Physiol. an instrument for ecological research. Adv. Ecol. Res.9:165–254.
15:185–224. Saranga, Y., M. Menz, C.-X. Jiang, R. J. Wright, D. Yakiret al.,
Wilcox, P. L., T. E. RichardsonandS. D. Carson, 1997 Nature 2001 Genomic dissection of genotype⫻environment
interac-of quantitative trait variation inPinus radiata: insights for QTL tions conferring adaptation of cotton to arid conditions. Genome
detection experiments, pp. 304–312 inProceedings of IUFRO ’97:
Res.11:1988–1995. Genetics of Radiata Pine, edited by R. D.Burdonand J. M.Moore. Sewell, M. M., D. L. Bassoni, R. A. Megraw, N. C. Wheelerand FRI Bulletin, Rotorua, New Zealand.
D. B. Neale, 2000 Identification of QTLs influencing wood Wu, R., H. D. BradshawandR. F. Stettler, 1998 Developmental property traits in loblolly pine (Pinus taedaL.). I. Physical wood quantitative genetics of growth inPopulus.Theor. Appl. Genet. properties. Theor. Appl. Genet.101:1273–1281. 97:1110–1119.
Sewell, M. M., M. F. Davis, G. A. Tuskan, N. C. Wheeler, C. C.