ISSN(Online): 2319-8753 ISSN (Print): 2347-6710
I
nternational
J
ournal of
I
nnovative
R
esearch in
S
cience,
E
ngineering and
T
echnology
(An ISO 3297: 2007 Certified Organization)
Website: www.ijirset.com
Vol. 6, Issue 5, May 2017
Study of Road Traffic & Management: A Case
Study at Katraj and Nalstop Intersections In
Pune City
Gayatri S Choudekar 1, Rohit R Salgude 2
P.G. Student, Department of Civil Engineering, Maharashtra Institute of Technology, Pune, Maharashtra, India1 Assistant Professor, Department of Civil Engineering, Maharashtra Institute of Technology, Pune, Maharashtra, India2
ABSTRACT: The increasing number of vehicles in the city, leading to traffic congestions is the major hurdle in the development of the city. Thus there is a need for proper road traffic demand management for the city. The objectives of the paper are tostudy the various problems faced by the city for two locations(viz. Katraj Intersection and Nalstop Intersection), and also presents solution for the traffic demand management at the intersections. The study is based on the road resources and characteristic of the urban traffic found from the video recordings done at the junction for 8 days during the peak and non-peak hours. Based on the Vehicular Volume Dataand Turning Movement Survey observed at these intersections, the paper discusses the solution to the increasing congestion and its effect on the traffic.
KEYWORDS: Non-Peak Hours,Peak Hours,Road Traffic Demand Management, Traffic Congestion, Turning Movement Survey, Vehicular Volume Data
I. INTRODUCTION
The city of Pune is the second largest district in the state of Maharashtra and covers 5.10% of the total geographical area of the state. The roads and rail networks connect the district with the state capital and surrounding district headquarters. The road network of the city comprises of Express Highways, National Highways, State Highways, Major District Roads and village roads.The total length of roads in the district is 13,642 km of roads(2001) of which 39.54% roads have Bituminous surface, 26.05% roads are of water bound macadam surface and 34.41% roads are other surface roads i.e. unmetalled road.Of the total road length in the district, National Highways covers 331km road length; State Highways cover 1368 km road length. Almost all the villages are well connected by water boundmacadam road. Transport policies such as road widening, construction of flyovers, etc. have already beenimplemented in the city. But the traffic congestions still exist as the policies do not meet the increasing traffic demand. The traditional solution of “building more roads and constructing more road infrastructure to accommodate the increasing number of vehicles” will not be able to meet the traffic demand management of the city. In order to improve the traffic demand management and traffic planning of the city, it is necessary to guide the increasing traffic demand along with the road widening and road infrastructure development. This can lead to a better, comfortable, reliable, economic as well as environment-friendly solution to the existing problem.
ISSN(Online): 2319-8753 ISSN (Print): 2347-6710
I
nternational
J
ournal of
I
nnovative
R
esearch in
S
cience,
E
ngineering and
T
echnology
(An ISO 3297: 2007 Certified Organization)
Website: www.ijirset.com
Vol. 6, Issue 5, May 2017
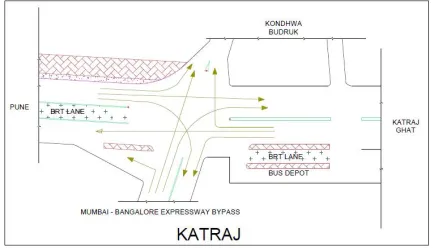
coming from Mhatre Bridge at the Nalstop intersection. The traffic flows at the two intersections is as shown in the Fig. 1 (a) & (b).
Fig. 1 (a) Katraj Intersection Fig. 1 (b) Nalstop Intersection
II. RELATED WORK
The literature survey brought many technologies to the notice for implementing efficient traffic planning and management. Increasing traffic at a higher pace is proving to be a big problem in the city of Pune. The developing infrastructure for tackling the traffic problem has not eased the problem. Thus, there is a need for effective traffic planning and management system for Pune city [6,9,10].There are various methods to tackle traffic such as Traffic management by work flow technique, Intelligent Transport System (ITS) for Indian Cities, Intelligent BRT, ecoMove Approach, Road traffic congestion in Developing World, BRT, Multi-agent system, and Quantitative problem approach [12]. Linear regression analysis can be used to find the passenger car equivalent values for the intersection. Video recording can be used to determine the exact number of vehicles passing at an intersection manually [2].
III. METHODOLOGY
To understand the flow of traffic and traffic characteristics at the two intersections, various surveys were carried out manually as well as by conducting video recordings for 6 hours (peak hours during morning and evening; and non peak hour during afternoon) over a period of 8 days. The vehicle volume survey and the turning movement survey were then carried out at the two intersections. The data was then analysed manually using computer and video viewing application. The survey was conducted for peak times during the morning and evening. The non peak hour during the afternoon was also surveyed and the recordings of the same were also obtained.
ISSN(Online): 2319-8753 ISSN (Print): 2347-6710
I
nternational
J
ournal of
I
nnovative
R
esearch in
S
cience,
E
ngineering and
T
echnology
(An ISO 3297: 2007 Certified Organization)
Website: www.ijirset.com
Vol. 6, Issue 5, May 2017
IV. ANALYSIS AND OBSERVATIONS
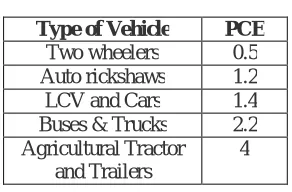
Following values for Passenger Car Equivalent1 were adopted for the analysis according to IRC 106-1990:
Table1: Passenger Car Equivalent
Type of Vehicle PCE
Two wheelers 0.5
Auto rickshaws 1.2
LCV and Cars 1.4
Buses & Trucks 2.2
Agricultural Tractor and Trailers
4
From the survey done at Katraj intersection, following observations were noted about vehicle flow characteristics: (a) For the traffic coming from Mumbai Bangalore Expressway Bypass, 75.9% traffic moves toward Kondhwa
Budruk and 24.1% traffic moves towards Katraj.
(b) For the traffic coming from Katraj, 19.3% traffic moves towards Mumbai Bangalore Expressway Bypass; 75.5% traffic moves towards Pune and remaining 5.2% traffic moves towards Kondhwa Budruk.
(c) For the traffic coming from Pune, 23.7% traffic moves towards Kondhwa Budruk; 45.6% traffic moves towards Katraj; and remaining 30.7% traffic moves toward Mumbai Bangalore Expressway Bypass.
From the survey done at Nalstop intersection, following observations were noted about the vehicle flow characteristics:
(a) For the traffic coming from Kothrud, 58.5% traffic moves towards Deccan; and 41.5% traffic moves towards
Mhatre Bridge.
(b) For the traffic coming from Mhatre Bridge, 81.1% traffic moves towards Deccan; and 18.9% traffic moves towards Kothrud.
(c) For the traffic coming from Deccan, 84.5% traffic moves towards Kothrud; and 15.5% traffic moves towards
Mhatre Bridge.
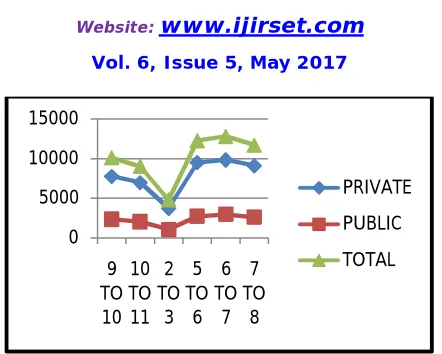
The variation of the traffic divided in two categories(viz. Public and Private vehicles) in peak and non peak hours in terms of PCU is found and represented in the figure 2 and figure 3 below:
Figure 2: Hourly variation of traffic at Katraj Intersection
0 2000 4000 6000 8000 10000 12000
9 TO 10
10 TO 11
2 TO
3 5 TO
6 6 TO
7 7 TO
8
PRIVATE
PUBLIC
ISSN(Online): 2319-8753 ISSN (Print): 2347-6710
I
nternational
J
ournal of
I
nnovative
R
esearch in
S
cience,
E
ngineering and
T
echnology
(An ISO 3297: 2007 Certified Organization)
Website: www.ijirset.com
Vol. 6, Issue 5, May 2017
Figure 3: Hourly variation of traffic at Nalstop Intersection
From the plots of hourly variation found and the turning movement survey done at the intersection, it was found that, the traffic increasesdrastically and is at peak during the evening period of 5:30 pm to 6:30 pm.
From the survey done at the two intersections, following are the reasons for the traffic congestions observed at the two intersections:
(a) The road capacity at the two intersections do not fulfil the increasing number of vehicles and the increasing traffic demand.
(b) The traffic is improperly organised causing haphazard movement of traffic in all the directions. (c) People do not follow the traffic rules and regulations, leading to congestions at the two intersections. (d) Lane discipline is not followed by people that hampers the smooth flow of traffic at the intersection.
(e) Adding to the congestion are the Auto rickshaw drivers that drive very rough, risking the traffic moving around.
(f) At the Katraj intersection, a large number of trucks, buses and multi axle vehicle flow which cause slow movement of vehicle in traffic thus leading to longer delays at junction creating long queues.
(g) At the Katraj intersection, the Auto rickshaws and the six seaters occupy a large space which reduces the road width by 3 meters.
(h) The Bus depot at Katraj also creates chaos at the intersection. (i) The signal system on the Deccan Paud road is dis-organised.
(j) One of the major reasons for traffic congestions at the Nalstop intersection is the frequent Breakdown of BRT which occurs generally at the rate of twice a week.
(k) The pedestrian traffic at the two intersections also create problem in smooth movement of traffic.
V. CONCLUSIONS
From the variation in traffic and the traffic characteristics observed at the Katraj intersection, it is found thatthe major traffic volume moves from Pune to Katraj; Pune to Mumbai Pune Expressway bypass; Mumbai Pune Expressway bypass to Kondhwabudruk; and from Katraj to Pune.
At the Nalstop intersection, the major traffic flow occurs from Kothrud to Deccan; Deccan to Kothrud; Kothrud to Mhatre bridge; and from mhatre bridge to Deccan. The TDM strategies that can be applied at the two intersections are:
1. Increasing the Intelligent Transport System by redesigning the signal system at the two intersectionsto accommodate the increasing traffic.
2. Traffic claiming can be done at the Katraj intersection by providing a Y-flyover, whose one arm shall be for
0 5000 10000 15000
9 TO 10
10 TO 11
2 TO
3 5 TO
6 6 TO
7 7 TO
8
PRIVATE
PUBLIC
ISSN(Online): 2319-8753 ISSN (Print): 2347-6710
I
nternational
J
ournal of
I
nnovative
R
esearch in
S
cience,
E
ngineering and
T
echnology
(An ISO 3297: 2007 Certified Organization)
Website: www.ijirset.com
Vol. 6, Issue 5, May 2017
3. Traffic claiming can be done at the Nalstop intersection by providing a two way underpass for the traffic coming from Kothrud and going to Deccan; and vice versa. In addition to it the signal system at Nalstop intersection also needs to be redesigned for the increasing traffic.
4. The traditional Transit system at the Katraj intersection needs to be improved and the Depot needs to be improved to facilitate number of buses.
ACKNOWLEDGEMENTS
The survey was done by video recordings. The Pune Traffic Police have coordinated immensely for the survey work. Also guidance from NHAI officials was also taken to understand the analysis part.
REFERENCES
[1] B. F. Si, M. Zhong and Z. Y. Gao, “The discussion of optimization model for urban mixed traffic network” , Sixth International Conference of Traffic and Transportation Studies Congress (ICTTS), 2008
[2] Charles Anum Adams, M. Abdul Muhsin Zambang, Richter Opoku - Boahen, “Passenger Car Unit Values for Urban Mixed Traffic Flow at Signalised Intersections on Two Lane Dual Carriageways in Tamale Metropolis, Ghana”, International Refereed Journal of Engineering and Science, Vol. 3, Issue 5, May 2014
[3] Feng Wang and An Jin, “Traffic Demand Management In Guangzhou City For The 21st Century”, Second International Conference on
Transportation and Traffic Studies (ICTTS ), 2000
[4] Jiao Pengpeng Lu Huapu & Noboru Harata, “Evaluation Of Urban Traffic Management In China”, Ninth International Conference on Applications of Advanced Technology in Transportation (AATT), 2006
[5] Jung – Ah Ha, “Estimating Annual Average Daily Traffic Using Daily Adjustment Factor”, Journal of Emerging Trends in Computing and Information Sciences, July 2014
[6] M. S. Nimbalkar, Dr. V. R. Nagarale, S. B. Nalawade & Dr. Sachin eovre, “Urban Transportation Problem in a million city: A case study of Pune Urban Area”
[7] Manuj Darbari, “Development of Effective Urban Road Traffic Management Using Workflow Techniques for Upcoming Metro cities like Lucknow (India)”, International Journal of Security and its Applications, 2008
[8] P. S. Bhargavi& K. Kannaiya Raja, “A Study On The Effective Traffic Management Of Roads To Reduce Road Accidents In Tamil Nadu”, International Journal of Enterprise Innovation Management Studies, Vol.2, No.2, July 2011
[9] Rohan Giramkar, Koustubh Patil, Tridev Kharat, Durgesh Sonawane, Jobin Anthony & Dharavi Thawari, “Decongestion of Traffic in Pune City”, 2016
[10] Rupali P. Zope, “The Planning Strategies For Urban Land Use Pattern : A Case Study Of Pune City, India”, Journal of Innovative Research in Science, Engineering and Technology, Vol.2, Issue.7, July 2013
[11] Prof. S. T. Patil, “A Study of Problems and Possible Solutions for Better Pune Traffic Management”, ASM’s International E-Journal on Ongoing Research in Management and IT, 2015
[12] Shekhar K. Rahane & Prof. U. R. Saharkar, “Technique Identification For Road Traffic Congestion Solution In Talegaon Dabhade State Highway -55”, Journal of Information, Knowlegdge and Research in Civil Engineering, Nov 2013
[13] Shekhar K. Rahane & Prof. U. R. Saharkar, “Traffic Congestion – Causes & solutions : A Study O Talegaon Dabhade City”, Journal of Information, Knowledge and Research in Civil Engineering, Nov 2013
[14] Shoujiang Yu, Guiping Xiao & Lei Nie, “Traffic jams in Urban Areas- A case study in Gourd Island City of China” , Seventh International Conference on Applications of Advanced Technologies in Transportation (AATT), 2002