NITROGEN APPLICATION RATE INFLUENCE ON YIELD, QUALITY, AND CHEMICAL
CONSTITUENTS OF FLUE-CURED TOBACCO, PART I: APPLICATION TIMING
M.P. Drake1, M.C. Vann2*, and L.R. Fisher2
Research was conducted at 5 locations between 2012 and 2013 to determine the effect of nitrogen application rate and timing on yield, quality, and leaf chemistry of flue-cured tobacco. Urea–ammonium–nitrate was applied at 75, 100, and 125% of the recommended nitrogen rate for each specific field condition. All treatments were applied at differing intervals beginning at transplanting and concluding prior to or at topping. Yield data were collected postharvest, and leaf quality was determined according to U.S. Department of Agriculture grade. Crop value per hectare was quantified by a combination of yield and quality. Tissue samples were collected at layby and topping to evaluate total leaf nitrogen content at the respective growth stages. In addition, SPAD meter readings were collected at topping. Composite cured leaf tissue samples from all 4 stalk positions were analyzed for total alkaloid and reducing-sugar content. Data were sub-jected to analysis of variance (ANOVA) with the use of the PROC GLM procedure in SAS ver. 9.4. Treatment means
were separated with the use of Fisher’s protected LSD at P#
0.05. Crop yield, quality, and value were not affected by treatments across all locations, thus leading to the conclusion that all nitrogen application rates and timings were suitable under the observed growing conditions. Leaf nitrogen content at layby and topping, total alkaloids, reducing sugars, and SPAD readings were affected by application rate and timing. In general, as rate of applied nitrogen increased, alkaloid levels increased and reducing sugars decreased. Leaf nitrogen content at topping and SPAD measurements were highest in plots receiving a nitrogen application later in the season. Excessive rainfall in both seasons likely played a significant role in observed results. Based on current knowledge and information gained from this research, late-season nitrogen application is a useable tool but should be performed with caution to prevent reduction in leaf quality. Additional key words: Nitrogen, nitrogen rate, nitrogen timing, urea–ammonium–nitrate (UAN)
INTRODUCTION
Nitrogen is the most important macronutrient in flue-cured tobacco (Nicotiana tabacum L.) production. Appropriate levels of the nutrient are needed to produce a high-yielding, quality leaf with appropriate smoke flavor and aroma (9,12,17). Flue-cured tobacco will accumulate approximately 50% of the total nitrogen applied in a season within 5 weeks of transplanting (13). Remaining nitrogen accumulation will occur within an additional 4–5 weeks (8–9 weeks posttransplanting) (13). Nitrogen must be applied in adequate amounts to ensure availability to the plant during the essential stages of growth in order to have the greatest influence on chemical properties of the leaf (3).
Leaf ripeness is influenced by nitrogen availability and is highly correlated with leaf quality. Excess nitrogen will delay ripening and can result in cured leaf that is dark brown to black in color with dry, chaffy texture (9). Deficiencies of nitrogen result in immature tobacco leaves that visually appear ripe, but after curing are pale in color and lack desired physical and chemical properties (9). Leaf maturity is directly correlated with age of the plant, and ripeness is a factor of nitrogen attenuation as the growing season progresses (17). Additionally, an unripe leaf may be mature, but because of excess nitrogen may not be considered ripe and will not produce a quality leaf
if harvested. Because of the unique harvesting of the vegetative portion of the tobacco plant, leaves at different stalk positions will be at different physiological growth stages at any specific point in time (9). To ensure proper leaf quality it is important that a decline in nitrogen uptake occurs as the plant reaches maximum leaf area (9). This decline in nitrogen after maximum leaf area is reached allows for the harvest of properly ripened leaves without loss of yield potential.
Flue-cured tobacco is generally grown on sandy and sandy loam soils (7). With variation in soil type, nitrogen recommendations vary as well. Coarse soil types contain-ing larger proportions of sand may require as much as 89 kg N/ha, whereas soils with a greater percentage of clay may only require 56 kg N/ha (4). Current recommenda-tions for producers in the United States reflect these principles (17). Being the most important nutritional component of a fertility program, nitrogen is relatively abundant in the flue-cured tobacco plant, second only to potassium (7). Recommended flue-cured tobacco–pro-ducing soils are typically comprised of a coarse soil texture, are very well drained, and contain less than 1% organic matter (12). Soil nitrogen reserves are often very low, which adds to the importance of proper nitrogen fertilizer application rates (12). Tobacco produced on these specific soil types that have received excessive rain commonly experience significant leaching of nitrogen, which can result in high-sugar, low-nicotine leaf chemistry (12). Overfertilized or drought-stressed tobacco will result in low sugar and high nicotine content because of moisture stress, which reduces vegetative growth (12). Neither pro-duction scenario is desirable for producing quality leaf.
*Corresponding author: M.C. Vann; email: [email protected]
1Agronomy and Grower Relations–Universal Leaf North America,
3174 Boddie Mill Pond Road, Nashville, NC 27856.
2Crop Science Department, North Carolina State University, Raleigh,
Because of the leaching potential of nitrate–nitro-gen, many producers have altered their approach to fertility programs. According to McCants and Woltz (9) when nitrate–nitrogen is less than 30% of the total nitrogen source applied, reduced growth can occur because of ammonium toxicity. However, under current production practices this has not been observed. Parker (11) verified that nitrogen source did not affect flue-cured tobacco yield, leaf quality, value, total alkaloid content, reducing-sugar content, or leaf color. A transition in management to a fertility program where all, or at least a percentage, of the total nitrogen is applied from urea–ammonium–nitrate (UAN) can re-duce nitrogen loss in a cropping system and decrease input cost without compromising yield or quality. The use of UAN as a source of nitrogen has become a popular practice, with approximately 50% of the North Carolina flue-cured tobacco crop receiving at least a portion of total nitrogen from this source (17).
Current nitrogen rates applied to a tobacco crop are based on soil type, cultural practices, and field history (17). With past research focusing on fertility and nitrogen source, additional information is needed to determine if it is beneficial to split nitrogen applications into multiple applications. Applying nitrogen in more than 2 applications would allow producers to base nitrogen rates on current growing conditions in con-junction with field history. With nitrogen availability so closely correlated to weather conditions, and tobacco leaf quality being directly related to nitrogen availabil-ity, a new nitrogen regimen of more than 2 applications in a given season could assist growers in producing quality tobacco without reducing yield. Research was conducted to determine if splitting nitrogen applications into more than 2 applications was beneficial for suitable plant growth and to establish when the late-season threshold for application might occur.
METHODS AND MATERIALS
Field Procedures. Research was conducted at the Border Belt Tobacco Research Station (BBTRS) near Whiteville, NC and the Oxford Tobacco Research Station (OTRS) in Oxford, NC in 2012 and 2013. An additional location was added in 2013 at the Upper Coastal Plains Research Station (UCPRS) near Rocky Mount, NC. Tobacco was produced with the use of recommended practices from the North Carolina Co-operative Extension Service (6), with the exception of treatments imposed. After curing, leaves were weighed to quantify yield and assigned a U.S. Department of Agriculture government grade, which is based on leaf maturity and ripeness. Each grade has a corresponding index value rated from 1 to 100, with 100 being of the highest quality (1).
Treatments consisted of nitrogen applications made in differing combinations of timing and rate. Timings of nitrogen application were based on growth stages of the plant. Layby treatments (when plant height was approximately 38 cm) and at-topping treatments (when plant height was approximately 120 cm) were
approximately 4 and 8 weeks after transplanting, respectively. The control treatment for the study consisted of 50% of the recommended nitrogen rate applied at transplanting and 50% of the recommended nitrogen rate applied at layby. The control treatment was designed to simulate fertility programs currently utilized by tobacco producers. All treatments were implemented with the use of 28% liquid UAN applied to the soil surface with a TG-3 or TG-5 full-cone nozzle (TeeJet Spraying Systems Co., Wheaton, IL 60187), depending on the application rate of required nitrogen. Treatments were applied with a CO2-pressurized
back-pack sprayer ranging from 100 to 175 kPa, depending on application rate and nozzle size. Treatments were replicated 4 times and arranged in a randomized complete block design, with individual plots containing 4 rows, each measuring 1.21 m in width by 12.19 m in length. Spacing between individual plants within row was 0.55 m at all locations. Tissue sampling and leaf harvest were performed on the 2 center rows, with outside rows serving as border rows between treatments. Cultivar selection was dependent upon the specific growing location and is listed in Table 1. Leaf-tissue samples for total nitrogen content were collected at layby and topping. Layby occurs approximately 4 weeks after transplanting when plant height averages 38 cm. Topping, or removal of the apical meristem, occurs approximately 8 weeks after transplanting when plant height averages 120 cm. Green leaf tissue (layby and at topping) samples were collected at the third or fourth leaf from the apex of the plant. Sampled leaves measured approximately 10 cm wide and 15 cm long, and were collected from 5 plants within each plot. After curing, a 50-g composite sample from all 4 stalk positions was collected for total alkaloid and reducing-sugar content analysis. Following all sample collections, tissue was dried at 65uC, ground, and sent to the North Carolina State University Tobacco Analytical Services Lab for leaf nitrogen content and chemical analysis. Layby and topping samples were collected approxi-mately 1 week after the corresponding nitrogen treat-ments were applied. Leaf chlorophyll content was measured with the use of a Konica Minolta SPAD-502 meter (Konica Minolta, Tokyo, Japan). SPAD meter readings occurred on the same day, but prior to nutrient sample collection for the at-topping interval. In each plot, 10 leaves measuring approximately 15 cm in length and 10 cm in width were measured with the SPAD meter and then averaged.
individual growing locations (Tables 1 and 2). Within each location, rates of total nitrogen applied were 75% of the recommended nitrogen rate (treatments 2, 4, 6, 8), 100% of the recommended nitrogen rate (treatments 1, 3, 5, 7, 10), and 125% of the recommended rate (treatment 9) (Table 3). Nitrogen was soil applied with the use of a simulated soil-surface application technique and then incorporated with a Danish tine-rolling cultivator. The at-topping application was included to simulate drop nozzles used by high-clearance sprayers, which can apply nitrogen directly to the soil surface later in the growing season. Nitrogen applied directly to the soil surface 2 weeks after layby and at topping was not soil incorporated.
Analytical Procedures.Nitrogen.Total leaf nitrogen content was analyzed under the procedure of Nelson and Sommers (10) in the North Carolina State University Tobacco Analytical Services Lab in Raleigh, NC. The Macro-Kjeldahl method was used, but with modifica-tions as described by Nelson and Sommers (10), where the sample size was ground to ,80-mesh material to improve nitrogen recovery and shorten measurement time for each sample.
Total alkaloids and reducing sugars. Total alkaloid and reducing-sugar content was analyzed with the use of the Perkin-Elmer Autosystem XL Gas Chromatograph (PerkinElmer, Waltham, MA 02451) procedure in the North Carolina State University Tobacco Analytical Table 1. Soil taxonomy, pH, cultivar, transplanting date, and recommended base nitrogen rate at individual growing locations.
Location Soil Series Soil pH Cultivar Transplanting Date Base Nitrogen Rate
kg/ha
BBTRS-12a Goldsboro loamy sand
Fine–loamy, siliceous, subactive, thermic Aquic Paleudults
6.0 NC 71f April 18, 2012 74
OTRS-12b Helena sandy loam
Fine, mixed, semiactive, thermic Aquic Hapludults
5.9 CC 35g May 14, 2012 80
BBTRS-13c Goldsboro loamy sand
Fine–loamy, siliceous, subactive, thermic Aquic Paleudults
5.7 NC 196f April 17, 2013 80
OTRS-13d Helena sandy loam
Fine, mixed, semiactive, thermic Aquic Hapludults
6.0 CC 27g May 10, 2013 80
UCPRS-13e Norfolk Loamy Sand
Fine–loamy, kaolinitic, thermic Typic Kandiudults
5.9 NC 196f April 24, 2013 80
aBBTRS-12, Border Belt Tobacco Research Station in 2012. b
OTRS-12, Oxford Tobacco Research Station in 2012.
cBBTRS-13, Border Belt Tobacco Research Station in 2013. d
OTRS-13, Oxford Tobacco Research Station in 2013.
e
UCPRS-13, Upper Coastal Plain Research Station in 2013.
fGoldleaf Seed Company, Hartsville, SC 29550. g
Cross Creek Seed Company, Raeford, NC 28376.
Table 2. Monthly rainfall totals at individual growing locations.
Month BBTRS-12a OTRS-12b BBTRS-13c OTRS-13d UPCRS-13e
cm
April 5.9 9.9 5.8 11.6 6.8
May 22.8 15.6 57.5 11.6 7.3
June 5.8 5.7 65.5 26.3 25.3
July 20.6 28.1 31.3 24.1 12.5
August 36.5 16.5 16.9 10.7 11.5
September 10.6 13.8 12 4.9 12.3
October 11.4 6.3 2.7 5.9 8.3
Total 113.6 95.9 191.7 95.1 84
Average 80 70 80 70 70
% above average 41% 37% 140% 37% 20%
a
BBTRS-12, Border Belt Tobacco Research Station in 2012.
bOTRS-12, Oxford Tobacco Research Station in 2012. c
BBTRS-13, Border Belt Tobacco Research Station in 2013.
dOTRS-13, Oxford Tobacco Research Station in 2013. e
Services Laboratory in Raleigh, NC. This procedure quantifies total alkaloid content based on chromato-graphic peak response at the retention times of alkaloid standards (8).
SPAD measurements. SPAD-502 measurements were conducted with the use of a Minolta chlorophyll meter. SPAD-502 measurements are relative chlorophyll measurements that nondestructively measure red-region transmittance peak of chlorophyll a and b (around 660 nm) of the leaf and calculate a numerical value (SPAD value).
Statistical analysis. Data for crop yield, quality, value, percent nitrogen at layby, percent nitrogen at topping, percent nitrogen of cured leaf, percent total alkaloids, percent reducing sugars, and SPAD measure-ments were analyzed in SAS version 9.4 (SAS, Cary, NC 27513). All parameters listed were subjected to an analysis of variance (ANOVA) with the PROC GLM procedure and treatment means were separated in accordance with Fisher’s Protected LSD at P# 0.05.
RESULTS AND DISCUSSION
There were no significant treatment by location interactions for yield, quality, value, leaf nitrogen content at layby, and total alkaloid percentage; those parameters are combined over years and locations where appropriate. At-topping leaf nitrogen content, SPAD measurements, and reducing-sugar content had a treat-ment by location interaction; each location was evalu-ated independently for those parameters.
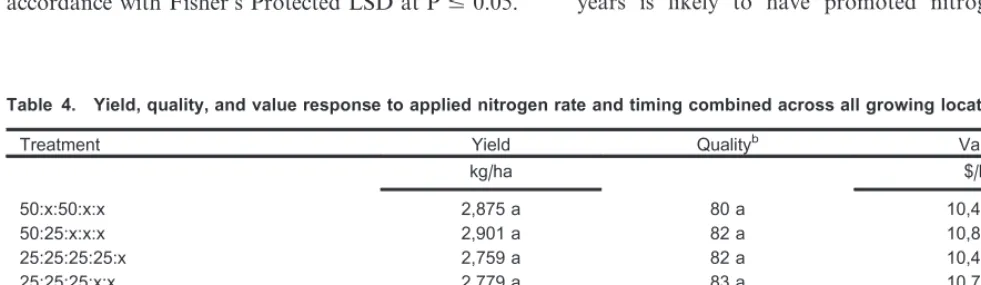
Yield, Leaf Quality, and Crop Value. Yield. Cured leaf yield was not affected by rate or timing of nitrogen application for any treatments (Table 4), despite above-average rainfall at all growing locations (Table 2). Current nitrogen recommendations (17) appear to be adequate for the production of acceptable flue-cured tobacco yield across a range of soil types in North Carolina; therefore, rates in excess of recommendation are discouraged. Excessive rainfall observed in both years is likely to have promoted nitrogen leaching, Table 3. Nitrogen application timing and percentage applied relative to recommended nitrogen rates at each location.
Treatment Nitrogen Application Timing
At Transplanting Two Weeks after
Transplantinga
At Laybyb Two Weeks after
Laybyc
At Toppingd Total
% of Total Nitrogen Recommended
50:x:50:x:x 50 – 50 – – 100
50:25:x:x:x 50 25 – – – 75
25:25:25:25:x 25 25 25 25 – 100
25:25:25:x:x 25 25 25 – – 75
25:x:25:25:25 25 – 25 25 25 100
25:x:25:25:x 25 – 25 25 – 75
25:25:x:x:50 25 25 – – 50 100
25:x:25:x:25 25 – 25 – 25 75
50:x:50:x:25 50 – 50 – 25 125
50:x:25:x:25 50 – 25 – 25 100
a
Approximate plant height520 cm; application 2 weeks after transplanting.
bApproximate plant height538 cm; application 4 weeks after transplanting. c
Approximate plant height550 cm; application 6 weeks after transplanting.
dApproximate plant height5120 cm; application 8 weeks after transplanting.
Table 4. Yield, quality, and value response to applied nitrogen rate and timing combined across all growing locations.a
Treatment Yield Qualityb Value
kg/ha $/ha
50:x:50:x:x 2,875 a 80 a 10,492 a
50:25:x:x:x 2,901 a 82 a 10,808 a
25:25:25:25:x 2,759 a 82 a 10,484 a
25:25:25:x:x 2,779 a 83 a 10,731 a
25:x:25:25:25 3,104 a 80 a 11,444 a
25:x:25:25:x 2,827 a 82 a 10,600 a
25:25:x:x:50 2,771 a 78 a 9,824 a
25:x:25:x:25 2,787 a 79 a 9,829 a
50:x:50:x:25 2,847 a 78 a 10,007 a
50:x:25:x:25 2,948 a 84 a 11,368 a
a
Treatment means followed by the same letter within the same column are not significantly different.
particularly later in the growing season and, therefore, excess nitrogen did not increase leaf yield above that which was underfertilized in this study.
Leaf quality.Cured leaf quality was not affected by rate or timing of nitrogen application (Table 4). These results conflict with previous research efforts and current Extension recommendations, which report a de-crease in leaf quality when total nitrogen rate is increased above recommended rates or when application occurs late season (4,5,12,14,17). It is plausible that above-average rainfall in 2012 and 2013 resulted in nitrogen leaching away from the rooting zone, allowing for a normal ripening process. Late-season rainfall in 2012 is likely to have leached excess nitrogen and/or late-applied nitrogen from the rooting zone. Addition-ally, in 2013, there was likely a negligible amount of nitrogen in the rooting zone because of early-season precipitation and leaching; therefore, the addition of late-season nitrogen did not add excess nitrogen to the soil profile. Because of observed growing conditions in 2013, later-season applications would be more accurate-ly described as leaching adjustments, though that was not the primary objective of the study.
Crop value.Crop value per hectare was not affected by the rate or timing of nitrogen application (Table 4). The lack of a crop-value response is largely due to the impact of weather on yield and quality, as described above.
Chemical Characteristics.Total alkaloids. A signif-icant treatment response was observed when comparing treatments for total alkaloid content in cured leaf (Table 5). The highest total alkaloid percentages were from treatments that had 100 or 125% of the recom-mended rate of applied nitrogen (Table 5). The 4 highest total alkaloid percentages (Table 5) also received a late-season nitrogen application, which occurred near the topping interval (Table 3). Bush (2) reported similar results, indicating an increase in total alkaloid content when applied nitrogen rate is increased. Despite slight variation in total alkaloid content, all treatment averages fell within the acceptable range for this specific chemical constituent (16).
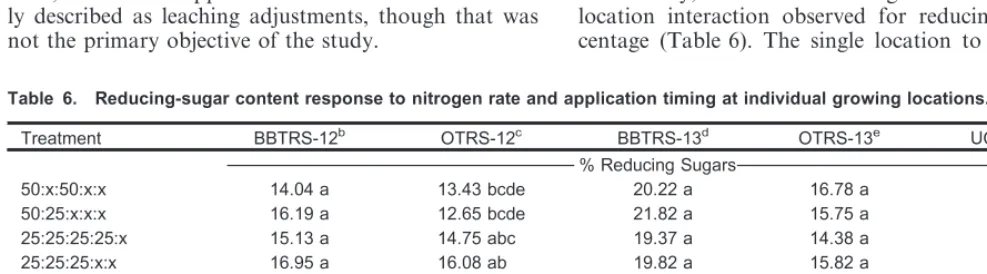
Reducing sugars.Each growing location is presented individually, as there was a significant treatment by location interaction observed for reducing-sugar per-centage (Table 6). The single location to demonstrate Table 5. Total alkaloids, leaf nitrogen content at layby, and SPAD measurement responses to nitrogen rate and timing combined over all growing locations.a
Treatment Total Alkaloids Layby Nitrogen Content
%
50:x:50:x:x 2.65 cde 4.34 ab
50:25:x:x:x 2.49 ef 4.61 a
25:25:25:25:x 2.54 def 4.15 bc
25:25:25:x:x 2.41 f 4.17 bc
25:x:25:25:25 2.76 abc 4.10 bc
25:x:25:25:x 2.43 f 4.00 c
25:25:x:x:50 2.85 ab 4.23 bc
25:x:25:x:25 2.56 cdef 4.04 bc
50:x:50:x:25 2.95 a 4.29 bc
50:x:25:x:25 2.72 bcd 4.34 ab
a
Treatment means followed by the same letter within the same column are not significantly different.
Table 6. Reducing-sugar content response to nitrogen rate and application timing at individual growing locations.a
Treatment BBTRS-12b OTRS-12c BBTRS-13d OTRS-13e UCPRS-13f
% Reducing Sugars
50:x:50:x:x 14.04 a 13.43 bcde 20.22 a 16.78 a 15.97 a
50:25:x:x:x 16.19 a 12.65 bcde 21.82 a 15.75 a 19.18 a
25:25:25:25:x 15.13 a 14.75 abc 19.37 a 14.38 a 15.59 a
25:25:25:x:x 16.95 a 16.08 ab 19.82 a 15.82 a 18.00 a
25:x:25:25:25 12.97 a 12.09 cde 18.71 a 15.20 a 16.52 a
25:x:25:25:x 16.86 a 17.54 a 20.16 a 14.71 a 17.89 a
25:25:x:x:50 14.23 a 11.07 de 19.19 a 13.85 a 18.00 a
25:x:25:x:25 15.97 a 10.69 de 21.55 a 16.38 a 17.89 a
50:x:50:x:25 13.93 a 9.97 e 19.14 a 11.60 a 15.41 a
50:x:25:x:25 15.00 a 13.92 bcd 21.47 a 12.45 a 16.09 a
aTreatment means followed by the same letter within the same column are not significantly different. b
BBTRS-12, Border Belt Tobacco Research Station in 2012.
cOTRS-12, Oxford Tobacco Research Station in 2012. dBBTRS-13, Border Belt Tobacco Research Station in 2013. e
OTRS-13, Oxford Tobacco Research Station in 2013.
a treatment effect was the OTRS in 2012, where an increase in reducing sugar occurred, most often, when total applied nitrogen was 75% of the recommended rate (Table 6). In general, this same trend was noted at all other locations, although it was not statistically significant. The correlation of increased reducing-sugar content and below recommended rates of applied nitrogen was reported by Tso (15). Total applied nitrogen is a direct indication of alkaloid percentage; therefore, as available nitrogen is decreased, in an ideal environment, alkaloid percentages are likewise de-creased (15). A reduction in total alkaloid content typically results in an increase of reducing-sugar content (15). Regardless of the treatment effect observed at the OTRS in 2012, and the trends observed at all other locations, reducing-sugar content averages were de-termined to be within acceptable ranges for flue-cured tobacco (16).
Leaf nitrogen content at layby. A response was observed when comparing treatments for leaf nitrogen content at the layby growth stage (Table 5). Treatment differences are a result of a larger percentage of total nitrogen application to specific treatments prior to layby. Of all the nitrogen application programs evaluated, treatments having less than 50% of the total nitrogen applied prior to or at the layby stage (treatments 5–8) had a lower nitrogen content (Table 5). Simply stated, when less total nitrogen was applied prior to layby, leaf tissue contained less nitrogen when compared to treatments receiving a larger percentage of nitrogen prior to or at layby. Results are not agronomically significant, because of the lack of visual nitrogen deficiency.
Leaf nitrogen content at topping. A treatment by location interaction was observed for leaf nitrogen content at topping (Table 7). In general, the highest nitrogen content at topping for all locations was typically Table 7. Leaf nitrogen content at topping in response to nitrogen rate and application timing at individual growing locations.a
Treatment BBTRS-12b OTRS-12c BBTRS-13d OTRS-13e UCPRS-13f
% Nitrogen at Topping
50:x:50:x:x 2.11 a 3.88 abc 1.54 cd 2.93 a 2.48 a
50:25:x:x:x 1.87 a 4.19 ab 1.43 d 2.84 a 1.79 c
25:25:25:25:x 1.91 a 4.30 a 1.73 cd 3.04 a 2.00 bc
25:25:25:x:x 1.85 a 3.61 c 1.52 cd 2.87 a 2.07 bc
25:x:25:25:25 2.15 a 3.50 c 2.56 a 2.85 a 2.03 bc
25:x:25:25:x 1.99 a 3.73 bc 1.97 bc 2.91 a 2.05 bc
25:25:x:x:50 2.57 a 3.79 bc 2.26 ab 2.76 a 1.83 c
25:x:25:x:25 1.84 a 4.13 ab 1.72 cd 2.88 a 2.33 ab
50:x:50:x:25 2.18 a 4.20 ab 1.75 cd 3.16 a 2.46 a
50:x:25:x:25 1.97 a 3.83 abc 1.76 cd 2.86 a 2.03 bc
aTreatment means followed by the same letter within the same column are not significantly different. b
BBTRS-12, Border Belt Tobacco Research Station in 2012.
cOTRS-12, Oxford Tobacco Research Station in 2012. d
BBTRS-13, Border Belt Tobacco Research Station in 2013.
eOTRS-13, Oxford Tobacco Research Station in 2013. f
UCPRS-13, Upper Coastal Plain Research Station in 2013.
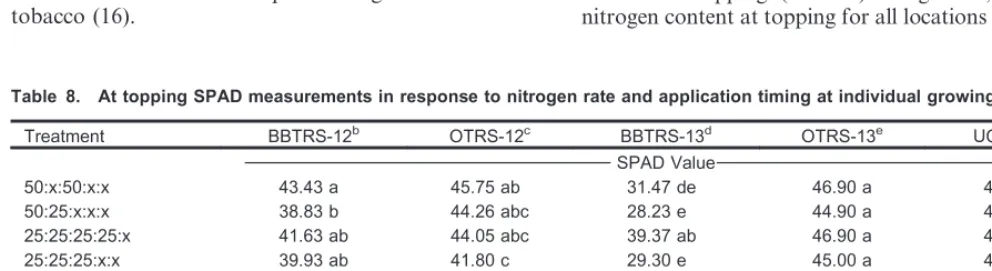
Table 8. At topping SPAD measurements in response to nitrogen rate and application timing at individual growing locations.a
Treatment BBTRS-12b OTRS-12c BBTRS-13d OTRS-13e UCPRS-13f
SPAD Value
50:x:50:x:x 43.43 a 45.75 ab 31.47 de 46.90 a 47.17 ab
50:25:x:x:x 38.83 b 44.26 abc 28.23 e 44.90 a 41.63 c
25:25:25:25:x 41.63 ab 44.05 abc 39.37 ab 46.90 a 41.93 c
25:25:25:x:x 39.93 ab 41.80 c 29.30 e 45.00 a 41.63 c
25:x:25:25:25 43.90 a 45.40 ab 42.37 a 44.68 a 42.03 c
25:x:25:25:x 38.30 b 43.38 bc 38.63 abc 44.20 a 42.30 bc
25:25:x:x:50 43.53 a 43.18 bc 33.03 cde 45.20 a 40.47 c
25:x:25:x:25 38.13 b 45.33 ab 31.83 de 45.35 a 44.40 bc
50:x:50:x:25 38.40 b 45.68 ab 35.47 bcd 46.20 a 50.00 a
50:x:25:x:25 40.67 ab 46.63 a 38.93 abc 44.35 a 43.40 bc
aTreatment means followed by the same letter within the same column are not significantly different. b
BBTRS-12, Border Belt Tobacco Research Station in 2012.
cOTRS-12, Oxford Tobacco Research Station in 2012. d
BBTRS-13, Border Belt Tobacco Research Station in 2013.
eOTRS-13, Oxford Tobacco Research Station in 2013. f
observed in treatments receiving a nitrogen application after layby. The single exception occurred at the UCPRS in 2013, where the control treatment, which did not receive nitrogen after layby, resulted in the highest nitrogen content (Table 7). Within each location, how-ever, leaf nitrogen content varied slightly, but was determined to be within an established range for accept-able content (4). Results were not agronomically significant because of a lack of visual nitrogen deficiency.
SPAD measurements. A treatment by location interaction was observed for SPAD measurements (Table 8). Variability in SPAD measurements existed across locations; therefore, no clear relationship among treatments could be determined. However, SPAD read-ings are indicative of chlorophyll content, and higher measurements were observed in most treatments re-ceiving above recommended rates of nitrogen and/or applications after layby (Tables 3 and 8).
CONCLUSION
Applying a percentage of the total recommended nitrogen rate later in the season did not affect the agronomic aspects measured in this study. Research in 2012 and 2013 indicates that leaf yield, quality, and value were not impacted when using the treatments discussed. However, producers considering nitrogen applications utilized in this study must give consideration to weather experienced during the 2012 and 2013 seasons, as excessive nitrogen can reduce leaf quality. A great need still exists to evaluate outcomes in a growing season where rainfall totals are closer to average or even below average. Results from the 2 locations in 2012 and the 3 locations in 2013 provide excellent representation of the various growing conditions experienced in North Carolina during both seasons. Rainfall was above average late in the 2012 season and above average early in the 2013 season; both scenarios are believed to have impacted soil nitrogen availability because of leaching. Based on previous research efforts (4,12), it can be inferred that if less rainfall had occurred in both growing seasons, differences in yield, quality, and value may have been observed. Under a variety of conditions, sugar to alkaloid ratios would likely be similar to that recorded in this study, with slightly higher total alkaloid measurement resulting from less rainfall. Leaf nitrogen content through-out the season would likely demonstrate similar accumu-lation patterns, as the conditions of this study did not result in nitrogen deficiency, and it would be presumed that uptake would reflect the results of this study.
The selection of liquid fertilizer sources allowed for greater ease of nutrient application in this study and would result in reduced financial input for producers because of lower material cost. The fertilizer source and application methods selected for this study are easily obtainable and practical to implement for the majority of growers in the tobacco-producing regions of the United States. Current nitrogen rate recommendations appear to be adequate for optimum yield and quality; therefore, producers should consider the potential negative outcomes of late-season nitrogen application.
LITERATURE CITED
1. Bowman DT, Tart AG, Wernsman EA, Corbin TC. 1988. Revised North Carolina grade index for flue-cured tobacco. Tob Sci 32:39–40.
2. Bush LP. 1999. Alkaloid biosynthesis. Pages 285–291, in: Tobacco: Production, chemistry, and technology. D.L. Davis and M.T. Nielsen, eds. Black-well Science, London, United Kingdom.
3. Chaplin JF, Miner GS. 1980. Production factors affecting chemical components of the tobacco leaf. Rec Adv Tob Sci 6:3–63.
4. Collins WK, Hawks SN Jr. 1993. Fertilization. Pages 97–140, in: Principles of flue-cured tobacco production. W.K. Collins and S.N. Hawks, Jr., eds. Collins WK and Hawks SN Jr., Raleigh, NC.
5. Felipe EE, RC Long. 1988. Management of flue-cured tobacco grown with excess nitrogen. Tob Sci 32:53–56.
6. Fisher LR, editor. 2014. North Carolina State University: Flue-cured tobacco guide 2014 AG-187. Revised ed. North Carolina Cooperative Extension, Raleigh, NC.
7. Flower KC. 1999. Field practices. Pages 76–103, in: Tobacco: Production, chemistry, and technology. D.L. Davis and M.T. Nielsen, eds. Blackwell Science, London, United Kingdom.
8. Lewis RS, Parker RG, Danehower DA, Andres K, Jack AM, Whitely DS, Bush LP. 2012. Impact of alleles at the yellow burley (yb) loci and nitrogen fertilization rate on nitrogen utilization efficiency and tobacco-specific nitrosamines (TSNA) formation in air-cured tobacco. J Agric Food Chem 60:6454–6461.
9. McCants CB, Woltz WG. 1967. Growth and mineral nutrition of tobacco. Adv Agron 19:211–265.
10. Nelson DW, Sommers LE. 1973. Determination of total nitrogen in plant material. Agron J 65:109–112. 11. Parker RG. 2009. Evaluation of nitrogen sources and rates on yield and quality of modern flue-cured tobacco cultivars [dissertation]. Raleigh (NC): North Carolina State University. 78 p. Available from: NCSU Libraries, Raleigh, NC; 317128318.
12. Peedin GF. 1999. Production practices: Flue-cured tobacco. Pages 104–142, in: Tobacco: Production, chemistry, and technology. D.L. Davis, and M.T. Nielsen, eds. Blackwell Science, London, United Kingdom.
13. Raper CD, McCants CB. 1966. Nutrient accumulation in flue-cured tobacco. Tob Sci 10:109.
14. Tso TC. 1990. Mineral nutrition—Primary ele-ments. Pages 279–311, in: Production, physiology, and biochemistry of tobacco plant. Ideals, Inc, Beltsville, MD. 15. Tso TC. 1990. Chemical characteristics. Pages 595–614, in: Production, physiology, and biochemistry of tobacco plant. Ideals, Inc, Beltsville, MD.
16. Tso TC. 1999. Seed to smoke. Pages 1–31, in: Tobacco: Production, chemistry, and technology. D.L. Davis and M.T. Nielsen, eds. Blackwell Science, London, United Kingdom.