DOI: 10.1534/genetics.103.013227
A Multistage Testing Strategy for Detection of Quantitative Trait Loci Affecting
Disease Resistance in Atlantic Salmon
Thomas Moen,*
,1Kjersti T. Fjalestad,* Hege Munck* and Luis Gomez-Raya
†*AKVAFORSK (Institute of Aquaculture Research), N-1432 Aas, Norway and
†A` rea de Produccio´ Animal, Centre UdL-IRTA, 25198 Lleida, Spain
Manuscript received January 10, 2003 Accepted for publication February 1, 2004
ABSTRACT
A multistage testing strategy to detect QTL for resistance to infectious salmon anemia (ISA) in Atlantic salmon is proposed. First, genotyping of amplified fragment length polymorphisms (AFLP) and a transmis-sion disequilibrium test (TDT) were carried out using dead offspring from a disease resistance challenge test. Second, AFLP genotyping among survivors followed by a Mendelian segregation test was performed. Third, within-family survival analyses using all offspring were developed and applied to significant TDT markers with Mendelian inheritance. Maximum-likelihood methodology was developed for TDT with dominant markers to exploit linkage disequilibrium within families. The strategy was tested with two full-sib families of Atlantic salmon sired by the same male and consisting of 79 offspring in total. All dead offspring from the two families were typed for 64 primer combinations, resulting in 340 scored markers. There were 26 significant results out of 401 TDTs using dead offspring. In the second stage, only 17 marker families showed Mendelian segregation and were tested in survival analysis. A permutation test was performed for all survival analyses to compute experimentwiseP-values. Two markers, aaccac356 and agccta150, were significant atP⬍0.05 when accounting for multiple testing in the survival analyses. The proposed strategy might be more powerful than current mapping strategies because it reduces the number of tests to be performed in the last testing stage.
T
HE spread of diseases is a major problem in aqua- When a genetic map is not available, an alternative culture production, and determining the genetic strategy for a genome scan is to use markers that can architecture of disease resistance traits is of great inter- be developed without prior knowledge of the DNA se-est to geneticists working on aquaculture species. Map- quence in the marker region. Among these markers, ping of quantitative trait loci (QTL) for disease resis- amplified fragment length polymorphisms (AFLP) tance is one approach that can provide information on markers are the most widely used. AFLP markers (Vosthe location and effects of the genes influencing the et al.1995) are known to be highly reproducible (Jones
trait. QTL can be identified through a genome scan in et al. 1997;Bagleyet al.2001), and several markers can which the segregation of a large number of markers, be genotyped at a time. AFLPs, however, are dominant distributed over the whole genome, is tested for associa- markers, meaning that one of the homozygous geno-tions with the recorded phenotypes. Ideally, the markers types cannot be distinguished from the heterozygous should be codominant and have high heterozygosity. genotype without the use of special equipment/software Microsatellite markers fulfill both these criteria and are (Castiglioniet al. 1999;PiephoandKoch2000). The regarded by many as the marker of choice for QTL dominant nature of AFLP markers makes their use in research (e.g., Jacksonet al. 1998; Ozakiet al. 2001). mapping experiments more difficult.
The development of microsatellites is, however, a re- QTL mapping for disease resistance in fish typically source-demanding process, and for many species, high- relies on the use of challenge tests in which offspring density microsatellite maps are not available. Among groups are exposed to the disease. The survival times the aquaculture species, microsatellite maps have been are recorded, or each animal is classified simply as sus-published on rainbow trout (Younget al. 1998; Saka- ceptible or resistant. The data can be analyzed by differ-motoet al. 2000;Nicholset al. 2003), catfish (Wald- ent methods. We propose in this article a testing strategy bieseret al.2001), tilapia (Kocheret al.1998;Agresti based on two statistical methods used in research on
et al. 2000), and Japanese flounder (Coimbra et al.
humans. The transmission disequilibrium test (TDT; 2003), but not on Atlantic salmon.
Spielman et al. 1993) compares the number of times that a marker allele is transmitted or not transmitted from a heterozygous parent to an affected offspring,
1Corresponding author:AKVAFORSK, Box 5010, N-1432 Aas, Norway.
E-mail: [email protected] and therefore only the affected offspring are
Gen A/S, Hemne, Norway. The breeding population consists
ered. The TDT has been applied only to codominant
of paternal half-sib families, each comprised of two full-sib
markers such as microsatellites, because the test requires
families (Refstie1990). Challenge tests for ISA are carried out
that alleles can be traced from parents to offspring. on a routine basis at VESO Vikan AkvaVet, Namsos, Norway, as Survival analysis (Altman1991) has been widely used part of the procedure for broodstock selection. Prior to the
challenge test, the fish were kept under standard
environmen-in human medicenvironmen-ine for testenvironmen-ing of medical treatments.
tal conditions and individually tagged with passive integrated
Survival analysis is expected to be more powerful than
transponder tags. The test was performed 8 months after first
the TDT, since the variable used is the survival time of
feeding. After 8 days of acclimatization at the test facilities,
each animal instead of the categorical characteristics the fish were intraperitoneally injected with 0.2-ml doses of “susceptible/resistant.” However, it is more labor de- the infectious material diluted in 0.85% PBS. The challenge manding, since it requires the genotyping of both sus- was done in fresh water with an approximate water tempera-ture of 12⬚. Mortality was monitored until 50% of the offspring
ceptible and resistant animals.
overall were dead and then the experiment was terminated.
A common problem in QTL mapping experiments
The cause of death was verified by bacteriological tests of 10%
attempting a large coverage of the genome is reduced of the fish using blood-agar plates. Plates with and without power of detection due to multiple testing; i.e., when 2% NaCl were used, since other potential pathogens could many markers are tested, some tests are expected to have a range of salt preferences. Dead fish were collected each day and stored at ⫺20⬚ for later DNA analyses. After
give significant results just by chance. We propose in
termination of the test, the survivors were killed and stored
this article a strategy for detection of QTL that takes
at⫺20⬚. All procedures were according to standard operation
into account both the multiple testing problem and the
procedures at VESO Vikan AkvaVet, which is operated in
com-possible lack of a genetic map. The testing stages of this pliance with the OECD principles of Good Laboratory Practice scheme are (1) affected fish from a disease-resistance with regard to European Union Council Directive 88/320/ EEC. From the larger set of families tested, tissue was collected
challenge test are genotyped for AFLP markers and the
from parents and all offspring from 30 randomly selected
data are analyzed with the TDT; (2) resistant fish are
paternal half-sib families to be used in this study. From among
genotyped for significant markers from stage 1, and a
these 30 families, 1 half-sib family, composed of 2 full-sib
test for Mendelian segregation is performed; and (3) families of 40 and 39 offspring, was chosen on the basis of all TDT-significant markers that follow Mendelian segre- (1) the number of informative AFLP markers observed in the gation are analyzed using survival analysis. The strategy three parents and (2) the distribution of susceptible/resistant individuals within each full-sib family (1:1 ratio considered
makes it possible to perform a genome scan in a
rela-optimal).
tively fast and cost-effective way. Furthermore, it reduces
DNA extraction:DNA was extracted using the DNeasy kit
the multiple testing problem because only a subset of (96-well format) from QIAGEN (Chatsworth, CA). The DNA markers is taken to the final test stage. Objectives concentration was estimated from the absorbance at 260 nm needed to make the strategy feasible were (a) to develop (A260), measured on a GeneQuant II spectrophotometer (Amersham Pharmacia). The quality of the DNA was inspected
a maximum-likelihood method to allow transmission
using agarose gel electrophoresis and theA260/A280ratio.
disequilibrium testing using dominant markers and (b)
AFLP genotyping:The AFLP (Voset al.1995) genotyping
to develop within-family survival analysis for QTL
detec-was done using the AFLP Analysis System I and the AFLP
tion with dominant markers. starter primer kit from Life Technologies and according to The strategy is a general approach to detect QTL the kit manual. The EcoRI primers were end labeled with
␥-33P. DNA fragments were separated on 6% polyacrylamide
in species with no available maps. However, we have
gels (19:1 acrylamide:bis; 7.5 murea, 1⫻ TBE buffer). The
developed and applied the strategy to detect QTL for
electrophoresis was run at 60 W constant power.
resistance against infectious salmon anemia (ISA) in
Only markers that were reproducible and had a fragment
Atlantic salmon. ISA causes severe problems in the At- size of 50–600 bp were scored. The AFLPs were scored as lantic salmon farming industry in Norway, Canada, Scot- dominant markers. The genotypes of parents with the band-land, and the United States (Thorud andDjupvik et present phenotype for a given marker were inferred from the AFLP phenotypes of offspring. The AFLP markers were named al. 1988;Mullinset al. 1998;Rodgeret al. 1998;
Bouch-by the three selective nucleotides of theEcoRI primer, followed
ardet al. 2001). The causal agent belongs to the
ortho-by the three selective nucleotides of theMseIprimer, with the
myxoviridae family of RNA viruses (Falk et al. 1997), fragment length (in base pairs) at the end.
and typical pathological changes include severe anemia, Multistage testing strategy:The strategy was based on dis-leucopenia, ascites, and hemorrhagic liver necrosis carding markers in the following sequential tests: transmission disequilibrium test, Mendelian segregation test, and QTL
de-(ThorudandDjupviket al. 1988;Evensenet al. 1991).
tection using survival analysis within families (Figure 1).
The accumulated mortality of an attack ranges from 15
Transmission disequilibrium test:An application of the TDT
to 100% (Thorud 1991). Atlantic salmon is the only
was developed to deal with dominant markers and the family
species known to develop the disease, although the virus structure currently used in challenge tests by the Norwegian may survive and replicate in other salmonids as well salmon industry (one sire mated to two dams). The form of the TDT depended on the parental genotypes. The standard
(Nylundet al.1997).
TDT is a McNemar test:2⫽(T⫺NT)2/(T⫹NT), where
Tis the number of times that the allele in question was trans-mitted from a heterozygous parent to an affected offspring, MATERIALS AND METHODS
and NT is the number of times that the allele was not transmit-ted (from a heterozygous parent carrying the allele to an
Challenge test for resistance to ISA:The genetic material
sire and both dams were heterozygous. In Table 1,vs,vd1,vd2 are the transmission parameters from the sire, dam 1, and dam 2, respectively. A transmission parameter is the probability of transmission of one of the parental alleles to its offspring. Under the null hypothesisvs⫽0.5,vd1⫽0.5, andvd2⫽0.5;
K1andK2are constants. The likelihood equation correspond-ing to the case in which the sire and both dams were heterozy-gous can be found in the first row of Table 2. A test for the transmission disequilibrium based on the likelihood ratio statistics was performed by likelihood ratio test (LRT)ⵑ⫺2 lnL(0.5, 0.5, 0.5)/L(vs, vd1, vd2) with 2 d.f. Similar equations and tests were derived for the other situations (Table 2).
Mendelian segregation test:A test for the Mendelian segrega-tion was carried out for each marker that turned out significant in the TDT. The expected segregation ratios were tested using chi-square goodness of fit. The significance levels used for the test were 0.10, 0.05, and 0.01. Markers significant at any of those levels were not used in the following testing stage. The use of threshold at 0.10 was done to assure that markers in the survival analyses were segregating in a Mendelian fashion. QTL detection using survival analysis within families:Survival analysis utilizes more information than TDT does, since the variable used is the number of days each fish survived. Also, it considers both susceptible and resistant fish. All fish shared the same environment and a survival analysis within families was therefore appropriate. The two groups to be compared were (1) offspring with the band-present marker phenotype within a full-sib family and (2) offspring with the band-absent marker phenotype within the same full-sib family. Hypothesis testing was carried out using a log-rank test,
Figure 1.—Experiment design for the challenge test for ISA resistance in Atlantic salmon.
LRANK⫽(Oa⫺Ea)2/Ea⫹(Op⫺Ep)2/Ep,
whereEa⫽兺ti⫽1Eai, Ep⫽兺ti⫽1Epi, whereEai⫽di(rai/ri);Epi⫽
di(rpi/ri);diis the total number of cases (fish that died) during markers having one of the following parental marker genotype
dayi;riis the total number of fish at risk (still alive) at the configurations: (1) sire heterozygous (Aa) and both dams
beginning of dayi;raiis the number of fish at risk in the band-homozygous for the null allele (aa; the test was then done
absent group at the beginning of dayi;rpiis the number of on the half-sib family); (2) sireAa, one of the damsaaand
fish at risk in the band-present group at the beginning of day the other dam homozygous for the band allele (AA; the test
i;OaandOpare the total number of cases in the band-absent was then done on the full-sib family with mixed band-present/
and band-present groups, respectively (EaandEpare the corre-band-absent offspring); (3) sireaaand one or two damsAa
sponding expected counts). LRANK is distributed as a2 distri-(the test was then done on the full-sib family/families with
bution with 1 d.f. Kaplan-Meier survival curves were con-mixed band-present/band-absent offspring). McNemar’s test
structed for both groups by computing the cumulative approximately follows a chi-square distribution with 1 d.f.
proportion of offspring within the group still alive at any time; For the other markers, one or both full-sib groups had
Sa(ti)⫽Sa(ti⫺1) (rai ⫺dai)/raifor the band-absent group, and two heterozygous parents. Maximum-likelihood methods were
Sp(ti)⫽Sp(ti⫺1) (rpi⫺dpi)/apifor the band-present group. developed to detect distorted segregation of alleles among
The difference between the survival curves for the two the affected offspring. Table 1 lists the expected genotype
frequencies used to construct the likelihood equation when groups was estimated by the hazard ratio:
TABLE 1
The expected genotype frequencies within full-sib family when sire and both dams were heterozygous
Allele Allele Allele Expected genotype
from sire from dam 1 from dam 2 Genotype Phenotype frequency
A A — AA Band present vsvd1
A A — Aa Band present vs(1⫺vd1)
a A — AA Band present (1⫺vs)vd1
a A — Aa Band absent (1⫺vs)(1⫺vd1)
A — A AA Band present vsvd2
A — a Aa Band present vs(1⫺vd2)
a — A AA Band present (1⫺vs)vd2
a — a Aa Band absent (1⫺vs) (1⫺vd2)
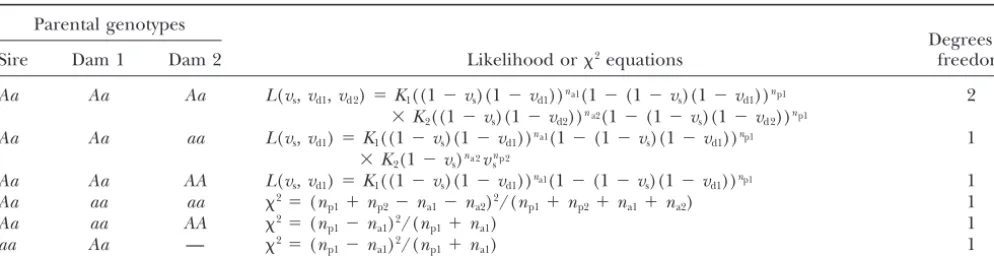
TABLE 2
Likelihood and McNemar equations for transmission disequilibrium testing for the possible combinations of parental genotypes for one sire mated to two dams
Parental genotypes
Degrees of
Sire Dam 1 Dam 2 Likelihood or2equations freedom
Aa Aa Aa L(vs,vd1,vd2)⫽K1((1⫺vs)(1⫺vd1))na1(1⫺(1⫺vs)(1⫺vd1))np1 2
⫻K2((1⫺vs)(1⫺vd2))na2(1⫺(1⫺vs)(1⫺vd2))np1
Aa Aa aa L(vs,vd1)⫽K1((1⫺vs)(1⫺vd1))na1(1⫺(1⫺vs)(1⫺vd1))np1 1
⫻K2(1⫺vs)na 2vnsp 2
Aa Aa AA L(vs,vd1)⫽K1((1⫺vs)(1⫺vd1))na1(1⫺(1⫺vs)(1⫺vd1))np1 1
Aa aa aa 2⫽(n
p1⫹np2⫺na1⫺na2)2/(np1⫹np2⫹na1⫹na2) 1
Aa aa AA 2⫽(n
p1⫺na1)2/(np1⫹na1) 1
aa Aa — 2⫽(n
p1⫺na1)2/(np1⫹na1) 1
K1andK2are constants;vs,vd1, andvd2are the transmission parameters from the sire, dam 1, and dam 2, respectively;na1and
na2are the numbers of affected offspring having the band-absent marker phenotype in families 1 and 2, respectively;np1and
np2are the numbers of affected offspring having the band-present marker phenotype in families 1 and 2, respectively.
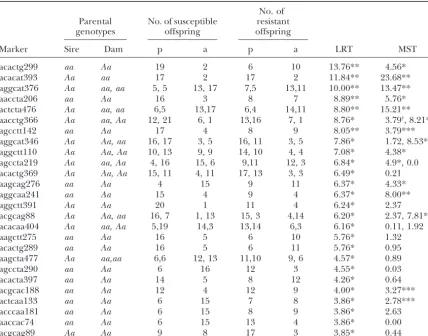
first testing stage resulted in 6 markers significant at
h⫽Op/Ep
Oa/Ea. P⬍0.01 and 20 significant atP⬍0.05 (Table 3). This
result indicates that the rate of significant markers is
An approximate 95% confidence interval for h was
esti-higher than expected by chance; there is an “excess”
mated by the back transformation of the standard error of
loge(h) with value of significant markers that could be attributed to the
association of alleles with disease resistance.
SE(loge(h))⫽
冪
1 Ep⫹ 1
Ea
. The second testing stage consisted of genotyping
sur-vivors for all significant markers at stage 1 and carrying out a Mendelian segregation test. This test was
per-Permutation test using survival analysis:FollowingChurchill
formed to reduce the number of tests in the third stage
and Doerge (1994), a permutation test was performed to
account for multiple testing. The usual procedure is to shuffle and to identify markers with non-Mendelian
inheri-the trait values randomly and inheri-then reassign each trait value tance. It is shown in Table 3 that six, five, and four of the to a new individual while retaining the genotype at all typed
TDT significant markers departed from the expected
markers for each individual. In the present permutation test,
Mendelian segregation atP ⬍0.01,P⬍ 0.05, andP⬍ the individuals were shuffled and the number of surviving
0.10, respectively. These markers were eliminated from
days was reassigned in the same order as the real data. This
was done for computational ease since shuffling the trait values the third stage of analyses.
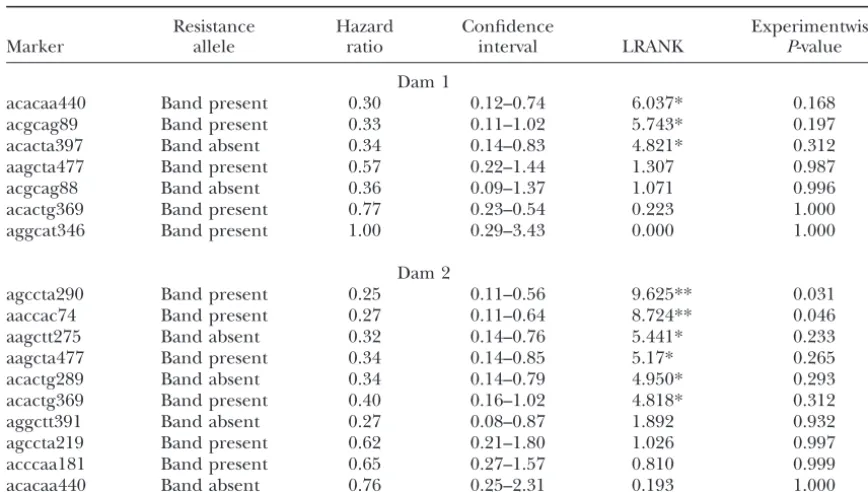
would require ordering according to the number of days alive. The third stage was to perform survival analyses for The shuffling was done 100,000 times within each full-sib
markers that were significant in the TDT and that also
family and for all markers tested in the survival analysis. A
followed Mendelian inheritance. A total of 17 markers
log-rank test was computed for each marker and permuted
were tested using survival analysis, from which 2 and 7
sample.
Each permutation set corresponding to all markers was or- were significant using the tabulated thresholds atP ⬍ dered and the highest value taken. The experimentwise critical 0.1 andP⬍ 0.05, respectively (Table 4).
value was computed as the number of times that the observed
A permutation test for the survival analysis with one
LRT value, when analyzing the true data, was higher than the
million replicates was, first, performed for one single
highest value of each permutation set divided by 100,000.
marker to compare tabulated and empirical thresholds.
In addition, one permutation test with one million replicates
but using one single marker was performed to compare empir- Table 5 shows that tabulated thresholds are
conserva-ical and tabulated thresholds in the survival analysis. tive, in particular, at low significance levels.
Next, a permutation test was performed simulating and testing all 17 markers in the survival analysis to
RESULTS
account for multiple testing. The results of the permuta-tion test are shown in Table 4. Only the 2 markers Parents and affected offspring of a paternal half-sib
family comprising of two full-sib families were geno- aaccac74 and agccta290 remained significant at P ⬍
0.05 after the permutation test. The hazard ratio was typed with AFLP markers. A total of 64 AFLP primer
combinations were used, resulting in 340 scored mark- ⵑ0.25 for both markers;i.e., a reduction of the mortality rate ofⵑ25% was observed among fish inheriting the ers (a polymorphism rate of 5.3%). A total of 401
trans-mission disequilibrium tests were performed using sus- band-present allele for either marker.
TABLE 3
LRT after TDT among susceptible offspring and Mendelian segregation test
No. of Parental No. of susceptible resistant
genotypes offspring offspring
Marker Sire Dam p a p a LRT MST
acactg299 aa Aa 19 2 6 10 13.76** 4.56*
acacat393 Aa aa 17 2 17 2 11.84** 23.68**
aggcat376 Aa aa, aa 5, 5 13, 17 7,5 13,11 10.00** 13.47**
aaccta206 aa Aa 16 3 8 7 8.89** 5.76*
actcta476 Aa aa, aa 6,5 13,17 6,4 14,11 8.80** 15.21**
aacctg366 Aa aa, Aa 12, 21 6, 1 13,16 7, 1 8.76* 3.79†, 8.21**
agcctt142 aa Aa 17 4 8 9 8.05** 3.79***
aggcat346 Aa Aa, aa 16, 17 3, 5 16, 11 3, 5 7.86* 1.72, 8.53**
aggctt110 Aa Aa, Aa 10, 13 9, 9 14, 10 4, 4 7.08* 4.38*
agccta219 Aa aa, Aa 4, 16 15, 6 9,11 12, 3 6.84* 4.9*, 0.0
acactg369 Aa Aa, Aa 15, 11 4, 11 17, 13 3, 3 6.49* 0.21
aagcag276 aa Aa 4 15 9 11 6.37* 4.33*
aggcaa241 aa Aa 15 4 9 4 6.37* 8.00**
aggctt391 Aa Aa 20 1 11 4 6.24* 2.37
acgcag88 Aa Aa, aa 16, 7 1, 13 15, 3 4,14 6.20* 2.37, 7.81**
acacaa404 Aa aa, Aa 5,19 14,3 13,14 6,3 6.16* 0.11, 1.92
aagctt275 aa Aa 16 5 6 10 5.76* 1.32
acactg289 aa Aa 16 5 6 11 5.76* 0.95
aagcta477 Aa aa,aa 6,6 12, 13 11,10 9, 6 4.57* 0.89
agccta290 aa Aa 6 16 12 3 4.55* 0.03
acacta397 aa Aa 14 5 8 12 4.26* 0.64
acgcac188 aa Aa 12 4 12 9 4.00* 3.27***
actcaa133 aa Aa 6 15 7 8 3.86* 2.78***
acccaa181 aa Aa 6 15 8 9 3.86* 2.63
aaccac74 aa Aa 6 15 13 4 3.86* 0.00
acgcag89 Aa Aa 9 8 17 3 3.85* 0.44
p, band-present phenotype; a, band-absent phenotype. Parental genotypes:Aa is heterozygous and aais homozygous for the band-absent allele. MST, Mendalian segregation test. *P⬍0.05; **P⬍0.01; ***P⬍0.10.
cac74 and agccta290 are shown in Figure 2. Only at the Mendelian inheritance. The advantages of this strategy very beginning did the lines corresponding to the band- are, first, that large parts of the genome can be covered present and band-absent groups cross each other for using fast and easily applicable typing. Second, the num-marker agccta290, indicating possible departure from ber of tests in the last stage is reduced, allowing a more the proportional hazard assumption. This assumption powerful design.
means that there is a constant relative risk along time The need to account for multiple testing is a general for each tested group. However, the crossing of the two problem in genome-wide testing for QTL. The proposed lines takes place at the very beginning and could be strategy alleviates the problem by making a large reduc-attributed to chance. tion in the number of tests performed in the survival analysis. However, the multistage method was not opti-mized in the sense that thresholds at the TDT stage
DISCUSSION could be made larger or smaller to maximize the
proba-bility of not missing a QTL while limiting the number The purpose of this study was to propose a strategy
of tests to be performed in the survival analysis. If the to detect QTL for disease resistance in aquaculture
spe-threshold is made smaller than that in this study (e.g., cies for which genetic maps are not available. The
strat-top 20% ranking markers at the TDT stage), then the egy is multistage: (1) TDT in deceased offspring is
ap-number of tests to be performed is larger in the survival plied using AFLPs; (2) only markers that were significant
analysis and the overall power might be reduced. More in the affected offspring are typed for the survivors and
research is needed to establish which thresholds should a test for Mendelian segregation is performed; and (3)
be used to achieve more powerful designs. a survival analysis is performed for markers that were
TABLE 4
Survival analysis results for the resistance allele, hazard ratio, confidence interval of hazard ratio
at 5%, LRANK, and experimentwiseP-values
Resistance Hazard Confidence Experimentwise
Marker allele ratio interval LRANK P-value
Dam 1
acacaa440 Band present 0.30 0.12–0.74 6.037* 0.168
acgcag89 Band present 0.33 0.11–1.02 5.743* 0.197
acacta397 Band absent 0.34 0.14–0.83 4.821* 0.312
aagcta477 Band present 0.57 0.22–1.44 1.307 0.987
acgcag88 Band absent 0.36 0.09–1.37 1.071 0.996
acactg369 Band present 0.77 0.23–0.54 0.223 1.000
aggcat346 Band present 1.00 0.29–3.43 0.000 1.000
Dam 2
agccta290 Band present 0.25 0.11–0.56 9.625** 0.031
aaccac74 Band present 0.27 0.11–0.64 8.724** 0.046
aagctt275 Band absent 0.32 0.14–0.76 5.441* 0.233
aagcta477 Band present 0.34 0.14–0.85 5.17* 0.265
acactg289 Band absent 0.34 0.14–0.79 4.950* 0.293
acactg369 Band present 0.40 0.16–1.02 4.818* 0.312
aggctt391 Band absent 0.27 0.08–0.87 1.892 0.932
agccta219 Band present 0.62 0.21–1.80 1.026 0.997
acccaa181 Band present 0.65 0.27–1.57 0.810 0.999
acacaa440 Band absent 0.76 0.25–2.31 0.193 1.000
*P⬍0.05; **P⬍0.01.
performed on susceptible fish and the survival analysis stage (survival analysis). Among the markers that were discarded because of non-Mendelian inheritance, sev-used on the whole data set are independent tests. This
assumption is not likely to be fully correct, since there will eral might be segregating anomalously just by chance. Another possible reason for the non-Mendelian segrega-be some dependence segrega-between the variables used
(af-fected/resistant and number of days survived). The as- tion is that Atlantic salmon is a partly tetraploid organ-ism (Wrightet al. 1983;AllendorfandThorgaard
sumption is, however, supported by the fact that the
two variables are different variables and also because 1984;AllendorfandDanzmann1997).
As a result of the application of the QTL testing strat-the animals tested in strat-the TDT are only a subset of strat-the
animals tested in the survival analysis. egy, two putative QTL affecting resistance to ISA were found within one of the full-sib families. A first crude The significant markers from TDT were tested for
departures from Mendelian segregation after incorpo- analysis of the segregation of the two QTL showed link-age between them (results not shown). A dense genetic rating resistant animals. Markers not following
Mende-lian inheritance were removed from the next testing map around this area would help for fine mapping of the putative QTL. The lack of an available genetic map makes it difficult to locate many markers around the
TABLE 5 two significant markers. One possibility to speed up this
process is the construction of a linkage map starting by
2tabulated and empirical thresholds at significance levels
establishing linkage between each of the two significant
of 0.005, 0.01, 0.05, and 0.10 after carrying a
permutation test with one marker and AFLP and the rest of the AFLP polymorphisms. In
addi-one million replicates tion, the genotyping of available microsatellites in our
material might be very useful to construct a genetic map
Threshold around this area.
Significance
The general conclusion of this study is that QTL
af-level Empirical Tabulated
fecting disease resistance can be detected in species in
0.005 7.10 7.88 which genetic maps are not available. This represents a
0.010 6.01 6.64 shortcut compared to QTL mapping strategies currently
0.050 3.50 3.84
used in terrestrial farm animals. Finally, the multistage
0.100 2.46 2.71
Bagley, M. J., S. L. AndersonandB. May, 2001 Choice of method-ology for assessing genetic impacts of environmental stressors: polymorphism and reproducibility of RAPD and AFLP
finger-prints. Ecotoxicology10:239–244.
Bouchard, D., K. Brockway, C. Giray, W. KeleherandP. L.
Mer-rill, 2001 First report of infectious salmon anemia (ISA) in
the United States. Bull. Eur. Assoc. Fish Pathol.21:86–88.
Castiglioni, P., P. Ajmonemarsan, R. VanwijkandM. Motto, 1999 AFLP markers in a molecular linkage map of maize: codominant
scoring and linkage group distribution. Theor. Appl. Genet.99:
425–431.
Churchill, G. A., and R. W. Doerge, 1994 Empirical threshold
values for quantitative trait mapping. Genetics138:963–971.
Coimbra, M. R. M., K. Kobayashi, S. Koretsugu, O. Hasegawa, E. O’Hara et al., 2003 A genetic linkage map of the Japanese
flounder,Paralichthys olivaceus.Aquaculture220:203–218.
Evensen, Ø., K. E. ThorudandY. A. Olsen, 1991 A morphological study of the gross and light microscopic lesions of infectious
anaemia in Atlantic salmon (Salmo salarL.). Res. Vet. Sci.51:
215–222.
Falk, K., E. Namork, E. Rimstad, S. MjaalandandB. H. Dannevig,
1997 Characterization of infectious salmon anaemia virus, an
orthomyxo-like virus isolated from Atlantic salmon (Salmo salar
L). J. Virol.71:9016–9023.
Jackson, T. R., M. M. Ferguson, R. G. Danzmann, A. G. Fishback, P. E. Ihssenet al., 1998 Identification of two QTL influencing
upper temperature tolerance in three rainbow trout (
Oncorhyn-chus mykiss) half-sib families. Heredity80:143–151.
Jones, C. J., K. J. Edwards, S. Castaglione, M. O. Winfield, F. Sala
et al., 1997 Reproducibility testing of RAPD, AFLP and SSR markers in plants by a network of European laboratories. Mol.
Breed.3:381–390.
Kocher, T. D., W. D. Lee, H. Sobolewska, D. PenmanandB.
McAn-drew, 1998 A genetic linkage map of a cichlid fish, the tilapia.
Genetics148:1225–1232.
Mullins, J. E., D. Groman andD. Wadowska, 1998 Infectious
salmon anemia in salt water Atlantic salmon (Salmo salar L.)
in New Brunswick, Canada. Bull. Eur. Assoc. Fish Pathol. 18:
110–114.
Nichols, K. M., W. P. Young, R. G. Danzmann, B. D. Robison, C. Rexroadet al., 2003 A consolidated linkage map for rainbow
Figure2.—Kaplan-Meier survival curves for markers aaccac74
trout (Oncorhynchus mykiss). Anim. Genet.34:102–115.
and agccta290.
Nylund, A., A. M. Kvenseth, B. KrossoyandK. Hodneland, 1997 Replication of the infectious salmon anaemia virus (ISAV) in
rainbow trout Oncorhynchus mykiss(Walbaum). J. Fish Dis. 20:
275–279.
Ozaki, A., T. Sakamoto, S. Khoo, K. Nakamura, M. R. M. Coimbra
conventional genome-wide scans where thresholds must
et al., 2001 Quantitative trait loci (QTLs) associated with
resis-be set very high to account for the testing of a large tance/susceptibility to infectious pancreatic necrosis virus (IPNV) number of genetic markers. in rainbow trout (Oncorhynchus mykiss). Mol. Genet. Genomics
265:23–31.
We are grateful to the personnel of VESO Vikan AkvaVet and Piepho, H. P., andG. Koch, 2000 Codominant analysis of banding
AquaGen for the biological material and for the challenge testing. data from a dominant marker system by normal mixtures.
Genet-This work has been supported by the Norwegian Research Council ics155:1459–1468.
with project no. 130162/130 titled “Strategic QTL Research Plan for Refstie, T., 1990 Application of breeding schemes. Aquaculture85:
Disease Resistance in Atlantic Salmon and Cattle.” 163–169.
Rodger, H. D., T. Turnbull, F. Muir, S. MillarandR. H. Richards,
1998 Infectious salmon anemia (ISA) in the United Kingdom.
Bull. Eur. Assoc. Fish Pathol.18:115–116.
Sakamoto, T., R. G. Danzmann, K. Gharbi, P. Howard, A. Ozaki
LITERATURE CITED et al., 2000 A microsatellite linkage map of rainbow trout (
Oncor-hynchus mykiss) characterized by large sex-specific differences in Agresti, J. J., S. Seki, A. Cnaani, S. Poompuang, E. M. Hallerman
recombination rates. Genetics155:1331–1345.
et al., 2000 Breeding new strains of tilapia: development of an
Spielman, R. S., R. E. McGinnisandW. J. Ewens, 1993 Transmission artificial center of origin and linkage map based on AFLP and
test for linkage disequilibrium: the insulin gene region and
insu-microsatellite loci. Aquaculture185:43–56.
lin-dependent diabetes mellitus (IDDM). Am. J. Hum. Genet.52:
Allendorf, F. W., andR. G. Danzmann, 1997 Secondary tetrasomic
506–516. segregation of MDH-B and preferential pairing of homeologues
Thorud, K., 1991 Infectious salmon anemia virus. Ph.D. Thesis,
in rainbow trout. Genetics145:1083–1092.
Norwegian College of Veterinary Medicine, Oslo. Allendorf, F. W., andG. H. Thorgaard, 1984 Polyploidy and the
Thorud, K., andH. O. Djupvik, 1988 Infectious salmon anemia in
evolution of salmonid fishes, pp. 1–53 inThe Evolutionary Genetics
Atlantic salmon (Salmo salarL.). Bull. Eur. Assoc. Fish Pathol.8:
of Fishes, edited by J. B.Turner. Plenum Press, New York.
109–111. Altman, D. G., 1991 Practical Statistics for Medical Research.
1995 AFLP: a new technique for DNA fingerprinting. Nucleic some pairing in tetraploid derivative salmonid genomes. Isozymes
Acids Res.23:4407–4414. Curr. Top. Biol. Med. Res.10:239–260.
Waldbieser, G. C., B. G. Bosworth, D. J. NonnemanandW. R. Young, W. P., P. A. Wheeler, V. H. Coryell, P. KeimandG. H. Wolters, 2001 A microsatellite-based genetic linkage map for Thorgaard, 1998 A detailed linkage map of rainbow trout
channel catfish,Ictalurus punctatus.Genetics159:727–734. produced using doubled haploids. Genetics148:839–850.
Wright, J. E., K. Johnson, A. HollisterandB. May, 1983 Meiotic