ISSN(Online): 2319-8753 ISSN (Print): 2347-6710
I
nternational
J
ournal of
I
nnovative
R
esearch in
S
cience,
E
ngineering and
T
echnology
(A High Impact Factor & UGC Approved Journal)
Website: www.ijirset.com
Vol. 6, Issue 9, September 2017
Forecasting of South West Monsoon Rainfall
by Using Best Subset Regression Model
Dr. Kulkarni A. A.1, Thorve B.K.2
Assistant Professor, New Arts, Commerce and Science College, Ahmednagar (MS), India1
Assistant Professor, New Arts, Commerce and Science College, Ahmednagar(MS), India2
ABSTRACT: In this paper, we study rainfall distribution of, Nashik, Beed and Ratnagiri district of Maharashtra state. We obtain the summary statistics for all the district such as a mean, median, mode, quartiles and coefficient variation. Also we fit multiple regression and best subset regression model to the data.
KEYWORDS: Rainfall distribution, R^2, Jack knife method, Regression, best subset.
I. INTRODUCTION
Indian economy is vitally linked with the monsoon because of its water resources. A large part of the country gets more than 75% of the annual rainfall during the four months, June to September.The production of food grains depends fairly closely on the amount and distribution of monsoon rainfall over the country. Further the generation of hydro-electric power from monsoon rain water has been traced over the last 20 years. While hydro-electric power constitutes about 40% of power from all sources, with proper surveys and planning additional hydro-electric power projects this percentage could, perhaps, be further substantially increased. The distinct advantage of hydro-electric power over all other types of power is that its source, i.e. monsoon water, is perennial, although it shows some fluctuations from year to year. The power of the monsoon winds at four and two stations on the West coast and in the interior respectively, has been assessed on the basis of five years hourly wind data. The wind at New Kandla on the West coast has a good potentiality for power. The wind power could be used for electricity, grinding corn and drawing water. On the debit side, Indian economy suffers heavy losses due to floods and droughts almost every year.
The population of India is increasing at a much faster rate than the total food grains production and soon the country may be facing a serious economic crisis. A large part of the monsoon water which is currently unutilized should be held at suitable locations for irrigation and possible power generation. Anything less than 90% of the average rainfall in a region is regarded as deficient rainfall. The most obvious victims of deficient rainfall are the farmers. Without proper rainfall they are left with absolutely no hope. In a nutshell, improper rainfall also contributes to increase in inflation. While proper rainfall can help food production reach unprecedented levels, deficient rainfall can lead to paucity in the total agricultural production.
II. PREVIOUS INSTANCES
ISSN(Online): 2319-8753 ISSN (Print): 2347-6710
I
nternational
J
ournal of
I
nnovative
R
esearch in
S
cience,
E
ngineering and
T
echnology
(A High Impact Factor & UGC Approved Journal)
Website: www.ijirset.com
Vol. 6, Issue 9, September 2017
III. IMPACT ON GROWTH
It is expected that at the end of the ongoing year growth in agricultural sector would reduce by 5% from the previous year. This will also take away 0.7% percentage points from the overall GDP growth of India. This will also have a detrimental effect on demand in the non-agricultural sector. In 2002 and 2009 however, India’s GDP had grown owing to growth in GDP around the world.
Impact on agriculture: Output of food-grain is supposed to be reduced. This will also hamper the overall growth in this sector. If it is a drought then food production will be reduced by 10% compared to the previous year. There will be a significant reduction in Kharif output as well. This is the production that happens during the summer season and rains play a major role in that. The soil will be drier compared to normal and there will also be lesser water to be used for irrigation. All these factors will mean that there is lesser production during the Rabi or winter season as well.
Impact on diesel demand: It is expected that usage of diesel will increase. At present 151,000 barrels are being used on a daily basis and this represents a growth of 9.4% from the previous year. Experts have said that if the poor rainfall continues then this will only increase. The Agriculture Ministry of India has already said that in places where rainfall has been lesser than 50% before July 2015, prices of diesel will be reduced by 50% as well. This is expected to come as a major relief for farmers. This is expected to increase diesel sales across the country at least till July.
Impact on rural demand: Experts say that there is very little probability of rural demand going down but consumption in the rural areas is supposed to be moderate. One of the major reasons for this is that people are nowadays more dependent on non-agricultural sector for their income.
Impact on food inflation: Normally, whenever there is poor monsoon, food inflation goes up by 4 to 5 percentage points. In 2009 the situation was much worse. In the ongoing fiscal WPI is expected to stay above 7% and could go up to 9%. In case of the last five droughts, WPI inflation stayed in the region of 8.5%, with WPI food inflation slightly lower at 8%.
Impact on power sector: Since the water levels will be lower than normal in several hydroelectric dams, there will be lesser electricity. Analysts are also of the opinion that there will be lot more power outages as a result. During the intense heat of May and June, rains act as a cooling factor and without enough rainfall, there will be greater usage of electricity especially cooling systems and air-conditioners.
Impact on textile sector: Because of bad monsoon the demand for textile products is much less than before. The margins are also expected to be thinner than before. Experts say that this decreased demand will keep continuing as levels of capacity utilization will come down. Prospects of revenue growth are less as well.
Impact on PSU banks: Indian Government has always asked the nationalized banks to take steps to help farmers, especially in the areas which have not received sufficient rainfall. Bankers are also facing pressure in assisting the agricultural sector.
So it is very helpful if we have some prediction methods of rainfall. It will great helpful for planning to government such as import of food gains or export of food grains, some disaster management planning, economic planning, planning of drinking and industrial water etc.
Data Collection: We have collected daily rainfall data of three rainfall stations in Maharashtra state of India, namely Nashik, Beed and Ratnagiri from the year 1961 to 2016 for the month June , July , August and September.
Summary Statistics:
RH = RELATIVE HUMIDITY (in %)
DD = WIND DIRECTION (in 16 points of compass)
ISSN(Online): 2319-8753 ISSN (Print): 2347-6710
I
nternational
J
ournal of
I
nnovative
R
esearch in
S
cience,
E
ngineering and
T
echnology
(A High Impact Factor & UGC Approved Journal)
Website: www.ijirset.com
Vol. 6, Issue 9, September 2017
Table 1 : Summary Statistics for Nashik Station
Variable Mean Median Minimum Maximum
.RH 82.703 85.000 25.000 100.000
DD 26.766 27.000 2.000 99.000
FFF 20.597 22.000 2.000 88.000
max 28.416 28.100 22.600 40.400
min 21.441 21.500 16.800 26.000
R/F 7.304 2.500 0.100 191.800
Comments: - From the Table 1 we observe that in Nashik station, average rain fall is 7.304 mm and maximum rain fall is 191.8 in the year 1987 at 8th month.
Table 2 : Summary Statistics for Beed Station
Comments: - From the Table 2, we observe that in Beed station, average rain fall is 11.097 mm and maximum rain fall is 346.000 in the year 1989 at 7th month.
Table 3 : Summary Statistics fo Ratnagiri Station
Variable Mean Median Minimum Maximum
.RH 87.106 87.000 42.000 100.000
DD 25.809 27.000 2.000 99.000
FFF 9.5294 8.0000 2.0000 92.0000
max 29.126 29.200 24.000 36.600
min 24.131 24.000 18.400 28.500
R/F 26.981 12.400 0.100 385.100
Comments: - From the Table3, we observe that in Ratnagiri station, average rain fall is 26.981 mm and maximum rain fall is 385.100 in the year 1992 at 6th month
IV. METHODOLOGY
Variable Mean Median Minimum Maximum
.RH 75.450 79.000 29.000 100.000
DD 25.679 27.000 5.000 99.000
FFF 4.2402 4.0000 2.0000 26.0000
max 30.564 30.400 22.800 42.200
min 22.606 22.600 19.400 27.300
ISSN(Online): 2319-8753 ISSN (Print): 2347-6710
I
nternational
J
ournal of
I
nnovative
R
esearch in
S
cience,
E
ngineering and
T
echnology
(A High Impact Factor & UGC Approved Journal)
Website: www.ijirset.com
Vol. 6, Issue 9, September 2017
The most sensible approach for selecting a best subset out of available variables in a complex linear model is to compare all possible subsets. This procedure simply fits all the possible regression models (i.e. all possible combinations of predictors) and chooses the best one (or more than one)
In this study, we have fitted all the possible regression models and used jackknife method for the selection of 3 best models among them.
For ‘m’ standardized predictors for ‘n’ years, the multiple linear regression (MR) model equation can be written as
= + . Where is the ( 1) response (ISMR) matrix, B is the (1 ) matrix of regression coefficients, Z is the
( ) matrix of predictors of model size m and is the ( 1) error matrix.
Best Subset may actually estimate the regression coefficient & predict future response with smaller variance than the full model using all predictors.
There are various error measures & some of the commonly used error measures for selecting among models with different model are
1. Adjusted ^2 ( ^2), 2. Mallow’s Cp,
R bar is the estimated multiple correlation coefficient (R) adjusted for the number of predictors used in the model. Among various models, the best models the best model is the one having the highest Rbar ^2 value. Adjusted indicates how much variation in the response explained by the model. The higher the Adjusted , the better the model fits your data.
The Mallow’s Cp works by comparing a specific reduced model to the full model with all predictors included. Among various models, the best model is the one that having the lowest Cp value. A lowest Cp value indicates that the model is relatively precise (has small variance) in estimating the true regression coefficient & predicting future responses. In this study, the selection of best among the all possible regression models was done based on the R bar^2 criteria. Rbar^2 is related to the R^2 by the following equation.
= −( )
Where , the number of years in the validation period and p is is the model size. The Rbar^2 can also be computed using the following formula,
= 1− /( )
/( )
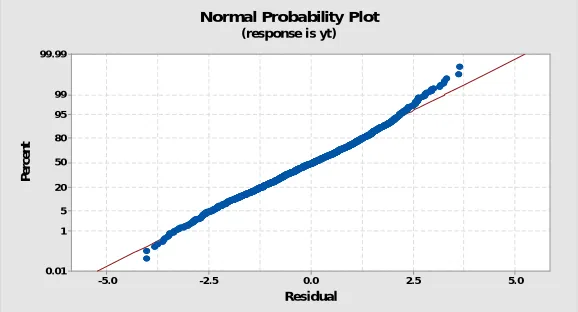
The data of rain fall is not normal, so we apply logarithm on r rain fall data and we get normal probability plot as given below. From the graph we conclude that logarithm of the rainfall values are normally distributed.
Figure 1 Normal probability plot for log of rainfall
5.0 2.5
0.0 -2.5
-5.0 99.99
99 95 80 50
20 5 1
0.01
Residual
P
e
rc
e
n
t
Normal Probability Plot
ISSN(Online): 2319-8753 ISSN (Print): 2347-6710
I
nternational
J
ournal of
I
nnovative
R
esearch in
S
cience,
E
ngineering and
T
echnology
(A High Impact Factor & UGC Approved Journal)
Website: www.ijirset.com
Vol. 6, Issue 9, September 2017
Table 4: Multiple Regression Analysis For station Nashik Predictor Coef SE Coef T P
Constant 1.4736 0.6006 2.45 0.014
.RH 0.031558 0.002417 13.06 0.000
DD 0.005519 0.003165 1.74 0.081
FFF -0.010317 0.002139 -4.82 0.000
max -0.007465 0.009428 -0.79 0.429
min -0.13668 0.02442 -5.60 0.000
S = 1.502 R-Sq = 6.8% R-Sq(adj) = 6.8%
From the Table 4, The Multiple regression line is Log R/F = 1.47 + 0.0316 .RH + 0.00552 DD - 0.0103 FFF - 0.00747 MAX - 0.137 MIN
Table: 5 Best Subsets Regression Model For station Nashik
Vars R-Sq R-Sq(adj) C-p S RH DD FFF MAX MIN
1 5.7 5.7 63.4 1.5111 X
1 1.7 1.6 279.1 1.5434 X
2 6.4 6.4 27.1 1.5054 X X
2 6.2 6.1 42.5 1.5078 X X
3 6.9 6.8 5.6 1.502 X X X
3 6.5 6.5 25.5 1.5051 X X X
4 6.9 6.9 4.7 1.5017 X X X X
4 6.9 6.8 7.2 1.5021 X X X X
5 7 6.9 6 1.5018 X X X X X
From the Table 5 relative humidity, wind direction, wind Speed and maximum temperature are important factors for rain fall.
The Multiple regression line is,
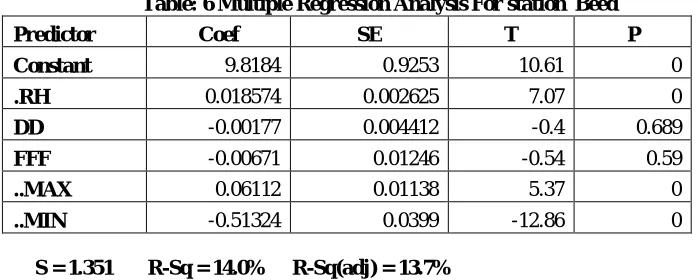
Log R/F = - 0.995 + 0.0310 .RH + 0.00655 DD - 0.0109 FFF - 0.0228 ..MAX Table: 6 Multiple Regression Analysis For station Beed
Predictor Coef SE T P Constant 9.8184 0.9253 10.61 0
.RH 0.018574 0.002625 7.07 0
DD -0.00177 0.004412 -0.4 0.689
FFF -0.00671 0.01246 -0.54 0.59
..MAX 0.06112 0.01138 5.37 0
..MIN -0.51324 0.0399 -12.86 0
ISSN(Online): 2319-8753 ISSN (Print): 2347-6710
I
nternational
J
ournal of
I
nnovative
R
esearch in
S
cience,
E
ngineering and
T
echnology
(A High Impact Factor & UGC Approved Journal)
Website: www.ijirset.com
Vol. 6, Issue 9, September 2017
Table: 7 Best Subsets Regression Model For station 43011 Beed
Vars R-Sq R-Sq(adj) C-p S RH DD FFF MAX MIN
1 10.1 10 63.1 1.38 X
1 3.8 3.7 165.4 1.4271 X
2 12.3 12.1 29 1.3635 X X
2 10.8 10.7 52.2 1.3745 X X
3 14 13.8 2.5 1.3504 X X X
3 12.3 12.1 30.9 1.3639 X X X
4 14 13.8 4.2 1.3508 X X X X
4 14 13.8 4.3 1.3508 X X X X
5 14 13.7 6 1.3512 X X X X X
From the Table 7, relative humidity, wind direction, and wind Speed are important factors for rain fall. The Multiple regression line is,
Log R/F = - 0.089 + 0.0197 .RH + 0.00090 DD - 0.0016 FFF Table: 8 Multiple Regression Analysis For station Ratnagiri Predictor Coef SE T P
Constant 18.965 3.847 4.93 0
.RH 0.04182 0.01616 2.59 0.01
DD -0.00472 0.00708 -0.67 0.506
FFF -0.00395 0.00844 -0.47 0.641
max -0.08712 0.07322 -1.19 0.236
min -0.7214 0.1301 -5.55 0
S = 1.470 R-Sq = 31.8% R-Sq(adj) = 30.0% From the Table 8 , Multiple regression line is,
ISSN(Online): 2319-8753 ISSN (Print): 2347-6710
I
nternational
J
ournal of
I
nnovative
R
esearch in
S
cience,
E
ngineering and
T
echnology
(A High Impact Factor & UGC Approved Journal)
Website: www.ijirset.com
Vol. 6, Issue 9, September 2017
Table: 9 Best Subsets Regression For station 43110 Ratnagiri
Vars R-Sq R-Sq(adj) C-p S RH DD FFF MAX MIN
1 27.1 26.8 10.8 1.5035 X
1 15.3 14.8 43.5 1.6213 X
2 30.9 30.2 2.3 1.4676 X X
2 29.1 28.4 7.3 1.4868 X X
3 31.5 30.5 2.7 1.4651 X X X
3 31.2 30.1 3.5 1.4683 X X X
4 31.7 30.2 4.2 1.4673 X X X X
4 31.6 30.2 4.4 1.4682 X X X X
5 31.8 30 6 1.4703 X X X X X
From the Table 9, relative humidity, and wind direction, are important factors for rain fall. The Multiple regression line is,
Log (R/F) = - 5.12 + 0.0879 .RH - 0.00811 DD V. CONCLUSION
1) Relative humidity, wind direction, wind Speed and maximum temperature are important factors for rain fall, in Nashik Station.
2) Relative humidity, wind direction and wind Speed are important factors for rain fall, in Beed station 3) Relative humidity, and wind direction, are important factors for rain fall in Ratnagiri station.
REFERENCES
1. M. Rajeevan , D.S.Pai, R.Anil Kumarm Sep 2005, New Statistical Modelss for long run range Forecasting of Southwest Mansoon rainfall over India, NCC, Pune.
2. P.Guhathakurta, Preetha Menon, A. B. Mazumdar and O. P. Sreejith, Dec. 2010, Changes in extreme rainfall events and flood risk in India during the last century, Research Report No: 3/2010, National Climate Centre, Pune.
3. A. K. Srivastava, M. Rjeevan and S. R. Kshirsagar, June 2008, Development of a High Resolution Daily Gridded Temperature Data Set (1969-2005) for the Indian Region, NCC 8, Pune.
4. Trevor Hastie, Robert Tibshirani, Jerome Friedman, The Elements of Statistical Learning (Data Mining, Interface and Prediction), Springer Series in Statistics.