DOI: 10.1534/genetics.109.109629
Defining and Mapping Mammalian Coat Pattern Genes: Multiple Genomic
Regions Implicated in Domestic Cat Stripes and Spots
Eduardo Eizirik,*
,†,‡,1Victor A. David,* Valerie Buckley-Beason,*
,2Melody E. Roelke,
§Alejandro A. Scha¨ffer,** Steven S. Hannah,
††Kristina Narfstro
¨m,
‡‡Stephen J. O’Brien* and Marilyn Menotti-Raymond*
*Laboratory of Genomic Diversity, National Cancer Institute, Frederick, Maryland 21702,†Faculdade de Biocieˆncias, Pontifı´cia Universidade Cato´lica do Rio Grande do Sul, Porto Alegre, Rio Grande do Sul 90619-900, Brazil,‡Instituto Pro´-Carnı´voros, Atibaia, Sao Paulo
12945-010, Brazil,§Laboratory of Genomic Diversity, SAIC-Frederick, National Cancer Institute, Frederick, Maryland 21702, **PetCare Company, National Center for Biotechnology Information, National Institutes of Health, Department of Health
and Human Services, Bethesda, Maryland 20894,††Nestle´ Purina, Saint Louis, Missouri 63164 and‡‡Department of Ophthalmology, Mason Eye Institute, University of Missouri,
Columbia, Missouri 65211 Manuscript received September 10, 2009 Accepted for publication October 12, 2009
ABSTRACT
Mammalian coat patterns (e.g., spots, stripes) are hypothesized to play important roles in camouflage and other relevant processes, yet the genetic and developmental bases for these phenotypes are completely unknown. The domestic cat, with its diversity of coat patterns, is an excellent model organism to investigate these phenomena. We have established three independent pedigrees to map the four recognized pattern variants classically considered to be specified by a single locus, Tabby; in order of dominance, these are the unpatterned agouti form called ‘‘Abyssinian’’ or ‘‘ticked’’ (Ta), followed by Spotted (Ts), Mackerel (TM), and Blotched (tb). We demonstrate that at least three different loci control the coat markings of the domestic cat. One locus, responsible for the Abyssinian form (herein termed the Tickedlocus), maps to an3.8-Mb region on cat chromosome B1. A second locus controls theTabbyalleles TMand tb, and maps to an5-Mb genomic region on cat chromosome A1. One or more additional loci act as modifiers and create a spotted coat by altering mackerel stripes. On the basis of our results and associated observations, we hypothesize that mammalian patterned coats are formed by two distinct pro-cesses: a spatially oriented developmental mechanism that lays down a species-specific pattern of skin cell differentiation and a pigmentation-oriented mechanism that uses information from the preestablished pattern to regulate the synthesis of melanin profiles.
P
ATTERNED coats are typical of many mammaliangroups, whose spots, stripes, and other markings have been hypothesized to play important adaptive roles in camouflage, predator evasion, and social
com-munication (Cott1940; Searle1968; Ortolaniand
Caro 1996). Many mammals bear striped or spotted
coats, and these phenotypes have historically drawn at-tention from many fields of human science and culture (e.g., the leopard’s spots, or the stripes seen in tigers and zebras). Although several theoretical studies have proposed mathematical models that could underlie the developmental dynamics of coat pattern formation in
mammals (Murray and Oster1984; Oyehaug et al.
2002), no direct investigation of the genetic basis of these phenotypes has yet been performed, so that their mechanistic causes remain a mystery. Recent advances in genomics, molecular biology, and evolutionary develop-mental biology (Evo-Devo) have revealed genes and path-ways involved in skin pattern formation in Drosophila (Schuget al.1998; Gompelet al.2005; Prud’hommeet al.
2006; Parchem et al. 2007), butterflies ( Joron et al.
2006a,b), and zebrafish (Iwashitaet al.2006; Watanabe
et al. 2006; Svetic et al. 2007). In contrast, despite the
relevance of characterizing equivalent processes in mam-mals, little progress toward this goal has been accom-plished, perhaps due to the lack of adequate mammalian models exhibiting variation in skin pattern and for which genetic and genomic tools were available.
The domestic cat is a very promising model in this regard, as it presents several coat pattern variants and a growing body of genetic and genomic tools suitable
for gene identification (Menotti-Raymondet al.2003;
Murphy et al. 2007; Pontius et al. 2007; Pontius
and O’Brien2007; Daviset al.2009). Classic work on
Supporting information is available online athttp://www.genetics.org/ cgi/content/full/genetics.109.109629/DC1.
1Corresponding author:Faculdade de Biocieˆncias, PUCRS, Av. Ipiranga
6681, Pre´dio 12, Porto Alegre, RS 90619-900, Brazil. E-mail: [email protected]
2Present address: George Mason University, Krasnow Institute For
Advanced Study, Center for Biomedical Genomic and Informatics, Manassas, VA 20110.
domestic cat coat color (Robinson1958; Lomax and
Robinson1988) has suggested that there is a monogenic
allelic series of coat patterns in the domestic cat,
con-trolled by theTabby(T) locus: in order of dominance, the
four recognized alleles would be Abyssinian or ‘‘ticked’’
(Ta), Spotted (Ts), Mackerel (TM), and Blotched (tb)
(Figure 1). Although there has been little doubt among breeders that the ‘‘mackerel’’ and ‘‘blotched’’ forms segregate as a single autosomal locus, this may not be
the case for the other two phenotypes (Taand Ts), which
so far have not been tested thoroughly for allelism
rel-ative to the more commonTabbyvariants TMand tb. Some
breeding data have suggested that these variants may not
be allelic with the mainTabbylocus (Lorimer1995), but
further scrutiny is required to test this hypothesis. A
recent genetic study (Lyonset al.2006) considered the
Abyssinian variant as an allele of Tabby, reflecting the
prevalent perception that they are coded by the same locus. Testing this hypothesis, and identifying the impli-cated genomic region (or regions), is a first step in the process of dissecting the molecular and developmental basis for these pattern-formation phenotypes.
Aiming to investigate the genetic basis of pattern formation on the domestic cat pelage by genomic, posi-tional methods, we established three separate pedigrees segregating for different combinations of coat pattern phenotypes. Our results demonstrate that at least three different loci underlie the striping and spotting patterns observed in domestic cats and identify the genomic loca-tion of two of them.
MATERIALS AND METHODS
Pedigrees and phenotyping: To avoid potential complica-tions stemming from multiple loci affecting coat pattern formation phenotypes, we chose to analyze each variant sepa-rately, a strategy that could simultaneously test for allelism and identify the implicated genomic regions. We thus estab-lished three independent pedigrees, each of which segregated for a single ‘‘Tabby’’ variant, relative to a standard. Pedigree 1 was a multigenerational outbred (and nonbreed) domestic cat pedigree maintained by the Nestle´ Purina PetCare Company for nutrition studies, which we have previously used to build a genetic linkage map of the domestic cat genome (Menotti
-Raymondet al.2009; Schmidt-Ku¨ ntzelet al.2009) and also to
identify genes involved in coat color and hair length (Eizirik
et al.2003; Ishidaet al.2006; Kehleret al.2007). It consisted of
287 individuals, 256 of which were genotyped. This pedigree showed segregation for the mackerel and blotched Tabby variants, providing a basis for their mapping using a genome scan.
Pedigrees 2 and 3 were specifically designed and developed for this study, in each case aiming to isolate the inheritance of a singleTabbyvariant. Both of these pedigrees were developed at the National Institutes of Health Animal Center (NIHAC), using a backcross mating design (Figure 2). Pedigree 2 focused on the inheritance of the ‘‘spotted’’ (Ts) variant and was founded with a pure-bred male cat of the Egyptian Mau breed, which was crossed with three unrelated blotched Figure1.—Major coat pattern phenotypes of the domestic
cat (Felis silvestris catus). A ‘‘hierarchy’’ of pelage patterns is ob-served in this species, with the absence of markings seen in Abyssinian cats (A) dominating over a spotted coat (B), which dominates over a ‘‘mackerel’’ (striped) coat (C), itself domi-nant over the blotched pattern (D). The classical, single-locus model for this phenotypic variation proposed the allelic series Ta.Ts.TM.tbfor these respective variants.
Figure 2.—Schematic of the mating strategy employed
females (supporting information,Figure S1). Egyptian Mau cats are fully spotted (Figure 3) and breed true for this trait, thus being homozygous for whatever alleles cause this coat pattern. Blotched was selected as the tester phenotype, since it is determined by a recessive allele relative to mackerel, so that these individuals can be confidently assumed to be homozy-gotes (tb/tb) at theTabby locus. The founder crosses of this pedigree were therefore set up to be TsTs3tbtb, considering the single-locus model ofTabbyinheritance.
Pedigree 3 focused on the inheritance of the Abyssinian (Ta) variant (known as ticked in breeder terminology), also based on a backcross mating design (Figure 2 andFigure S2). The Abyssinian form is semidominant relative to any of the other variants, with homozygotes Ta/Tabearing plain color (a homogeneous agouti coat, with banded individual hairs but no body markings) (Figure 1), and heterozygotes exhibit-ing faint, thin body stripes and bandexhibit-ing on the legs and tail (Lomaxand Robinson1988). The founders of this kindred
were two males previously generated in an Abyssinian pedigree segregating for retinal atrophy which had been outcrossed to non-Abyssinian European shorthairs (Menotti-Raymond
et al. 2007). Given their progenitors (both had different Abyssinian sires, each of which had been crossed to a blotched and a mackerel female, respectively), these two individuals were known to be heterozygotes carrying the TAallele, and indeed displayed stripes on the legs and tail of an otherwise typical Abyssinian (i.e., agouti or ticked) coat. These two F1 individuals were used for backcrossing with 12 non-Abyssinian females (mackerel or blotched), and phenotypic segregation of ticked was analyzed in the resulting third-generation individuals.
For all three pedigrees, individuals were phenotyped by E. Eizirik and photographs recorded in a central database maintained at the Laboratory of Genomic Diversity, National Institutes of Health (NIH). All cats analyzed in this study were maintained in facilities inspected by the United States Department of Agriculture, under conditions established by the American Association of Laboratory Animal Care in com-pliance with the federal Animal Welfare Act.
DNA extraction and marker genotyping: Blood samples were obtained from all individuals in pedigrees 1–3. In addition, for pedigrees 2 and 3, fibroblast cell lines were established as a source of high-quality genomic DNA. DNA was extracted from whole blood or cell lines using a QIAamp DNA Blood Midi kit (QIAGEN). PCR amplification was performed
with a touchdown PCR protocol as described previously (Menotti-Raymond et al. 2005). Sample electrophoresis
and genotyping, as well as Mendelian inheritance checking, were carried out as previously described (Ishidaet al.2006).
See theresultssection andTable S1for the microsatellite loci
typed in each pedigree.
Development of microsatellites for fine mapping ofTabby
and Ticked:After linkage was established to a known region using previously published cat STR markers, additional micro-satellites from candidate regions were mined from the cat 1.9X whole genome sequence (Pontius et al. 2007). Initially
microsatellites were selected on the basis of their conserved syntenic position in the dog, following the method described by Ishida et al. (2006). Following the availability of a cat
genome assembly (Pontiuset al.2007), microsatellite markers
were selected on the basis of their location on cat chromo-somes using the algorithm ABCC Retrieve STRs (ABCC STR-centric tools, http://www.abcc.ncifcrf.gov/Genomes/Cat/ index.php) (Pontiusand O’Brien2007) (these include all
loci used forTickedmapping with prefix ‘‘chrB1,’’ see below). Primers (seeTable S1) were designed with Primer 3 (http:// frodo.wi.mit.edu/cgi-bin/primer3/primer3_www.cgi (Rozen
and Skaletsky2000), including an M13 tail for fluorescent
labeling of PCR products (Boutin-Ganacheet al.2001). Genetic linkage mapping:Single-marker LOD scores were computed using Superlink (Fishelson and Geiger 2002;
Fishelson and Geiger2004), as described in Ishida et al.
(2006) and Kehleret al.(2007). Recombination fractions are
optimal to within 0.01. Multipoint analyses were performed to clarify which markers belong above or below the intervals of zero recombination. The traits were modeled as fully pene-trant. For the LOD scores shown here, the trait-associated allele frequency was set to 0.25, but the LOD scores are insensitive to this value. Marker-allele frequencies were set all equal, but since most of the cats are genotyped, the marker allele frequencies have little effect on the LOD scores.
RESULTS
A detailed inspection of phenotype segregation in pedigree 1 corroborated the expected monogenic
in-heritance of the mackerel and blotchedTabbyvariants
(Figure 1), with the latter being a fully penetrant, Figure 3.—Phenotypic variation observed in
autosomal recessive allele. In the absence of candidate genes for this phenotype, a genome scan was performed using 483 microsatellite markers. Among these
estab-lished markers, significant linkage to theTabbylocus was
observed in a region of chromosome A1 [markers
FCA566 (LOD¼31.4,u¼0.01), FCA90 (LOD¼10.7,
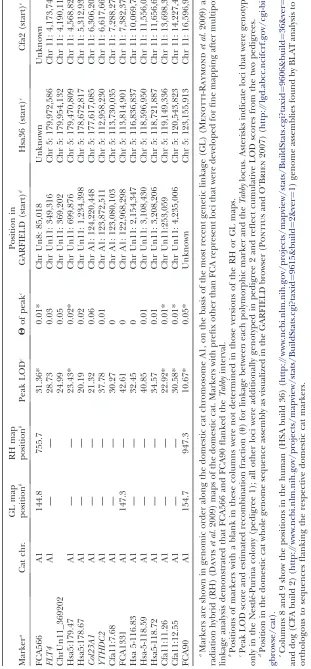
u¼0.05), and FCA1331 (LOD¼42.61,u¼0)] (Table 1).
Fine mapping ofTabbywas accomplished by developing
additional microsatellite markers for the region (see Table S1for a list of all new primers), combined with the subsequent addition of meioses from pedigree 2 (see below). This joint approach defined a genomic region of5 Mb for theTabbylocus, on the basis of conserved synteny with the human and dog genomes (Table 1). Although the domestic cat sequence assembly is not yet complete in this region, the current radiation hybrid
(RH) map (Daviset al.2009) shows that this genomic
segment is well defined and exhibits conserved synteny to human chromosome 5 (113.0–118.6 Mb) and dog chromosome 11 (6.6–11.5 Mb).
The parental crosses of pedigree 2 (spotted vs.
blotched phenotypes) yielded seven F1individuals, none
of which were fully spotted, but rather exhibiting inter-mediate patterns between spotted and mackerel (i.e., they would be considered to be ‘‘broken mackerel,’’ due to a mixture of spots and broken stripes; Figure 3).
These F1 individuals were backcrossed to nine tester
blotched cats, producing a third-generation progeny of 39 animals, 35 of which could be confidently
pheno-typed (Figure S1). These backcross offspring conformed
to a 1:1 ratio of blotched (n¼19) to nonblotched (n¼
16) pattern, supporting an allelic relationship at the Tabby locus. However, the nonblotched animals ex-hibited a full range from spotted to striped phenotypes, including individuals that could be fully categorized as mackerel (see Figure 3). Since the mackerel form was not present in any of the original crosses, this result demonstrates that it was represented by the spotted in-dividuals, modified by the epistatic action of other genes. The segregation we observed was therefore between the
two common alleles at theTabbylocus, TMand tb, with
the former originally masked as the spotted phenotype by modifier loci. Given these findings, we added the
meioses from this pedigree to the analysis of theTabby
locus (TM and tb), described above, to refine the
mapping of its genomic position (Table 1).
In the case of pedigree 3 (Figure S2), the two male
founders (F1individuals) were backcrossed to multiple
non-Abyssinian females, producing a total of 85 off-spring, 73 of which could be phenotyped with confi-dence (the remaining 12 were stillborn and did not allow for reliable recognition of coat color features). These third-generation individuals exhibited an almost
perfect 1:1 ratio of Tacarriers (n¼36)vs.noncarriers
(mackerel or blotched) (n ¼ 37), in accordance to
Mendelian expectations for a single locus. To verify whether this segregation in pedigree 3 occurred at the
same locus as the TMand tballeles mentioned above, we
initially genotyped the members of this kindred for six
microsatellites linked to the Tabby locus (mapped to
chromosome A1 using pedigrees 1 and 2, see Table 1), as well as three additional markers in the same region of chromosome A1. The results from this experiment
excluded this chromosomal segment, refutingTabbyas
the implicated locus in the Tavariant (Table S2).
This finding indicated that the Abyssinian phenotype
is not coded by an allele ofTabby, but rather by a separate
genetic locus, which we henceforth call Ticked. Before
initiating a whole genome scan for this locus, we pro-ceeded to genotype three microsatellites in a candidate region linked to ‘‘brindling’’ (the ‘‘K’’ locus) in dogs
(G. S. Barsh, personal communication; Candilleet al.
2007; Kernset al.2007), as this canine variant might be
homologous to some aspect of the cat pelage pattern-ing. Microsatellites were selected for a region on cat chromosome B1 with conserved synteny to the
brindl-ing locus, at 34.8 Mb on dog chromosome 19 (Candille
et al.2007; Kernset al.2007). AlthoughTicked
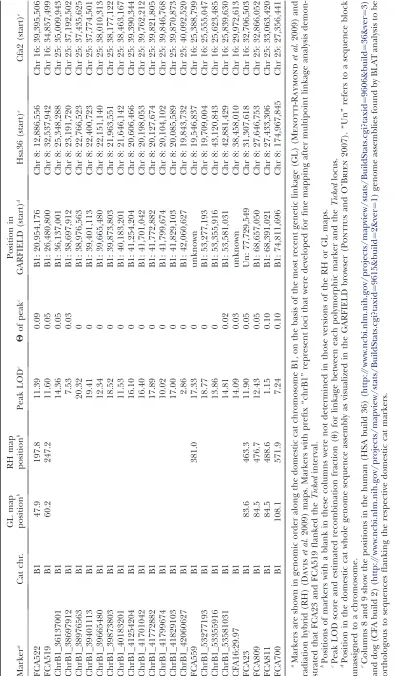
demon-strated significant linkage to the K region [markers
FCA522 (LOD¼11.4,u¼0.09) and FCA519 (LOD¼
11.6, u ¼0.05)], recombination between the markers
and this trait was demonstrated within this genomic segment of cat chromosome B1 (Table 2). Although this result indicated that the dog brindling and cat ticked coat color variants were not caused by the same gene, this initial finding allowed us to restrict all further marker development and genotyping to chromosome B1. Additional markers were thus designed to identify
a region of zero recombination withTicked(see
materi-als and methods). The genomic region forTickedwas
ultimately defined as a segment of3.8 Mb, with
con-served synteny to Hsa 8: 23–19.7, 43.1–42.9 Mb. This
region is equivalent to that reported by Lyons et al.
(2006) as linked to the Tabbylocus. The defined
seg-ment occurs within a region showing an intrachromo-somal break in synteny between cat and human, and an interchromosomal break between cat and dog (Table 2).
DISCUSSION
The results presented here indicate that there are at least three different loci determining the pattern of coat
markings in the domestic cat: (1) theTabbylocus (for
which we propose the symbol ‘‘Ta’’), mapped to
chro-mosome A1 and containing allelesTaMandtab(mackerel/
blotched); (2) one or more modifier loci that create a spotted coat by altering the mackerel stripes and that possibly also influence variation in the blotched pattern;
and (3) the Ticked locus (for which we propose the
symbol ‘‘Ti’’), mapping to chromosome B1 and
contain-ing alleles TiA
(Abyssinian) and Ti1
(non-Abyssinian).
The TiA
allele is semidominant and has an epistatic
effect on the expression ofTabbyand its shape-altering
Since our results seem to be discrepant with those
presented by Lyons et al. (2006), who reported the
mapping of Tabby to the same location that we have
defined as theTickedlocus, we offer the following
clari-fication. Lyons et al.(2006) mappedTabby under the
assumption that a single locus was responsible for all coat pattern phenotypes in the domestic cat. Their uti-lization of a single pedigree that segregated for all but four meiotic events for the ticked phenotype identified the B1 locus that we report here to be responsible for
the alleles TiA
(Abyssinian) and Ti1
(non-Abyssinian),
and have elected to call theTickedlocus. The results of
the two studies are therefore congruent, but we show that two different genetic loci are implicated in this particular set of coat patterning variants. In this context,
we point out that the name Tabby should be applied
to the locus on A1, which specifies the mackerel and blotched alleles, as these phenotypes are classically
iden-tified with theTabbylocus.
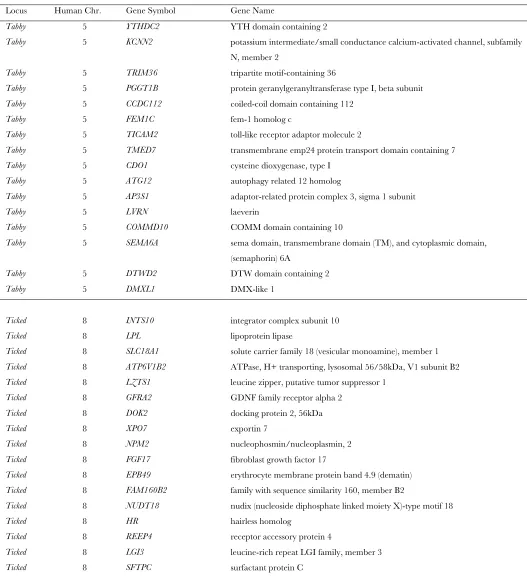
In Table S3, we list all the human genes (human genome build 36.3) located in the syntenic segments
corresponding to theTabbyandTickedlinkage intervals.
For the case of Tabby, we noted that the interval
in-cludes the geneAP3S1, which may be a good candidate
since the AP3 complex transports pigment and the gene AP3B1, encoding another protein in this com-plex, is mutated in the hypopigmentation-inducing
Hermansky-Pudlak syndrome type 2 (Dell’Angelica
et al.1997). Another possible candidate gene forTabby, TYRP1, is involved in dog coat color phenotypes
(Schmutz et al. 2002; Cargillet al. 2005) and maps
to dog chromosome 11, 20 Mb distal from the conserved syntenic canine interval identified in Table 1. However,
in the domestic catTYRP1 has been mapped to
chro-mosome D4, and is associated withbrownandcinnamon
coat color phenotypes (Lyons et al. 2005; Schmidt
-Ku¨ ntzelet al. 2005), and not to patterning traits such
asTabby. Even though the actual genes corresponding to Tabby and Ticked have not been identified at the molecular level, the clarification that multiple loci are involved and the delimitation of two implicated regions enable the design of detailed studies targeting the
iden-tification and characterization of these loci and their functions.
We hypothesize that mammalian patterned coats are formed by two distinct processes: (i) a spatially oriented developmental mechanism that lays down a species-specific pattern of skin cell differentiation; and (ii) a pigmentation-oriented mechanism that uses informa-tion from the preestablished pattern to regulate the synthesis of particular melanin profiles. Our results, in combination with phenotype-based observations,
indi-cate that theTabbylocus is involved in establishing the
shape of the pattern (process ‘‘i’’ above), and so are the
modifier loci that produce a spotted coat. The Ticked
locus may control process ‘‘ii’’ defined above, i.e., the
coupling between pigmentation pathways and the
preexisting pattern laid down byTabby, so that variants
may exhibit differing amounts of pigmentation on the coat areas destined to be spots or stripes. As an
alter-native hypothesis, however, theTickedlocus may also be
involved in process i, affecting the shape of markings, by leading to progressively thinner and more numerous stripes that lead them to ‘‘disappear’’ amid the agouti banding of individual hairs. This idea fits the observa-tion of very thin but discernible flank stripes in
hetero-zygous animals TiA/Ti1
.
The logic behind this two-step process stems from observations such as the following: (a) coat patterns are species specific, with instances of intraspecific poly-morphism that also seem to be heritable; (b) many variants affect the spatial conformation of the pattern (process i), but do not seem to affect the mechanism that ‘‘reads’’ this pattern to promote differential pig-mentation (process ii) (e.g., the case of the domestic cat mackerel and blotched variants); (c) conversely, there are variants that affect pigmentation pathways (e.g.,
X-linkedOrangein domestic cats; Schmidt-Ku¨ ntzelet al.
2009; melanism in several species) but do not change the underlying pattern, which remains constant and often visible in a different color; (d) the instructions to produce darker pigment on stripes/spots overrides the dorsal-ventral patterning often seen on mammalian coats (e.g., the black stripes present on the whitish tiger
TABLE 3
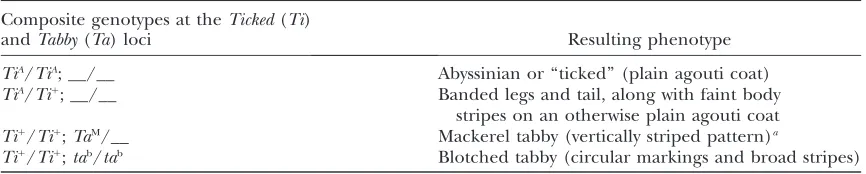
Summary of dominance and epistasis relationships leading to genotype–phenotype correspondence at the domestic cat pattern-forming lociTickedandTabby(see text for details)
Composite genotypes at theTicked(Ti)
andTabby(Ta) loci Resulting phenotype
TiA/TiA; __/__ Abyssinian or ‘‘ticked’’ (plain agouti coat)
TiA/Ti1
; __/__ Banded legs and tail, along with faint body
stripes on an otherwise plain agouti coat Ti1/
Ti1;
TaM/__ Mackerel tabby (vertically striped pattern)a
Ti1 /Ti1
;tab/tab Blotched tabby (circular markings and broad stripes)
a
ventrum); and (e) two felids [lion (Panthera leo) and puma (Puma concolor)] exhibit a developmentally regulated fading of body markings, which are present in juveniles and essentially disappear in adults. The latter observa-tion suggests that it is process ii that is developmentally regulated, gradually decoupling the pigmentation path-ways from the underlying pattern (which was evidently formed in the juvenile). Many such comparisons are possible within and among the extant 37 felid species, highlighting the potential of this mammalian family as a model for investigating the evolutionary genetics of coat pattern formation. Although the understanding of the molecular basis of this phenomenon is still in its infancy, we propose that comparative genetic analyses of the domestic cat and its wild relatives hold promise for unraveling these complex and potentially revealing developmental pathways for mammals in general.
We thank Audrey Law for making available the male Egyptian Mau cat used as the founder of pedigree 2, as well as Lyn Colenda and Kevin J. Cogan at the National Institutes of Health Animal Center for their efforts in maintaining and managing pedigrees 2 and 3. We thank the Nestle´ Purina PetCare Center and personnel for providing us with samples of DNA, as well as assistance in phenotyping the cats from pedigree 1. We thank Marti Welch, Advanced Technology Program, SAIC, Frederick, MD, for assistance in taking photographs. We additionally thank the Frederick County Animal Control Center, Frederick, MD, which allowed us to take photographs of a mackerel cat. David Wells, Ali Wilkerson, Jan Martenson, and William Murphy assisted with various aspects of project design and execution. This research was supported in part by the Intramural Research Program of the National Institutes of Health (NIH), National Cancer Institute (NCI), and National Library of Medicine. This project has been funded in whole or in part with federal funds from the NCI and NIH under contract N01-CO-12400. The content of this publication does not necessarily reflect the views or policies of the Department of Health and Human Services, nor does mention of trade names, commercial products, or organizations imply endorsement by the United States government.
LITERATURE CITED
Boutin-Ganache, I., M. Raposo, M. Raymondand C. F. Deschepper,
2001 M13-tailed primers improve the readability and usability of microsatellite analyses performed with two different allele-siz-ing methods. Biotechniques31:24–26, 28.
Candille, S. I., C. B. Kaelin, B. M. Cattanach, B. Yu, D. A. Thompson
et al., 2007 AB-defensinmutation causes black coat color in do-mestic dogs. Science318:1418–1423.
Cargill, E. J., T. R. Famula, R. D. Schnabel, G. M. Strainand K. E.
Murphy, 2005 The color of a Dalmatian’s spots: linkage
evi-dence to support theTYRP1gene. BMC Vet. Res.1:1. Cott, H. B., 1940 Adaptive Coloration in Animals.Methuen, London.
Davis, B. W., T. Raudsepp, A. J. PearksWilkerson, R. Agarwala,
A. A. Scha¨ fferet al., 2009 A high-resolution cat radiation
hy-brid and integrated FISH mapping resource for phylogenomic studies across Felidae. Genomics93:299–304.
Dell’Angelica, E. C., C. E. Ooiand J. S. Bonifacino, 1997 b
3A-adaptin, a subunit of the adaptor-like complex AP-3. J. Biol. Chem.272:15078–15084.
Eizirik, E., N. Yuhki, W. E. Johnson, M. Menotti-Raymond, S. S.
Hannahet al., 2003 Molecular genetics and evolution of
mela-nism in the cat family. Curr. Biol.13:1–20.
Fishelson, M., and D. Geiger, 2002 Exact genetic linkage
compu-tations for general pedigrees. Bioinformatics18(Suppl 1): S189– S198.
Fishelson, M., and D. Geiger, 2004 Optimizing exact genetic
link-age computations. J. Comput. Biol.11:263–275.
Gompel, N., B. Prud’homme, P. J. Wittkopp, V. A. Kassnerand S. B.
Carroll, 2005 Chance caught on the wing:cis-regulatory
evo-lution and the origin of pigment patterns in Drosophila. Nature
433:481–487.
Ishida, Y., V. A. David, E. Eizirik, A. A. Scha¨ ffer, B. A. Neelamet al.,
2006 A homozygous single-base deletion inMLPHcauses the dilutecoat color phenotype in the domestic cat. Genomics88:
698–705.
Iwashita, M., M. Watanabe, M. Ishii, T. Chen, S. L. Johnsonet al.,
2006 Pigment pattern injaguar/obelixzebrafish is caused by a Kir7.1mutation: implications for the regulation of melanosome movement. PLoS Genet.2:1861–1870.
Joron, M., C. D. Jiggins, A. Papanicolaouand W. O. McMillan,
2006a Heliconiuswing patterns: an evo-devo model for under-standing phenotypic diversity. Heredity97:157–167.
Joron, M., R. Papa, M. Beltra´ n, N. Chamberlain, J. Mava´ rezet al.,
2006b A conserved supergene locus controls colour pattern di-versity inHeliconiusbutterflies. PLoS Biol.4:1831–1840. Kehler, J. S., V. A. David, A. A. Scha¨ ffer, E. Eizirik, D. K. Ryugo
et al., 2007 Four separate mutations in the feline Fibroblast Growth Factor5 gene determine the long-haired phenotype in do-mestic cats. J. Hered.98:555–566.
Kerns, J. A., E. J. Cargill, L. A. Clark, S. I. Candille, T. G. Berryere
et al., 2007 Linkage and segregation analysis of black and brin-dle coat color in domestic dogs. Genetics176:1679–1689. Lomax, T. D., and R. Robinson, 1988 Tabby pattern alleles of the
domestic cat. J. Hered.79:21–23.
Lorimer, H. E., 1995 Variations on the theme or how to paint a cat,
pp. 193–200 inThe Cat Fanciers’ Association, Inc. Yearbook. The Cat Fanciers’ Association, Inc., Manasquan, NJ.
Lyons, L. A., I. T. Foe, H. C. Rahand R. A. Grahn, 2005 Chocolate
coated cats:TYRP1mutations for brown color in domestic cats. Mamm. Genome16:356–366.
Lyons, L. A., S. J. Bailey, K. C. Baysac, G. Byrns, C. A. Erdmanet al.,
2006 TheTabbycat locus maps to feline chromosome B1. Anim. Genet.37:383–386.
Menotti-Raymond, M., V. A. David, M. E. Roelke, Z. Q. Chen, K. A.
Menotti et al., 2003 Second-generation integrated genetic
linkage/radiation hybrid maps of the domestic cat (Felis catus). J. Hered.94:95–106.
Menotti-Raymond, M., V. A. David, A. A. Scha¨ ffer, R. Stephens,
D. Wells et al., 2007 Mutation in CEP290 discovered for
cat model of human retinal degeneration. J Hered98:211– 220.
Menotti-Raymond, M., V. A. David, A. A. Scha¨ ffer, J. F. Tomlin,
E. Eizirik et al., 2009 An autosomal genetic linkage map of
the domestic cat,Felis silvestris catus.Genomics93:305–313. Menotti-Raymond, M. A., V. A. David, L. L. Wachter, J. M. Butler
and S. J. O’Brien, 2005 An STR forensic typing system for
ge-netic individualization of domestic cat (Felis catus) samples. J. Forensic Sci.50:1061–1070.
Murphy, W. J., B. Davis, V. A. David, R. Agarwala, A. A. Scha¨ ffer
et al., 2007 A 1.5-Mb-resolution radiation hybrid map of the cat genome and comparative analysis with the canine and human genomes. Genomics89:189–196.
Murray, J. D., and G. F. Oster, 1984 Generation of biological
pat-tern and form. IMA J. Math. Appl. Med. Biol.1:51–75. Ortolani, A., and T. M. Caro, 1996 The adaptive significance
of color patterns in carnivores: phylogenetic test of classic hypotheses, pp. 132–188 inCarnivore Behavior, Ecology and Evo-lution, edited by J. L. Gittleman. Cornell University Press,
New York.
Oyehaug, L., E. Plahte, D. I. Vageand S. W. Omholt, 2002 The
regulatory basis of melanogenic switching. J. Theor. Biol.215:
449–468.
Parchem, R. J., M. W. Perryand N. H. Patel, 2007 Patterns on the
insect wing. Curr. Opin. Genet. Dev.17:300–308.
Pontius, J. U., J. C. Mullikin, D. R. Smith, A. S. Team, K. Lindblad
-Tohet al., 2007 Initial sequence and comparative analysis of the
cat genome. Genome Res.17:1675–1689.
Pontius, J. U., and S. J. O’Brien, 2007 Genome Annotation
Prud’homme, B., N. Gompel, A. Rokas, V. A. Kassner, T. M.
Williamset al., 2006 Repeated morphological evolution through
cis-regulatory changes in a pleiotropic gene. Nature440:1050–1053. Robinson, R., 1958 Mosaicism in mammals. Genetica29:120–145.
Rozen, S., and H. Skaletsky, 2000 Primer3 on the WWW for
gen-eral users and for biologist programmers. Methods Mol. Biol.
132:365–386.
Schmidt-Ku¨ ntzel, A., E. Eizirik, S. J. O’Brienand M. Menotti
-Raymond, 2005 Tyrosinaseandtyrosinase related protein 1alleles
specify domestic cat coat color phenotypes of thealbinoandbrown loci. J. Hered.96:289–301.
Schmidt-Ku¨ ntzel, A., G. Nelson, V. A. David, A. A. Scha¨ ffer, E.
Eizirik et al., 2009 A domestic cat X-chromosome linkage
map and the sex-linkedorangelocus- mapping oforange, multiple origins, and epistasis overnon-agouti.Genetics181:1415–1425. Schmutz, S. M., T. G. Berryereand A. D. Goldfinch, 2002 TYRP1
and MC1R genotypes and their effects on coat color in dogs. Mamm. Genome13:380–387.
Schug, M. D., C. M. Hutter, K. A. Wetterstrand, M. S. Gaudette,
T. F. Mackayet al., 1998 The mutation rates of di-, tri- and
tetranucleotide repeats in Drosophila melanogaster. Mol. Biol. Evol.15:1751–1760.
Searle, A. G., 1968 Comparative Genetics of Coat Color in Mammals.
Logos Press, London.
Svetic, V., G. E. Hollway, S. Elworthy, T. R. Chipperfield,
C. Davisonet al., 2007 Sdf1apatterns zebrafish melanophores
and links the somite and melanophore pattern defects in choker mutants. Development134:1011–1022.
Watanabe, M., M. Iwashita, M. Ishii, Y. Kurachi, A. Kawakami
et al., 2006 Spot pattern ofleopard Daniois caused by muta-tion in the zebrafishconnexin41.8gene. EMBO Rep.7:893– 897.
Supporting Information
http://www.genetics.org/cgi/content/full/genetics.109.109629/DC1
Defining and Mapping Mammalian Coat Pattern Genes: Multiple
Genomic Regions Implicated in Domestic Cat Stripes and Spots
Eduardo Eizirik, Victor A. David, Valerie Buckley-Beason, Melody E. Roelke,
Alejandro A. Schäffer, Steven S. Hannah, Kristina Narfström, Stephen J. O'Brien
and Marilyn Menotti-Raymond
E. Eizirik et al.
2 SI
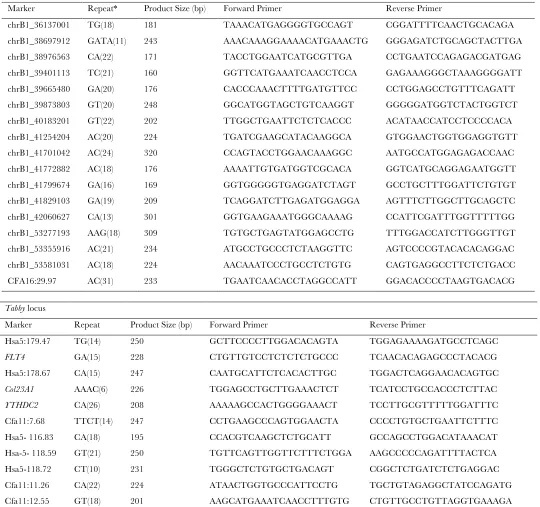
TABLE S1
Primers used for fine-mapping of the Ticked and Tabby loci
Ticked locus Marker Repeat* Product Size (bp) Forward Primer Reverse Primer
chrB1_36137001 TG(18) 181 TAAACATGAGGGGTGCCAGT CGGATTTTCAACTGCACAGA
chrB1_38697912 GATA(11) 243 AAACAAAGGAAAACATGAAACTG GGGAGATCTGCAGCTACTTGA chrB1_38976563 CA(22) 171 TACCTGGAATCATGCGTTGA CCTGAATCCAGAGACGATGAG chrB1_39401113 TC(21) 160 GGTTCATGAAATCAACCTCCA GAGAAAGGGCTAAAGGGGATT
chrB1_39665480 GA(20) 176 CACCCAAACTTTTGATGTTCC CCTGGAGCCTGTTTCAGATT chrB1_39873803 GT(20) 248 GGCATGGTAGCTGTCAAGGT GGGGGATGGTCTACTGGTCT chrB1_40183201 GT(22) 202 TTGGCTGAATTCTCTCACCC ACATAACCATCCTCCCCACA
chrB1_41254204 AC(20) 224 TGATCGAAGCATACAAGGCA GTGGAACTGGTGGAGGTGTT chrB1_41701042 AC(24) 320 CCAGTACCTGGAACAAAGGC AATGCCATGGAGAGACCAAC chrB1_41772882 AC(18) 176 AAAATTGTGATGGTCGCACA GGTCATGCAGGAGAATGGTT
chrB1_41799674 GA(16) 169 GGTGGGGGTGAGGATCTAGT GCCTGCTTTGGATTCTGTGT chrB1_41829103 GA(19) 209 TCAGGATCTTGAGATGGAGGA AGTTTCTTGGCTTGCAGCTC chrB1_42060627 CA(13) 301 GGTGAAGAAATGGGCAAAAG CCATTCGATTTGGTTTTTGG
chrB1_53277193 AAG(18) 309 TGTGCTGAGTATGGAGCCTG TTTGGACCATCTTGGGTTGT chrB1_53355916 AC(21) 234 ATGCCTGCCCTCTAAGGTTC AGTCCCCGTACACACAGGAC chrB1_53581031 AC(18) 224 AACAAATCCCTGCCTCTGTG CAGTGAGGCCTTCTCTGACC
CFA16:29.97 AC(31) 233 TGAATCAACACCTAGGCCATT GGACACCCCTAAGTGACACG
Tabby locus
Marker Repeat Product Size (bp) Forward Primer Reverse Primer
Hsa5:179.47 TG(14) 250 GCTTCCCCTTGGACACAGTA TGGAGAAAAGATGCCTCAGC
FLT4 GA(15) 228 CTGTTGTCCTCTCTCTGCCC TCAACACAGAGCCCTACACG
Hsa5:178.67 CA(15) 247 CAATGCATTCTCACACTTGC TGGACTCAGGAACACAGTGC
Col23A1 AAAC(6) 226 TGGAGCCTGCTTGAAACTCT TCATCCTGCCACCCTCTTAC
YTHDC2 CA(26) 208 AAAAAGCCACTGGGGAAACT TCCTTGCGTTTTTGGATTTC
Cfa11:7.68 TTCT(14) 247 CCTGAAGCCCAGTGGAACTA CCCCTGTGCTGAATTCTTTC Hsa5- 116.83 CA(18) 195 CCACGTCAAGCTCTGCATT GCCAGCCTGGACATAAACAT Hsa-5- 118.59 GT(21) 250 TGTTCAGTTGGTTCTTTCTGGA AAGCCCCCAGATTTTACTCA Hsa5-118.72 CT(10) 231 TGGGCTCTGTGCTGACAGT CGGCTCTGATCTCTGAGGAC Cfa11:11.26 CA(22) 224 ATAACTGGTGCCCATTCCTG TGCTGTAGAGGCTATCCAGATG Cfa11:12.55 GT(18) 201 AAGCATGAAATCAACCTTTGTG CTGTTGCCTGTTAGGTGAAAGA
E. Eizirik et al. 3 SI
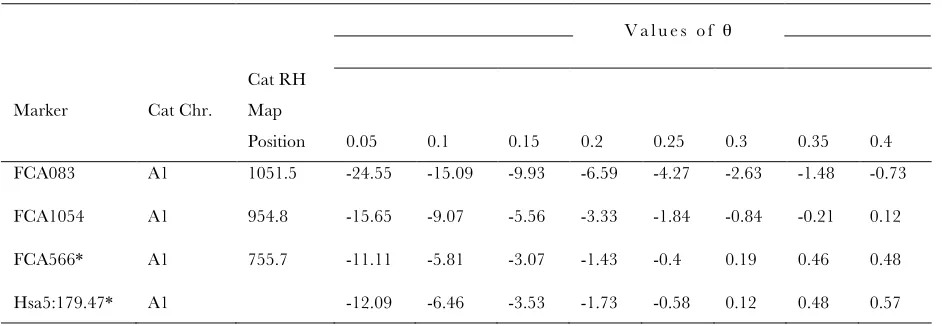
TABLE S2
Exclusion mapping of the Ticked locus to the Tabby genomic region
V a l u e s o f θ
Marker Cat Chr.
Cat RH Map
Position 0.05 0.1 0.15 0.2 0.25 0.3 0.35 0.4 FCA083 A1 1051.5 -24.55 -15.09 -9.93 -6.59 -4.27 -2.63 -1.48 -0.73
FCA1054 A1 954.8 -15.65 -9.07 -5.56 -3.33 -1.84 -0.84 -0.21 0.12
FCA566* A1 755.7 -11.11 -5.81 -3.07 -1.43 -0.4 0.19 0.46 0.48
Hsa5:179.47* A1 -12.09 -6.46 -3.53 -1.73 -0.58 0.12 0.48 0.57
* With demonstrated linkage to the Tabby locus (see Table 1)
Note: LOD scores obtained from genomic mapping of Ticked pedigree to markers with demonstrated linkage to the Tabby region (see Table 1). The marker with prefix “Hsa” was developed for fine mapping of the Tabby locus (Table 1) and was not mapped in the cat RH map [DAVIS et al. 2009]. LOD scores are presented for multiple values of recombination fraction (θ) with respect to the Ticked
E. Eizirik et al.
4 SI
TABLE S3
Human genes from genome build 36.3 that may be located in the segments syntenic to the linkage intervals for the Tabby and
Ticked loci.
Locus Human Chr. Gene Symbol Gene Name
Tabby 5 YTHDC2 YTH domain containing 2
Tabby 5 KCNN2 potassium intermediate/small conductance calcium-activated channel, subfamily N, member 2
Tabby 5 TRIM36 tripartite motif-containing 36
Tabby 5 PGGT1B protein geranylgeranyltransferase type I, beta subunit
Tabby 5 CCDC112 coiled-coil domain containing 112
Tabby 5 FEM1C fem-1 homolog c
Tabby 5 TICAM2 toll-like receptor adaptor molecule 2
Tabby 5 TMED7 transmembrane emp24 protein transport domain containing 7
Tabby 5 CDO1 cysteine dioxygenase, type I
Tabby 5 ATG12 autophagy related 12 homolog
Tabby 5 AP3S1 adaptor-related protein complex 3, sigma 1 subunit
Tabby 5 LVRN laeverin
Tabby 5 COMMD10 COMM domain containing 10
Tabby 5 SEMA6A sema domain, transmembrane domain (TM), and cytoplasmic domain, (semaphorin) 6A
Tabby 5 DTWD2 DTW domain containing 2
Tabby 5 DMXL1 DMX-like 1
Ticked 8 INTS10 integrator complex subunit 10
Ticked 8 LPL lipoprotein lipase
Ticked 8 SLC18A1 solute carrier family 18 (vesicular monoamine), member 1
Ticked 8 ATP6V1B2 ATPase, H+ transporting, lysosomal 56/58kDa, V1 subunit B2
Ticked 8 LZTS1 leucine zipper, putative tumor suppressor 1
Ticked 8 GFRA2 GDNF family receptor alpha 2
Ticked 8 DOK2 docking protein 2, 56kDa
Ticked 8 XPO7 exportin 7
Ticked 8 NPM2 nucleophosmin/nucleoplasmin, 2
Ticked 8 FGF17 fibroblast growth factor 17
Ticked 8 EPB49 erythrocyte membrane protein band 4.9 (dematin)
Ticked 8 FAM160B2 family with sequence similarity 160, member B2
Ticked 8 NUDT18 nudix (nucleoside diphosphate linked moiety X)-type motif 18
Ticked 8 HR hairless homolog
Ticked 8 REEP4 receptor accessory protein 4
Ticked 8 LGI3 leucine-rich repeat LGI family, member 3
E. Eizirik et al. 5 SI
Ticked 8 BMP1 bone morphogenetic protein 1
Ticked 8 PHYHIP phytanoyl-CoA 2-hydroxylase interacting protein
Ticked 8 MIRN320A microRNA 320a
Ticked 8 POLR3D polymerase (RNA) III (DNA directed) polypeptide D, 44kDa
Ticked 8 PIWIL2 piwi-like 2
Ticked 8 SLC39A14 solute carrier family 39 (zinc transporter), member 14
Ticked 8 PPP3CC protein phosphatase 3 (formerly 2B), catalytic subunit, gamma isoform
Ticked 8 SORBS3 sorbin and SH3 domain containing 3
Ticked 8 PDLIM2 PDZ and LIM domain 2 (mystique)
Ticked 8 KIAA1967 KIAA1967
Ticked 8 BIN3 bridging integrator 3
Ticked 8 EGR3 early growth response 3
Ticked 8 PEBP4 phosphatidylethanolamine-binding protein 4
Ticked 8 RHOBTB2 Rho-related BTB domain containing 2
Ticked 8 TNFRSF10B tumor necrosis factor receptor superfamily, member 10b
Ticked 8 TNFRSF10C tumor necrosis factor receptor superfamily, member 10c
Ticked 8 TNFRSF10D tumor necrosis factor receptor superfamily, member 10d
Ticked 8 TNFRSF10A tumor necrosis factor receptor superfamily, member 10a
Ticked 8 CHMP7 CHMP family, member 7
Ticked 8 HOOK3 hook homolog 3
Ticked 8 FNTA farnesyltransferase, CAAX box, alpha
Ticked 8 SGK196 protein kinase-like protein SgK196
E. Eizirik et al.
6 SI
!"#$ !"#% !"#& !"## !"%' "''!
!'%" #'(
!"&% !"#( !"#' !"#) !'%)
!"#" !"#* !"#!
)"&" )%%& !()! !()* !()$
)%$# !'%" )"&"
!"%*
)%#(
!()&
%(*
!("' !()# !()%
!!'* #'( !'%)
!!') !"%& !"%# !"%% !!'' !!'(
!*($ !*(! !*(& !*(# !*(" !*(*
!"&& !"&#
!*'%
!'&% !'#! !'#* !'#' !'#( !'#) !'#"
FIGURE S1.—Graphic depiction of Pedigree 2, developed for this study to map the domestic cat ‘spotted’ coat color variant. Dark symbols indicate spotted or mackerel
E. Eizirik et al. 7 SI E. Eizirik et al. 7 SI
FIGURE S2.—Graphic depiction of Pedigree 3, developed for this study to map the domestic cat ‘ticked’ or ‘Abyssinian” coat color variant. Dark areas in the symbols indicate
the presence of an Abyssinian (TiA) allele, while fully white symbols indicate non-Abyssinian phenotypes (i.e. mackerel or blotched). Individuals bearing both colors indicate inferred