Modal Vibration Response Behavior of Multi-span Tube Array with Two Different
Support Designs.
Karl H. Haslinger, Westinghouse Electric Company, 2000 Day Hill Road Windsor, CT 06095 USA
A B S T R A C T
The design of improved Replacement Steam Generators (RSGs) for Nuclear Power Plants calls for new style tube supports (ATSG) that need further investigation in regard to their dynamic performance when compared with standard type tube supports. For this purpose, a comparative steam generator tube vibration test was performed on a five-span, seven-tube bundle array using mechanical, base excitation as vibration input. These tests were similar to those performed in the early
1970 on the original Westinghouse CENP System 80 tube bundle/support designs.
The testing was confined to air environment since the effect of water would be similar for both support types and had already been quantified in previous tests. The tube support geometry simulated the lower five (5) support spans of a Westinghouse, Model 51 Replacement Steam Generator. The majority of testing was performed with 1-G excitation introduced into the tube bundle indirectly at the tubesheet. The sine sweep test cycles ranged from 20 to 240 Hertz. Additional sensitivity testing was conducted to characterize the modal tube response behavior as a function of excitation. The extensive testing was performed in a nearly identical manner on two tube support designs, namely the Reference Eggcrate Support design and the ATSG design. Tube response motions were mapped at up to 50 locations per tube. The frequency resPonse plots were evaluated to identify relevant response frequencies and associated mode shapes. Enlarged response plots were used to determine critical damping ratios for all response peaks with reasonably clean peak geometries. The response amplitudes and damping values were tabulated for each tube and test geometry. Mode shape plots for all significant response frequencies were generated and the critical damping ratios were graphed for each tube and for both support geometries.
I N T R O D U C T I O N
Steam generator tube corrosion mechanisms, originating in tube-to-support crevices, have been a persistent problem within the nuclear power industry (Reference 1). Therefore, it is highly beneficial to design tube supports that both minimize tube-to-support contact length (potential crevice length) and are aerodynamically resistant to sludge deposit. The Westinghouse Advanced Tube Support Grid (ATSG) is designed to minimize tube-to-support crevices and to resist sludge deposit. This structure was developed in response to increased utility requirements, contained in the Replacement Steam Generator Specification. The ATSG structure has more than twice the load-carrying capacity of a conventional grid structure, to resist seismic and Design Basis Accident loading (i.e. MSLB). In order to demonstrate that the ATSG provides the same level of tube support against vibration as a conventional grid structure, the subject modal response testing was performed. For this purpose, a comparative steam generator tube vibration test was conducted on a five-span, seven-tube bundle array using mechanical, base excitation as vibration input. The results obtained from these tests are natural frequencies, mode shapes and modal critical damping parameters for the tube bundle being supported by the two different support designs.
T E S T D E S C R I P T I O N
Tube Bundle- Tube Support Configurations
The vibration testing was performed on a seven- (7) tube steam generator tube array (approximately 5,181 nun (204 in.) long). The tubing material was Inconel 690 with 19.05 nun (0.750 in.) OD and 1.09 nun (0.043 in.) wall thickness. Two sets of tube supports were tested. One set represented a reference tube support design consisting of 25.4-mm (1-in.) and 50.8 - m m (2-in.) rectangular cross section strips, 3.56 mm (0.144 in.) thick, arranged in a diamond pattern to support the 26.99 nun (1.0625 in.) triangular pitch 19.05 mm (0.750 in.) tube pattern. The Advanced Tube Support Grid (ATSG) was composed of ferritic stainless steel "T-bars" of alternating two inch and one inch depths, intersecting at an angle of sixty degrees (strip thickness varied from 3.66 nun (0.144 in.) to 1.78 nun (0.070 in.)). Figure 1 shows the tubes intersecting one of the ATSG test supports.
Mechanical Test Setup for Vibration Testing
The approximately 5,181 nun (204 in.) long tubes were rolled into the tubesheet to simulate fixed boundary conditions. The tube supports were supported off the I-beam strongback of Westinghouse CENP's steam generator tube vibration test stand. The support spacing was established as 533.4 mm (21 in) for the lowest span, followed by four (4) consecutive 1,074.4 mm (42.3
SMiRT 16, Washington DC, August 2001 Paper # 1513
in) long spans. The five tube supports were rigidly clamped to the I-beam. The vertical positions were set + 2.5 mm (+ 0.10 in.). An optical alignment device was used to assure horizontal alignment of the supports within + 0.25 mm (+ 0.010 in.). In the vertical direction, a slip table connected to the electrodynamic shaker head supported the tube bundle. The control accelerometer was attached at the front of the tubesheet to monitor uni-axial excitation input. Three sets of bi-axial accelerometers (two principal horizontal directions) were used. For the Center Tube (No. 1), a spring-loaded biaxial accelerometer was positioned inside the tube using a push rod with an anti-rotational positioning feature. The remaining tubes were instnunented with externally mounted accelerometers that were moved from position to position for consecutive test nms.
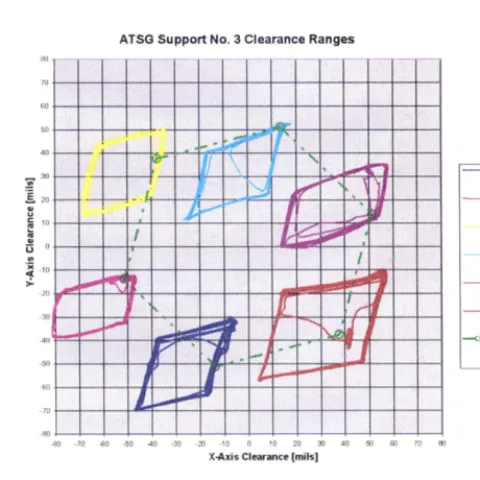
A pair of orthogonaUy mounted proximity probes was used to measure the actual clearance ranges for each tube/support penetration. The results from all accessible tubes were graphically presented in the plane of each support with respect to idealized tube center positions (steady state tube position at theoretical support center locations). A representative example case is seen in Figure 2. It is seen that clearance ranges vary and that tubes typically are resting in a comer of the trapezoidal clearance ranges. However, several tubes are seen not to be in contact with any support strip, thus providing evidence of "ineffective" support behavior.
Vibration Control and Test Instrumentation
Vibration control levels and vibration response intensities were measured using a complement of bi-axial accelerometers of different manufacture and style. A new DATRON Laser TM vibration control and analysis system was used to control constant
amplitude sinusoidal input motions at the tubesheet and to monitor the bi-axial tube responses. This control and analysis system was also used to store all vibration traces and to generate required displays in a post-processing mode.
Procedure for Vibration Testing
Initially a series of cursory sweeps were conducted to scope the natmal frequency values and the expected response amplitude levels. A test sweep rate of 0.5 Octaves/Minute and a sweep range of 20 to 240 Hertz were selected. The majority of testing was performed with an acceleration-input level of 1 G. Supplemental runs were made with 0.5 and 2 G inputs. The maximum input displacement was limited to + 0.5 mm (+ 0.020 in). The bi-axial response motions of each tube were mapped typically at 50 monitoring elevations. From the frequency sweep data, the tube span natural frequencies and associated response amplitude values were determined and tabulated for each test point in a spreadsheet. For determination of the critical damping parameters by the "half-power-point" method, all significant resonance peaks were also plotted using a linear, blown-up frequency scale.
T E S T T E S U L T S A N D D I S C U S S I O N
General
Due to the highly non-linear vibration behavior of the multi-span test tube army with gapped support conditions, the test results exhibited a considerable amount of scatter. This scatter affected resonance frequencies, modal response amplitudes and critical damping properties. The scatter is attributed to the prevailing probabilistic nature of the tube support behavior, when at the existing clearances, a tube may be preloaded against a support, may be in slight contact with the support, or actually may be centered at the support, thus promoting "double-span" response behavior. The same apparent randomness in tube response had been observed in all the previous Westinghouse CENP tests on loosely held tubes in SG tube supports. Reference 4 describes a similar test program.
Dealing with such a complex vibration behavior, especially when there are resultant variations both in frequency and in amplitude, even during consecutive sweep nms, significantly challenges data reduction techniques. Hundreds of plots were generated, and each plot needed to be evaluated individually. This process was performed on a "best effort" basis. However, this approach is justified since the results from the entire tube cluster are viewed globally and are compared for two different designs. One of these, namely the reference design, has been proven successfully in various plants for many years of operation. More precise vibro-impact testing on steam generator tubes, measuring actual impact forces, sliding distances and work rates, has been performed by the author (Reference 5). This detailed approach was not deemed appropriate for this comparison test. Furthermore, testing in air was sufficient since the effects of fluid/steam have been previously characterized for the reference support design and remain applicable.
The testing method chosen excited the tube bundle indirectly using acceleration controlled base excitation. This process is the most suitable mechanical excitation method for tube clusters and is intended to simulate cross-flow induced vibration due to entrance flow at the lowest tube support span. Axial flow induced vibration that typically applies to higher tube support spans (starting with No. 2), is not considered a major tube excitation mechanism and is dealt with as mostly stochastic, turbulence response. As the sine sweep testing method is designed to extract modal vibration characteristics, both the input and the response signals were band-pass filtered. ThercfoTe, the amplitude traces reflect only the deterministic motion components that are
associated with the frequency of excitation. The applied band-pass filtering processes eliminated any harmonic or random type of response motions that are also associated with vl'bmting, non-linear structures.
Data Reduction Methods
Bi-axial tube response motions were mapped extensively for the two support designs in a nearly identical manner. The frequency response plots were evaluated to identify relevant response frequencies and associated mode shapes. Blown-up response plots were used to determine critical damping ratios for all response peaks with reasonably clean peak geometries. The response amplitudes and damping values were tabulated for each tube and test geometry. Mode shape plots for all significant response frequencies were generated and the critical damping ratios were graphed for each tube and both support geometries.
In order to facilitate comparison of the two support designs, maximum response amplitudes of all seven tubes were summarized separately and graphed for each support and each tube span. Furthermore, the critical damping ratios for all seven tubes were plotted separately for the two support designs. The average and minimum damping data were also curve-fiRed using "Power" expressions and compared graphically.
The total structural damping values for the two test tube bundle configurations were obtained by the "Half-Power Point" method. This method is based on the response peak geometry and adopts the frequency response principles of a Single Degree of Freedom System to the shape of selected response peaks. In order to utilize this technique, the peak shape must be relatively clean and attributable to single or individual response frequencies. Unfortunately, the criteria for peak selection are not always straightforward and multiple-peak responses may be masked. Figure 5 shows applications of the Half Power Point method to several response peaks. The mathematical definition for the critical damping ratio is as follows:
C/C r = A W l (2 x f , ) x 1 O0 [%],
where Af is the bandwidth of the response peak at the half-power point (equal to 0.707 times peak amplitude) and fn is the response frequency. This relationship is known to be valid for c/c~ _< 0.1.
Typical Test Results
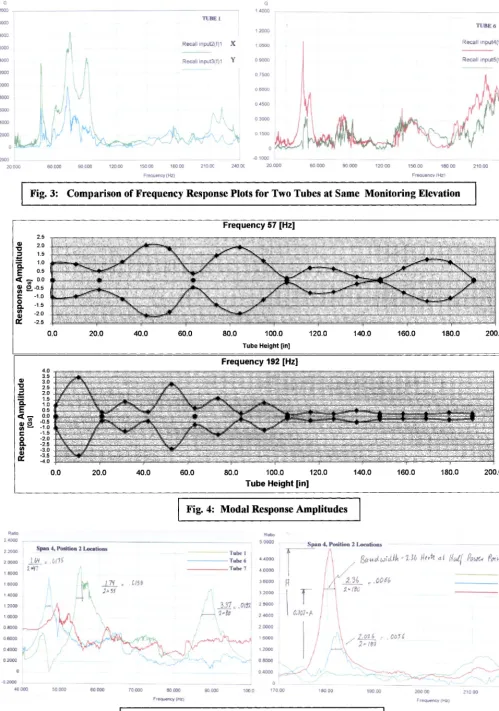
Figure 3 provides the response plots of two tubes at the same bundle elevation. Comparison of these graphs shows large variations in the tube responses, with mid-span responses peaking mostly at 45 to 95 Hertz and off-center responses peaking at
170 to 200 Hertz. However, due to double-span behavior (one particular support may be in-active), there are many mutations and some tube responses are observed as low as 22 Hertz. The response patterns typically are "elliptical" orbits.. Emphasis Was, however, placed on the interpretation and evaluation of the in-line responses.
Figure 4 shows two Tube No. 1 modal response shapes. The response amplitudes are plotted as envelopes. Nevertheless, they do allow locating of nodal points either at supports or at midspan locations. The 57-Hertz response shape is typical of the "fimdamental mode shape" for the tube geometry. The 192 Hertz response shape is typical of the "first harmonic mode shape", normally associated with "simply supported" beams.
Figure 5 shows examples of the application of the Hall-Power-Point method for the determination of modal critical damping values. The two graphs extend over very similar, lower frequency ranges and show on top the one-quarter responses at
Span No. 4 and at the bottom the mid-span responses at Span 3 of three test tubes in the X-Axis. These are identified by the colors Green, Blue and Red for respective mbe Nos. 1, 6 and 7. Of interest is that the blue response peak shows up at one elevation at 45 Hertz, and at the second elevation at 47 Hertz. Both peaks are considered reasonably clean, however derived damping values are 1.29% and 1.75% of critical. The green 46 Hertz peak was judged to be clean enough at the Span 4, Position 2 location and less so at the Span 3, Position 4 location. The green 55-Hertz peak only shows up at the center location of Span 3. Also, the green 88 Hertz peak appeared clean only at the Span 3, Position 4 location. The figure also demonstrates how certain response peaks were treated by extending the downwards slopes in order to attain "realistic" damping values by excluding the broadening effects of other, closely spaced peaks.
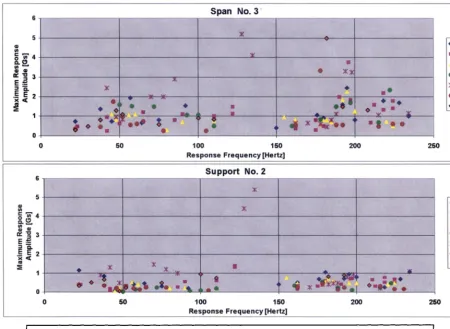
Figure 6 sunamarizes the maximum-recorded response amplitudes both at one selected support and at one selected tube span. The seven robes are identified by different color codes. While data seem to cluster between 30 to 100 and 160 to 230 Hertz, there are outliers in-between. More interesting to observe is that individual tubes respond significantly higher at certain spans and certain frequencies than do the rest. The pattern appears to be quite random.
Figure 7 summarizes the "averaged" critical damping ratios obtained for all seven tubes supported by the Reference Eggcrate design. Damping at lower frequencies tends to be higher than at higher frequencies. The scatter at frequencies from 40 to 80 Hertz is quite large. Disregarding some outliers, damping of 0.5% of critical or higheris justifiable.
The aspect of amplitude induced variations in tube response has been established based on previous testing (Reference 4). However, since the purpose of the subject test program was only to perform comparative investigations between the Reference Eggcrate and the ATSG designs, by keeping the excitation constant for all test cycles, a common deno "mmator was maintained.
Figure 1 contains the measured tube support clearance information for one of the test supports. The graph shows the free tube motion ranges for each of the six peripheral tubes. The center tube clearances could not be determined due to lack of accessibility. The motion patterns follow that of a parallelogram that defines the clearance range within the tube support. The neutral positions of each tube are identified by the small green circles, arranged for the six tubes in a hexagonal pattern according to the tubesheet/tube support center pattern. Review of the traces shows variations in clearances, and indicates that the tubes are being pushed into specific comers, or it even reveals "centered" tubes. This infommtion is useful to identify the specific support boundary conditions for a particular tube during further evaluations of its modal response behavior.
C O M P A R I O N O F R E S U L T S
In order to compare the effectiveness of the ATSG design to the Reference Eggcrate design, three evaluation criteria were applied. These were: 1. Tube Support Clearance Comparison, 2. Modal Response Amplitude Comparison, and 3. Comparison of Critical Damping Capacity.
Tube Support Clearance Comparison
As to the issue of Support Clearance, the definition of an "optimum" clearance range is unclear. A certain amount of clearance is required for fabrication reasons, larger clearances allow for more "rattling", and thus higher damping, but at the possible risk of higher fretting wear. Clearances that are too large promote double span behavior, which is also associated with lower natural frequencies that may be subject to cross flow induced fluid-elastic instability responses. As to the two support designs that are compared in this program, the actual support clearance ranges were mapped for the six peripheral tubes at each of the five support elevations. For various reasons, individual tube/grid cell measurements within the same support design differ greatly. The global results indicated that the clearance range for the ATSG design was somewhat larger than that for the Reference Eggcrate design. Some of that was attributed to the measurement technique (manual displacement of tubes).
Modal Response Amplitude Comparison
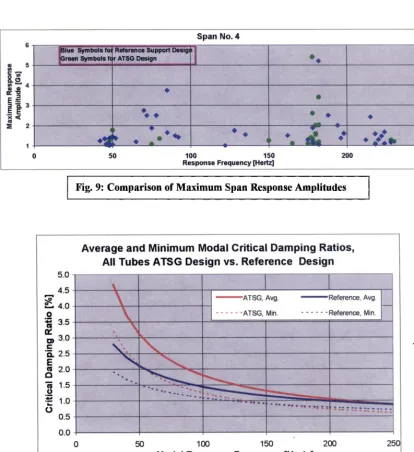
Figure 9 compares representative tube span and tube support response amplitudes for the Reference Eggcrate and the ATSG designs. Whereas it is virtually impossible to judge the amplitude behavior by comparing individual tubes, these figures nevertheless seem to suggest similar response amplitude groupings, along with the occasional "outliers".
Comparison of Critical Damping Capacity
Each set of damping data was "curve-fitted" using a "Power" expression for the regression analysis. Figure 10 summarizes the Average and the Minimum Critical Damping Ratios for all seven tubes supported by both the Reference Eggcrate design and the ATSG design. It is noted that, especially at lower frequencies (30 to 120 Hertz), the ATSG design seems to provide higher damping capacity than the Reference Eggcrate design. At higher frequencies, 150 to 250 Hertz, the damping expressions are xdmmlly identical, thus demonstrating equivalent damping capacity for the two designs.
C O N C L U S I O N S
• The tube vibration response behavior proved to be highly nonlinear. Therefore, comparisons were based on a multitude (here seven) of tubes in order to capture the large variations in tube response behavior.
• The tubes exhibit considerable variations in natural frequency values and vibration response amplitudes. The presence of the analytically predicted groups of fundamental modes and of the first harmonic modes (one node point between long supports) is clearly evident from the test data.
• The clearances at the tube supports are the source of the non-linear tube response behavior and maximum deflections can occur
at
the support elevations. This fact promotes double span behavior, resulting in lower frequencies.• The test support clearances were similar. But the ATSG clearances were slightly larger due to the reduced contact height. • Critical damping varies greatly and is higher for lower frequencies than for higher frequencies. The ATSG design has
somewhat higher damping than the Reference Eggcrate Support design.
• A comparison of the global anlplitude response behavior mapped for both support designs shows similar patterns, with the Reference Eggcrate Support design having slightly higher amplitudes.
Comparative testing between the two support designs was conducted with identical excitation, identical support alignment conditions, and identical testing methods and data interpretation techniques. When the Reference Eggcrate Support design damping data was compared to that reported nearly 25 years ago in Reference 2 superb agreement was demonstmted~, thus validating the methods and the techniques applied in these tests.
In smmnmy, while the ATSG design may result in marginally higher, effective support clearances, the vibration response behavior of the tubes supported by the two support designs was judged to be "quite similar", with the ATSG design showing somewhat
lower response levels and higher, low frequency damping values. Consequently, based on the very extensive series of
comparative tests documented in this report, the ATSG design provides comparable tube support to the Reference Eggcrate Support design.
REFERENCES
W. J. Heilker and D. F. Goetcheus, "Improved Steam Generator Tube Support Design to Minimize Sludge Accumulation and Tube Corrosion," SMIRT-16, 2001.
o Westinghouse Document TR-ESE-073/092, Rev. 00, "System 80 Steam Generator Tube Basic Vibration Tests."
° K. H. Haslinger, "Criteria for Proper Selection of Sine Sweep Test Parameters," Test Magazine, April/May 1986.
° K H. Haslinger, M. L. Martin and 1L F. Voelker, "D3amnfic Response Testing of a Single Tube and Tube Array with
Various Tube Support Geometries," presented at Joint ASME/PVP Conference, San Diego, CA, 1987.
, K. H. Haslinger, M. L. Martin and D. A. Steininger, "Pressurized Water Reactor Steam Generator Tube Wear Prediction
Utilizing Experimental Techniques," presented at International Conference on Flow Induced Vibrations, Bowness-on- Windermere, England: 12-14 May1987.
Fig. 1: SG Tubes Penetrating ATSG Support
..,,:
N
-5O -60 ~ -70
- a a
A T S G S u p p o r t No. 3 C l e a r a n c e R a n g e s
ii?i,l,i,~
~
.... ..,., ....
Tube 2 I
~ T u b e 3 I
Tube 4 I
-80 -70 -60 -50 -40 -30 -20 -I 0 0 I 0 20 313 40 50 60 70 80
X-Axis Clearance [mils]
Fig. 2: Tube to ATSG Support Clearances
G 2 2000
2 0000
1 8000
t 6000
1 40O.9 1.2000 1 0000 0 8000 0 6000 0 4000 0 2000 0
-o 2ooo L
20.000
ij R e c a l l i n p u t 2 ( f ) l
N i . . .
i ; i :~i Recall i n p u t 3 ( f ) l
!!
~ !i
i~ii :b; : , i
] " , }
i ... i
! i
60 000 90 000 120.00 150 00 180 00 210 00 240 0C
Frequency (Hz)
G
. . . 1 4000 ....
TUBE 1
TUBE 6
R e c a l l i n p u t 5 ( f ) 0
!
/i ,
, ;0 4500
0 3OOO
0 1500 I
0
-0 1000 [ . . . .
20.000 60.000 90 000 120 00 150 00 180.00 210.00 240 00
Freouencv I'Hz~
R e c a l l i n p u t 4 ( f ) 0 ~ .
Fig. 3: Comparison of Frequency Response Plots for Two Tubes at Same Monitoring Elevation
2.5
, ~ 2 . 0
~ 1.0
0.5
~ 0.0
-0.5
~ -1.0
Fr e qu e nc y 57 [Hz]
ii i
0.0 20.0 40.0 60.0 80.0 100.0 120.0 140.0 160.0 180.0 200.0
Tube Height [in]
. ~ 3.0 I ::.-:~ M~ i~:~q.;i:~::~!~;~i~
2.5 . "l!;:i~!~:~fi~'~{;
~ = I,,5
1.0 0.5
~
, o.o-o.5 ~;ii;~i; ~!:<;;i ~ i ~ ; ~ i !
- 2 . 0
- 4 . 0
4 . 0 ~ ~
3 . 5 . . . . , . . . - . . . , . - - , ~ - . . . : , . ~ . . . , - , - ,
3.0 ] ~?
2.5
F r e q u e n c y 1 9 2 [ H z ]
0.0 20.0 40.0 60.0 80.0 100.0 120.0 140.0 160.0 180.0 200.0
Tu b e H e ig ht [in]
Fig. 4: Modal Response Amplitudes
R a t i o
2 4000 . . .
2.2000 Sl)an 4, Position 2 Locations . . . Tube 1
] . ( ~ : . ~ 1 7 ~ . . . T u b e 6 4 4000 2 oooo
~ - . . . Tube 7 S 4.0000
1 8000 :'i
16ooo i i i'i',',:4 , 1.7¥ = . 615~ 3 6 o o o
; : !/~, i 2-Z~-r :"i 3.2ooo
14000 i : ~ r,\. / ~ !
1 2 o o o =,: : , : .... : , 3,37- : .01~71 2 o o o o
/ 1
1.oooo ..ff ~q ; ',... ~ :2,-~ 2 4 0 0 0
o.ooo iv" i
i oooo
0.4000 ii~, ,: ': , fff:: Y~" :' .. . . " ~ : [ ::Y' ' i 12000
0 . 2 0 0 0 L.-" , ' ' "" ---:, ': ' - ' " - ' - , .i 0.8000
o 0.4000
-0.2000 ~ . . . .
40 000 50 000 60 000
R a t i o
. . . 5,0000 . . . Span 4, Position 2 Locations
:, o66 ... - ...
I / :-,,,\ .e.o ~ : .oo~
70 000 80 000 90.000 100 0 170.00 180.00 190.00 200 00 210 00 220.00
Frequency (Hz) Frequency (Hz)
Span No. 3
'
t
I f = ... + ... , ...
0 50 100 150 200 250
Response Frequency [Hertz]
iT-2 T-3 ®T-4 XT..5 iT-6 ~T-7
6
5
~ ' 4
1
0
Support No. 2
0 50 100 150 200 250
Response Frequency [Hertz]
Fig. 6: Maximum Support and Tube Span Amplitudes for Reference Support Design
0 5 0 100 150 2 0 0 2 5 0
Modal Response Frequency [Hertz]
b£ ~1:1o 2 . 5 0 0 0
2 _ 2 5 0 0 i
2 . 0 0 0 0
I 7 ' 5 0 0 :~ ...
1 5 0 0 0 ,,,
~ o o !I ... i ...
t . ... ! ...
1 . 0 0 0 0
0 . 5 0 0 0
0 . 2 5 0 0
o . . . . . .
- 0 . ~ 0 0 0 ~.~..~ . . .
4 0 . O O O ~ O . U O U
?j}
i ... . . . . i i i . . . i ... i ... ... 0~ i
.. -i . . . ~ .. . . i . . . L . . .
I. -!- ... ~ ... ' ... ~---z! ! :
~
~
" .... . . ! . . . ~ . . . i . . . ! . . .
1 ~ o o o 1 ~o o o 1 8 o l o n 2 1 o oo
~ 0 . 0 0 0
F r e c ~ u e n c v ~ ' H z )
o~
I
S p a n N o . 4
0 50 100 150 200 250
Response Frequency [Hertz]
Fig. 9: Comparison of Maximum Span Response Amplitudes
Average and Minimum Modal Critical Damping Ratios, All Tubes ATSG Design vs, Reference Design
7 ~i! ~ ATSG, Avg ' ' Reference, Avg ~
I M . . . ATSG, Min. - . . . . Reference, Min.
0 5 0 1 0 0 1 5 0 2 0 0 2 5 0
Modal Response Frequency [Hertz]
Fig. 10: Summary of Average and Minimum Modal Critical Damping Ratios