DOI: 10.1534/genetics.110.114389
Quantitative Trait Locus Mapping of Genes Under Selection Across
Multiple Years and Sites in
Avena barbata: Epistasis, Pleiotropy,
and Genotype-by-Environment Interactions
Robert G. Latta,
1Kyle M. Gardner
2and David A. Staples
3Department of Biology, Dalhousie University, Halifax, Nova Scotia B3H 4J1, Canada Manuscript received January 20, 2010
Accepted for publication February 18, 2010
ABSTRACT
The genetic architecture of variation in evolutionary fitness determines the trajectory of adaptive change. We identified quantitative trait loci (QTL) affecting fitness in a mapping population of recom-binant inbred lines (RILs) derived from a cross between moist- and dry- associated ecotypes ofAvena barbata.We estimated fitness in 179 RILs in each of two natural environments in each of 4 years. Two loci account for over half of the variation in geometric mean fitness across environments. These loci are associated in repulsion phase in the wild ecotypes, suggesting the potential for strong transgressive segregation, but also show significant epistasis giving hybrid breakdown. This epistasis is the result of sharply lower fitness in only one of the recombinant genotypes, suggesting that the loci may contain synergistically acting mutations. Within each trial (year/site combination), we can explain less of the variation than for geometric mean fitness, but the two major loci are associated with variation in fitness in most environments. Tests for pleiotropic effects of QTL on fitness in different environments reveal that the same loci are under selection in all trials. Genotype-by-environment interactions are significant for some loci, but this reflects variation in the strength, not the direction of selection.
H
ERITABLE variation in lifetime reproductive success is the driving force of adaptation, and its genetic basis is an important determinant of the trajectory of evolution. Fisher(1930) showed that theshort-term response to selection equals the additive variance in fitness (at least, in large panmictic pop-ulations). By extension then, additive variation in fitness is expected to be removed from the population by selection (Falconer1989), and a number of studies
have shown reduced heritabilities for traits under strong selection relative to more neutral traits (Roff
and Mousseau1987). By contrast,nonadditive genetic
variation in fitness can remain in the population longer and is more likely to be present in traits related to fitness (Falconer 1989; Roff and Emerson 2006).
Nonadditive gene effects can occur either between alleles within genes (dominance) or between separate loci (epistasis), and these two processes have different evolutionary consequences. Since most selectively favored alleles appear to be dominant to disadvanta-geous alleles (Roff 1997; Lynch and Walsh 1998;
Forbeset al. 2004), dominance effects tend to increase
the fitness of more heterozygous individuals and thereby (all else being equal) select against inbreeding (Charlesworth and Charlesworth 1987; Keller
and Waller2002). Epistasis, on the other hand, tends
to disfavor distant crosses, because they disrupt ben-eficial epistatic interactions (Whitlock et al. 1995;
Barton2001) and introduce deleterious allelic
combi-nations (Dobzhansky1951; Turelliand Orr2000).
Pleiotropy, the effects of genes on multiple traits, can also have important consequences for the trajectory of adaptive evolution, because it creates the potential for trade-offs among traits (Stearns 1989, 1992;
Partridgeand Sibly 1991; Roff2002). Where
selec-tion acts to increase each of two or more traits in isolation, the negative covariance brought about by such pleiotropy presents an important limitation on evolu-tion (Lande 1982; Charnov 1989). A special case of
such trade-offs occurs when adaptation to geographi-cally separate environments is negatively correlated, such that high fitness in one habitat is associated with low fitness in others (Levene1953; Viaand Lande1987;
Joshiand Thompson1995). Where gene flow is limited,
this situation can result in local adaptation, whereby each local deme is better adapted to its habitat than are immigrants arriving from other locations (Clausen
et al. 1941; Charlesworth et al. 1997; Kawecki and
Ebert 2004). Such trade-offs are usually described in
an ANOVA framework using genotype-by-environment 1Corresponding author: Department of Biology, Dalhousie University,
1355 Oxford St., Halifax, Nova Scotia B3H 4J1, Canada. E-mail: [email protected]
2Present address:Eastern Cereal and Oilseed Research Centre,
Agricul-ture and Agri-Food Canada, 960 Carling Ave., Ottawa, Ontario K1A 0C6, Canada.
3Present address:Department of Biology, York University, 4700 Keele St.,
Toronto, Ontario M3J 1P3, Canada.
(G3E) interactions, but can easily be treated within a framework of pleiotropy and covariance (Falconer
1952; Via and Lande1987). By treating fitness in two
environments as separate, but potentially (negatively) correlated traits, local adaptation is a logical extension of theory on trade-offs.
Each of these aspects of fitness variation (additivity, dominance, epistasis, pleiotropy, and G 3 E interac-tions) is important in determining the evolutionary trajectory, but reliable information about them can be difficult to obtain in the field. Biometrical (i.e., quanti-tative genetic) approaches can be labor intensive, re-quiring large numbers of experimental crosses and estimates of fitness. By contrast, inferences from the patterns of molecular markers—although extremely popular—often depend upon many untestable assump-tions, the failure of which can lead to serious error (Luikartet al. 2003 and Nielsen2005 provide reviews).
Forty years ago in Genetics, Avena barbata (Pott ex Link), Poaceae, was one of the first species in which inferences about the genetic basis of fitness were drawn from molecular (allozyme) information (Marshall
and Allard1970). Cleggand Allard(1972) surveyed
populations of this self-pollinating annual grass from throughout California for genotype frequencies at five polymorphic allozyme loci and made two striking observations. First, of 32 possible five-locus combina-tions, only two were observed with any frequency (Allardet al. 1972), and these contained the alternate
alleles at each of the five loci (i.e., AABBCCDDEE and aabbccddee—because Avena is typically highly selfing, heterozygotes were not expected, and rarely observed). Second, these two multilocus genotypes were strongly associated with moist and dry habitats on both large [statewide (Cleggand Allard1972)] and small spatial
scales (Hamrick and Allard 1972; Hamrick and
Holden1979). This pattern led to the hypothesis that
fitness in A. barbata was strongly influenced by co-adapted gene complexes that showed local adaptation to moist and dry soil conditions, and the two genotypes became known as the ‘‘mesic’’ and ‘‘xeric’’ ecotypes (Allardet al. 1972).
A. barbata has been widely cited as an example of ecotypic divergence (e.g., Grant 1981; Avise 1994;
Linhart and Grant 1996; Cox 2004), but this
inter-pretation has not been without critics. For example, Lewontin(1974) questioned Marshalland Allard’s
(1970) contention that it was the allozymes per se that were under selection, while Hedrick and Holden
(1979) questioned whether the multilocus combinations were maintained by selection rather than by the limited opportunities for recombination in a highly inbreeding species such as Avena. The inference of divergent selec-tion was based almost entirely on the allozyme patterns, and early reciprocal transplant experiments either were limited in size ( Jainand Rai1980) or failed to reveal local
adaptation (Hutchinson1982).
A. barbata presents an excellent system in which to study the genetic basis of fitness variation directly. Its annual life cycle makes it possible to monitor individuals throughout their entire lifetime.A. barbataproduces two single-seeded florets in each spikelet (Marshall and
Jain1969), and the glumes subtending the spikelet are
retained on the plant after seeds drop, making it possible to assess lifetime reproductive success of each individual with a simple count. The high (98%) selfing rate means that this count includes male as well as female reproductive success, and the sedentary nature of plants makes it possible to expose numerous individuals to na-tural field conditions under which selection can occur.
Recently, we have undertaken extensive common garden studies of the fitness ofA. barbataecotypes and of recombinant inbred lines made from a cross be-tween them (Lattaet al. 2007). Latta(2009) analyzed
4 years of field data in each of mesic and xeric habitats for evidence of local adaptation [including a prelimi-nary quantitative trait loci (QTL) analysis] and showed that the mesic ecotype consistently outperformed the xeric and that there was no evidence among recombi-nant inbred lines (RILs) of a negative relationship between performance in habitats native to the mesic and xeric ecotypes. In addition, Johansen-Morrisand
Latta(2006) documented pronounced hybrid
break-down in the field, which becomes less pronounced in more novel greenhouse environments ( Johansen
-Morrisand Latta2008), perhaps because the targets
of selection differ markedly between greenhouse and field (Gardnerand Latta2006; Lattaand McCain
2009). The present study provides a detailed analysis of QTL affecting fitness in the field to identify the specific loci underlying these patterns. We therefore extend here the earlier analyses (Gardnerand Latta 2006;
Latta 2009) to include epistatic effects, pleiotropic
effects of loci across environments, and a Bayesian assessment of alternative models to explain the data.
MATERIALS AND METHODS
A. barbatais a selfing annual tetraploid grass, with disomic inheritance (Hutchinsonet al. 1983). It therefore lends itself well to the creation and mapping of RILs. The crossing design was detailed in Gardnerand Latta (2006). Briefly, a xeric maternal parent was pollinated from a mesic paternal parent. An F1individual was grown under abundant light, water, and
nutrients, producing numerous F2seeds, 200 of which were
used to found RILs, which were propagated by single-seed descent with self-fertilization to the F6stage, each homozygous
for a unique random combination of the parental alleles. Although such homozygosity precludes our studying domi-nance interactions in the present study, RILs have the advantage that a given genotype can be replicated in multiple environ-ments to test forG3Einteractions. As the F6seed stocks began
to run low, a further round of propagation gave F7seeds.
640 cM. SinceA. barbatahas 14 chromosome pairs and likely 1600 cM ( Jinet al. 2000; Wightet al. 2003), our map is clearly a partial map. However, additional AFLP and RAPD loci have so far failed to extend the map coverage (M. Morine, unpub-lished data). One region on LG 19 shows pronounced segregation distortion (Gardner and Latta 2006), which appears due to a locus affecting pollen viability ( J. Pollack, unpublished data), such that pollen carrying the mesic allele is less likely to fertilize the F2offspring of the heterozygous
F1than pollen with the xeric allele.
Fitness was estimated for each RIL and the parental ecotypes as described in Latta(2009). Common garden plots were established at Hopland and Sierra Foothills Research and Extension Centers, which are typical of the habitat in which the mesic and xeric ecotypes of Allardet al. (1972) occur naturally. At each site, we established a randomized block design, with three blocks. Each RIL was represented once in each block in a random location and was deliberately exposed to as much of the natural environment (both biotic and abiotic, above and below ground) as possible. At the onset of summer drought, and natural senescence, the above ground dry mass and the number of spikelets of each individual were recorded. This design was repeated [with minor mod-ifications (Latta 2009)] in each of four growing seasons (2002–2003, 2003–2004, 2005–2006, and 2006–2007), which spanned the range of interannual climatic variation of the last two decades.
Analysis:Individuals that failed to survive to flowering were assigned a fitness of zero (they produced no spikelets). Most of the nonsurvivors had also decomposed by the season’s end and were assigned a mass of zero as well (see Latta and McCain 2009 for an analysis of selection on growth of seedlings). Because survivorship and fecundity were highly variable across the four growing seasons, relative fitness was calculated within each year/site combination by dividing through by the fitness of the midparent. Logarithms of (relative fitness10.05) gave more normal distributions for analysis. Mean fitness across years was calculated by averaging the logarithms of relative fitness—this is approximately (because of adding 0.05 to all values) equivalent to the logarithm of geometric mean fitness.
We began by mapping QTL for each trait [mean fitness as well as mass and fitness in each of the (234¼) eight year/site combinations] separately using composite interval mapping (Zeng1993) as implemented in QTL Cartographer (Wang et al. 2007). Significance thresholds were estimated using the permutation method of Churchilland Doerge(1994), with 1000 permutations for mean fitness and 300 for each of the individual measures. Default settings of a 5-cM window and 5 cofactors were used.
Because composite interval mapping (CIM) returns a locus-by-locus test of significance, it is not automatically clear whether the model returned is substantially better fitting than other models. We therefore employed Bayesian interval mapping as implemented in R/qtlbim (Yi 2004; Yandell et al. 2007) to assess the posterior probability distribution of all possible QTL models that fit the data. We employed a Poisson prior distribution for the number of QTL with mean equal to the number of QTL returned by CIM. We also permitted epistatic interactions within the Bayesian interval mapping (BIM) models.
To test epistatic interactions among QTL, we employed multiple-interval mapping (Kaoet al. 1999) in QTL Cartogra-pher. Beginning with a model that pooled the QTL identified or suggested by CIM and BIM, we first optimized the chromosomal positions of these loci and then tested for any epistatic interactions among them. We then tested all effects
for significance, retaining in the model only those for which the likelihood ratio exceeded the significance threshold.
We examinedG3Einteractions in two ways. Joint interval mapping ( Jiang and Zeng 1995) in QTL Cartographer provides an explicit test for G 3Einteractions as well as a pooled test for significance of QTL for all traits (in this case, all year/site combinations). Significance testing in this approach is problematic for two reasons. First, most QTL mapping software treats the individuals from separate environments as independent genotypes (as when an F2 or a backcross
population is divided into subsets grown in different sites). Since individuals from a given RIL are not independent genotypes even though grown in different environments, this can inflate the significance. Second, randomization in per-mutation tests removes the main effect of the QTL, as well as its interaction with the environment, and so assumes that the probability distribution forG3Einteractions is the same in the absence as in the presence of a QTL (cf. Nicholset al. 2007), which may not be the case.
Our second approach toG3Einteractions involved a test for pleiotropy in multitrait multiple-interval mapping (MIM) (Zeng1993) to determine whether the QTL affecting fitness in one trial was at a significantly different position from that affecting fitness in other trails. The test assesses the degree to which adaptation to different environments is independent (Viaand Lande 1987) or constrained by a common set of underlying loci. We began with an overall test for pleiotropic effects in which a simple model based on QTL common to all trials was examined. QTL positions were optimized for their effects on all trials simultaneously. An additional QTL was introduced on the same linkage group as one of the existing QTL, positions were reoptimized, and then we determined whether the model with two linked QTL fit the data signifi-cantly better than a model with a single pleiotropic QTL.
We also examined each pair of trials separately, testing whether the QTL affecting fitness in the two trials were in significantly different positions. We used the same approach to determine whether QTL for mass and fitness within each environment were a single pleiotropic locus (as expected if selection were acting on plant size) or separate linked loci.
RESULTS
Mean fitness across environments: The permutation
appeared in all the models of the posterior distribution, none of which contained fewer than two QTL.
MIM reveals significant epistasis between the two QTL for fitness (Table 1). The likelihood ratio of this epistatic effect is 31 (d.f.¼1,P,0.0001) and explains some 10% of the variation among RILs. The effect is positive—that is, the average fitness of the parental allelic combinations is greater than the average of the recombinants. The size of the effect is of the same order as the main effects of each locus, such that the beneficial effects of recombining the favored alleles at each QTL (in AABB recombinants) are only slightly greater than the loss of fitness through disrupting the positive epistatic effect in the parental combinations. Thus the main loss of fitness is in the recombinant with the disfavored (aabb) alleles at both QTL (Figure 2).
This interaction is present in all of the models included in the posterior distribution from BIM, but BIM suggests other possible interactions between loci that lack main effects (Figure 2). These interactions (between LGs 13 and 17 and between LGs 17 and 18) are far less significant than the interaction between the two main effect QTL. Only the interaction between LGs 17 and 18 remains marginally significant when included in a MIM model (LR¼11.4,P,0.1; Table 1).
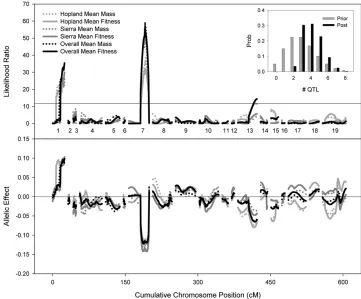
Overall, the loci account for over half of the variation in mean fitness among RILs, with most of this variance explained by the loci on LGs 1 and 7 (Table 1).
Individual environments and genotype-by-environment interactions:In each of the eight year/site environments,
analyzed separately, the QTL on LGs 1 and 7 are consistently associated with fitness, and these effects are consistently in the same direction. That is, the xeric allele at LG 1 and the mesic allele at LG 7 are consistently (though not always significantly) favored in all environ-ments (Table 2; see also Latta 2009). The epistatic
interaction between these QTL is only occasionally significant, notably in 2006.
TABLE 1
Final MIM model of mean fitness
Linkage group Position LR Effecta
% variance explained
Additive effects
1 29 49.40 0.1024 16.5
7 45 77.93 0.1320 24.6
13 49 19.08 0.0681 5.6
17 16 1.11 0.0143 0.2
18 22 1.38 0.0195 0.7
Epistatic interactions
137 31.41 0.0792 9.9
17318 11.45 0.0604 3.2
Total variance explained
60.7
The dependent variable was Log[rel fitness10.05], aver-aged across all eight field trials.
a
A positive additive effect indicates that the allele inherited from the xeric parent increased the trait. A positive epistatic effect indicates that the parental combination of alleles in-creased the trait.
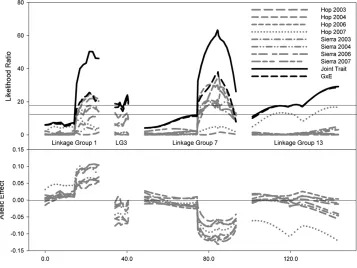
Other QTL affecting fitness exhibited significant effects on fitness within a particular year/site environ-ment. QTL on LGs 3, 4, 13, and 17 have likelihood ratios that peaked above 9.5 in at least one year/site combination (CIM, not shown), and we used MIM to test whether these significantly improved the fit of the model over the QTL on LGs 1 and 7. LG 13 showed a significant association with fitness at Hopland in 2007. A QTL on LG 3 was marginally associated with fitness at Sierra that same year (Figure 3). In both cases the mesic allele is favored. The epistatic interaction be-tween LGs 17 and 18 was marginally significant only for Sierra in 2007 and had no effect in any other ments. BIM was not applied to individual
environ-ments because the MCMC chains often failed to converge, but for those environments where the chain did converge, the results were largely consistent with the MIM model.
Despite the additional power of joint interval map-ping (through combining the ‘‘signal’’ across multiple correlated phenotypes), joint interval mapping (JIM) reveals little evidence for additional QTL affecting fitness. The G 3 E test in JIM revealed significant interactions at four loci (Figure 3). In three cases, this appears to be the result of variation in the strength of selection—the same allele is favored in each environ-ment, but the effect on fitness varies. In the fourth case, LG 13, the QTL affects fitness in only a single
ment (Hopland, 2007) and has no association with fitness in other environments.
Pleiotropy: Our explicit tests of pleiotropy are
re-stricted to only those loci with significant effects in multiple environments. The estimated position (peak of the LR plot) of QTL on LGs 1 and 7 varies among environments (Table 3). Beginning from a multitrait MIM model of all eight environments, with a single locus on each linkage group, introducing a second QTL on LG 1 increased the log-likelihood by 5, but the second QTL affected only Hopland 2004, and more-over, the two QTL had effects in repulsion phase in this environment. Introducing a second QTL on LG 7 increased the log-likelihood by 8, but again the two loci had effects in repulsion phase. Since multiple
addi-tional parameters (one position and eight allelic effects) are introduced by positing a second QTL, these likelihood ratios are not significant (d.f.¼9,P.0.5).
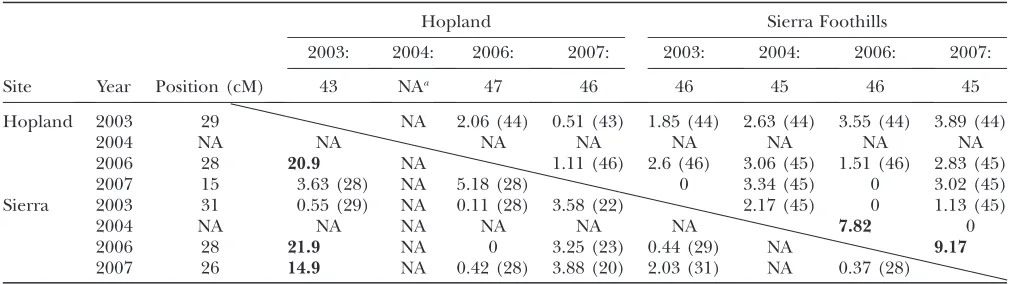
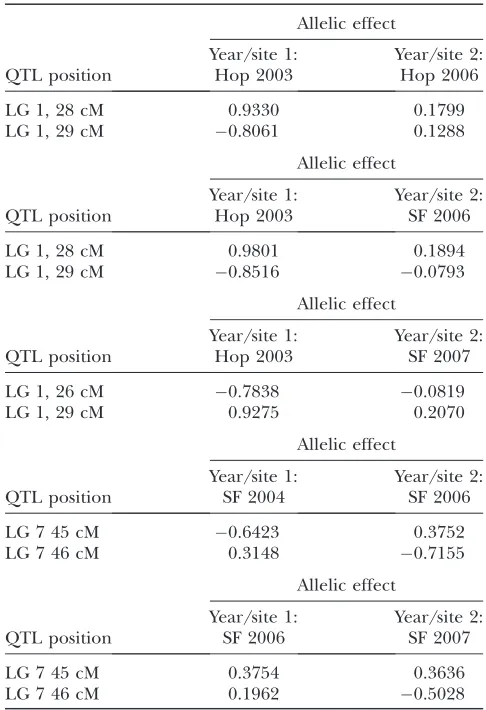
In pairwise tests, the positions of the QTL affecting fitness in one environment were usually not significantly distinguishable from those of QTL affecting fitness in a different environment (Table 3), indicating that adap-tation to the various environments is constrained by a common set of QTL. In all cases where linked loci gave a significantly better fit to the data than a single pleiotro-pic QTL, one of the traits was influenced in opposite ways by both loci (Table 4). For example, comparing results from 2003 and 2006 at Hopland, linked QTL on LG 1 provide a significantly better fit to the data, but the two linked loci have effects of10.9 and0.8 on fitness
TABLE 2
Effects of QTL in the final multitrait MIM model of log relative fitness in each individual environment
LG 1: LG 7: LG 13:
29 cM 45 cM 47 cM LG 13LG 7
% variance explained
Hopland 2003 0.1170 0.1340 0.0288 0.1026 16.06
Hopland 2004 0.0690 0.1120 0.1744 0.2524 4.97
Hopland 2006 0.3012 0.3665 0.0307 0.6908 41.27
Hopland 2007 0.2828 0.2105 0.4792 0.3874 19.26
Sierra 2003 0.1063 0.1270 0.0090 0.2825 31.30
Sierra 2004 0.1411 0.3466 0.1521 0.1171 15.30
Sierra 2006 0.3199 0.3140 0.0479 0.5407 30.54
Sierra 2007 0.2800 0.4174 0.1360 0.2353 29.92
A positive additive effect indicates that the allele inherited from the xeric parent increased the trait. A positive epistatic effect indicates that the parental combination of alleles increased the trait. Statistically significant ef-fects are highlighted in boldface type. Percentage of variance explained is total across all QTL efef-fects.
at Hopland in 2003. There is no evidence of such closely linked major loci in repulsion phase in the single-trait analyses. All such cases on LG 1 involved fitness at Hopland in 2003, while those on LG 7 all involved Sierra Foothills in 2006. Since very few recombinants are expected between such closely linked loci, these suggest a statistical artifact.
Most QTL affecting fitness showed parallel effects on mass (Figure 1). In all but one of these cases, the locations of the QTL affecting the two traits were not significantly different, suggesting pleiotropic effects of single QTL on both traits. As above, the only exception (Hopland, 2003) posited closely linked loci with large effects in repulsion phase.
DISCUSSION
The first, and in some ways most striking, result from this analysis is that two loci account for a large pro-portion of the variation in geometric mean fitness among the lines. These loci have pleiotropic effects on mass (Figure 1), implying that the mechanism of selection on the QTL is that they increase the size of the plants (cf. Lattaand McCain 2009). Nearly
one-quarter of the variation in mean fitness is accounted for by LG 7 with a further quarter attributable to LG 1 and the epistatic interaction (Table 1). This implies strong natural selection acting on specific genes inA. barbata. Effect sizes imply that LGs 1 and 7 experience selection coefficients of10 and 13%, respectively. These effect sizes are at odds with the traditional assumption that many loci contribute to fitness. There are several rea-sons for this supposition. Analytical tractability (Fisher
1930; Lande 1975) mandated the assumption before
computing power became readily available. Second, it is expected that loci under strong selection would be rapidly fixed by selection, removing variation at major loci (Roffand Mousseau1987). Third, because fitness
is a complex character, it is plausible that many different traits and loci would each contribute small amounts to variation in the overall lifetime reproductive success of an organism (Falconer 1989; Price and Schluter
1991).
A natural caveat to our result is the common observation that the effects of ‘‘major’’ QTL are prone to being overestimated, while QTL of small effect remain undetected. This occurs because of a combina-tion of the significance threshold and error in the estimation of QTL effect sizes (Ottoand Jones2000;
Xu 2003). In essence, loci for which the effect size is
overestimated are more likely to exceed the significance threshold than those where the effect is underesti-mated. This effect is generally most pronounced when there are small sample sizes and low heritabilities (Roff
1997; Xu2003). In A. barbata, heritability of fitness in
the field is low (Gardner and Latta 2008), at least
within any one environment. Thus within any one environment, a large portion of the variance in RIL means is likely due to sampling variation, especially since relatively few individuals per RIL were measured within each environment (error variance¼s2
e/n, where
n ¼3 for most RILs in most environments). However, the error variance of the mean fitness across all eight environments is proportional to 1/8n approximately, such that error variance likely plays a much smaller role in the mean fitness estimates. Moreover, the QTL on LGs 1 and 7 were consistently identified in multiple environments individually, despite the lower statistical power within each separate environment. Thus it would
TABLE 3
Pairwise likelihood-ratio tests of pleiotropyvs.close linkage of QTL affecting relative fitness in different years/sites
Hopland Sierra Foothills
2003: 2004: 2006: 2007: 2003: 2004: 2006: 2007:
Site Year Position (cM) 43 NAa 47 46 46 45 46 45
Hopland 2003 29 NA 2.06 (44) 0.51 (43) 1.85 (44) 2.63 (44) 3.55 (44) 3.89 (44)
2004 NA NA NA NA NA NA NA NA
2006 28 20.9 NA 1.11 (46) 2.6 (46) 3.06 (45) 1.51 (46) 2.83 (45)
2007 15 3.63 (28) NA 5.18 (28) 0 3.34 (45) 0 3.02 (45)
Sierra 2003 31 0.55 (29) NA 0.11 (28) 3.58 (22) 2.17 (45) 0 1.13 (45)
2004 NA NA NA NA NA NA 7.82 0
2006 28 21.9 NA 0 3.25 (23) 0.44 (29) NA 9.17
2007 26 14.9 NA 0.42 (28) 3.88 (20) 2.03 (31) NA 0.37 (28)
The location of the QTL in a single-trait model is given, in the row (to the right) and column labeled Position (cM). Likelihood ratios of the constrained (one QTL)vs.unconstrained (two linked QTL) models are given with statistically significant results in boldface type. Where tests are not significant, the optimum position of a single QTL is given. Results for LG 1 are below the diagonal, and results for LG 7 are above the diagonal. For example, the QTL on LG 7 affecting fitness at Hopland 2003 (43 cM) and at Hopland 2006 (47 cM) are not significantly different (LR¼2.06) and the most likely position of a pleiotropic QTL is 44 cM.
appear that their pronounced effects are not an artifact of low heritability.
Also of concern are artifacts caused by limited sampling of possible genotypes. Although we measured
6000 individuals across all environments, these rep-resent only 179 different genotypes. In F2 mapping designs, increasing the number of individuals increases the number of QTL found, while decreasing the estimated effect (Roff1997; Ottoand Jones2000). It
is not clear how this would apply to RIL mapping populations, but it seems that even with accurate estimates of RIL means, a small number of RILs would increase the possibility of spurious associations between particular chromosomal regions and fitness. Moreover, while we have included a moderately large number of RILs, our mapping population (like many such) con-tains the recombinant progeny of a single cross. Therefore an important follow-up to the present study would be to determine whether the same loci and interactions associate with fitness in independent crosses between the ecotypes.
Epistasis:With these caveats in mind, if we accept the
results reported here, we can ask what implications they have for the genetic basis of adaptation in A. barbata. A. barbatawas originally discussed as an example both of coadapted gene complexes (epistasis) and of local adaptation (G3E) (Allardet al. 1972), of which the
inference of local adaptation has been more widely cited (Avise 1994; Linhart and Grant 1996; Cox 2004).
Ironically, the present results provide strong evidence for the presence of an epistatic interaction, with no evidence of local adaptation (cf. Latta2009).
The nature of epistatic interactions in wild popula-tions can be difficult to determine, in part because of the greater statistical power required (Lynch and
Walsh1998) and partly because there are more possible
ways to be nonadditive (i.e., epistatic) than strictly additive. The present interaction is not the result of multiplicative fitness interactions [which are typically viewed as the standard mode of interaction at fitness loci (Charlesworth and Charlesworth1987)], because
these would have become additive following the loga-rithmic transformation. Genetic models traditionally fit the epistatic interaction as the departure from additivity between the loci. This is biologically relevant in high-lighting the strong main effects (which can respond to short-term selection) that are often present even with strong epistasis.
However, the epistatic interaction between LG 1 and LG 7 is arguably the primary source of variation among the RILs. The interaction plot (Figure 2) makes clear that, rather than the parental allelic combinations having high fitness, one recombinant has particularly low fitness. Having the disfavored allele at one of the QTL produces relatively little loss in fitness, but having the disfavored allele at both QTL produces a pro-nounced fitness cost. This suggests that the nature of the interaction (at least for this locus pair) is more similar to synergistic deleterious mutations (Whitlock
and Bourguet 2000; Kelly 2005) or a Dobzhansky–
Muller incompatibility (Dobzhansky 1951; Turelli
and Orr2000) than to a coadapted gene complex as
postulated by Allardet al. (1972). SinceA. barbatais a
tetraploid, one straightforward hypothesis would sug-gest that the interacting loci might be paralogs, with a mutation in one of the paralogs in each parental ecotype.
While the epistatic interaction is the primary source of variation for thisspecificlocus pair, it does not fully explain the substantial hybrid breakdown seen in the RILs and that is particularly pronounced in the field ( Johansen-Morrisand Latta2006, 2008). RILs with
the two parental combinations at LG 1 and LG 7, and even RILs with the favored recombinant, are on average substantially less fit than the midparent (Figure 2). This implies that additional gene interactions are contribut-ing to hybrid breakdown. Such interactions are either too weak to be detected in the present analysis or
TABLE 4
Allelic effects for the two-locus model in those cases where two linked loci fit the data significantly better than a single
pleiotropic locus (see Table 3)
Allelic effect
Year/site 1: Year/site 2:
QTL position Hop 2003 Hop 2006
LG 1, 28 cM 0.9330 0.1799
LG 1, 29 cM 0.8061 0.1288
Allelic effect
Year/site 1: Year/site 2:
QTL position Hop 2003 SF 2006
LG 1, 28 cM 0.9801 0.1894
LG 1, 29 cM 0.8516 0.0793
Allelic effect
Year/site 1: Year/site 2:
QTL position Hop 2003 SF 2007
LG 1, 26 cM 0.7838 0.0819
LG 1, 29 cM 0.9275 0.2070
Allelic effect
Year/site 1: Year/site 2:
QTL position SF 2004 SF 2006
LG 7 45 cM 0.6423 0.3752
LG 7 46 cM 0.3148 0.7155
Allelic effect
Year/site 1: Year/site 2:
QTL position SF 2006 SF 2007
LG 7 45 cM 0.3754 0.3636
involve higher-order gene interactions that were not modeled here (and for which techniques are not well developed or widely implemented). These interactions may or may not show the same pattern of a single low-fitness recombinant as seen in LGs 1 and 7.
Interactions between loci without additive effects are relatively rare. The epistatic interaction between QTL on LGs 17 and 18 is therefore intriguing, but we approach the result with caution. This interaction is relatively weak, with wide error bars on the effects (Figure 2, bottom right), and enjoys only moderate support in the Bayesian analysis. Moreover, unlike LGs 1 and 7, the effect at LGs 17 and 18 is evident in only one of the individual environments (Sierra Foothills, 2007). However, it also has the unusual property of being an interaction in which the novel combinations are more fit than those in the parents. This is generally un-expected on theoretical grounds, since the parental genotypes have already experienced many generations of selection (though linkage disequilibrium could well prevent the most fit genotype from going to fixation— see below). It is also counter to our empirical observa-tions that hybrid breakdown in the field is pronounced ( Johansen-Morrisand Latta2006).
Genotype-by-environment interactions and evolu-tionary trajectory:A careful search for evidence of local adaptation inA. barbatafails to support that hypothesis (Latta 2009). The mesic genotype appears to be
consistently more fit than the xeric (Latta2009), and
the QTL results provide a straightforward explana-tion—the mesic allele is favored at more loci and by a larger amount than the xeric allele (Table 1). Although the same loci are under selection in each environment (Table 3) and we find significant G 3 E interactions for four QTL (Figure 3), in none of the cases does the interaction meet the criteria for local adaptation. In each case rather, the interaction involves variation in the size of the allelic effect,i.e., in the strength rather than the direction of selection on the locus. Selection acts consistently on LG 1 and LG 7, in most of the en-vironments, but to differing degrees. LG 13 by contrast is under selection in only one environment (Hopland, 2007). Similarly, the epistatic interaction between LGs 17 and 18 affects fitness in only one of the environ-ments. The QTL results show no evidence that alter-nate alleles are favored in different environments, and similar results have been reported in a number of species (e.g., Fry et al. 1998; Weinig et al. 2003;
Verhoeven et al. 2004; Lowry et al. 2009; but see
Hawthorneand Via2001). These observations argue
against the long-term maintenance of genetic variation at these loci because they imply that a single genotype can have high fitness across all environments. Instead, a single favored genotype is predicted to spread to fix-ation and Latta (2009) summarizes evidence that
such evolutionary change may indeed be occurring in
A. barbata.
The expectation that selection will have removed variation assumes that populations have come to equi-librium with their environments. This is less likely for recent colonists of new regions and there is considerable evidence that introduced species undergo a period of adaptation to novel habitats (Reznickand Ghalambor
2001; Cox 2004). While California and Spain are both
Mediterranean climate regions, there may be many differences in other aspects of the habitat (e.g., soils, biotic interactions, etc.). Consequently, loci that were neutral in the ancestral range may well come under strong selection in California.
In addition, the elimination of genetic variation by natural selection can be substantially slowed by negative correlations between different targets of selection (Hill
and Robertson1966; Lande1982; Roffand Fairbairn
2007). In the case ofA. barbataour results show that such a correlation derives from linkage disequilibrium, with the favored allele at one QTL associated with the disfavored allele at others. This linkage disequilibrium is maintained by the highly inbred mating system typical of Avena and implies that the evolutionary trajectory is strongly constrained by opportunities for recombina-tion (Hilland Robertson1966). A recombinant can
potentially be more fit than either of the parental ecotypes, if it combines the favored allele across loci. (Note, however, that the more loci must be recombined, the lower the probability that any one recombinant will inherit all of the favored alleles.) This potential is the likely mechanism underlying the pronounced trans-gressive segregation seen in A. barbata (Gardnerand
Latta2006; Johansen-Morrisand Latta2006) as well
as numerous other species (Rieseberget al. 2003) and
is hypothesized to be a driving mechanism underlying hybrid speciation and/or adaptation to novel habitats (e.g., Anderson and Stebbins 1954; Arnold 1997;
Ellstrandand Schierenbeck2000).
It can be argued that rare or unique selective effects (such as that acting on LG 13 at Hopland in 2007) can have important impacts on the adaptation of popula-tions. Yet such cases are particularly frustrating. Being attributable to only a single year–site combination and neutral otherwise, they cannot be replicated, simply because particular years cannot be repeated. The effects are relatively weak within the single environments. This makes it plausible that they may be spurious, yet within individual environments most of the effects reported here are relatively weak, simply because the power to accurately estimate fitness in a single environment is so much less than for mean fitness.
environ-ment. SinceA. barbatashows little dormancy in a seed bank (R. G. Latta, personal observations), a successful
genotype must be able to survive and reproduce across the range of interannual environmental variation. Spatial variation shows a greater potential to maintain variation through local adaptation when migration between sites is limited (Levene 1953; Kawecki and
Ebert 2004) as is likely in A. barbata. However, QTL
for mean fitness within Hopland and Sierra Foothills closely mirror those for overall geometric mean fitness (Figure 1). QTL such as that on LG 13, which are under selection in only a single environment, will be neutral in the other. Consequently, the same genotype appears to be favored in both spatial environments, and the QTL results predict that such a genotype should increase in frequency.
This work would not have been possible without extensive and generous help from the staff of the Hopland Research and Extension Center and the Sierra Foothills Research and Extension Center of the Division of Agriculture and Natural Resources at the University of California, Davis. Our analysis has been greatly improved by discus-sions with C. Herbinger and K. Rice. P Garcia kindly provided seed collections from which the lines were established. This work was funded by a Discovery Grant from the Natural Sciences and Engineer-ing Research Council of Canada.
LITERATURE CITED
Allard, R. W., G. R. Babbel, A. L. Kahler and M. T. Clegg,
1972 Evidence for coadaptation in Avena-barbata. Proc. Natl. Acad. Sci. USA69:3043–3048.
Anderson, E., and G. L. Stebbins, 1954 Hybridization as an
evolu-tionary stimulus. Evolution8:378–388.
Arnold, M. L., 1997 Natural Hybridization and Evolution. Oxford
University Press, New York.
Avise, J. C., 1994 Molecular Markers, Natural History and Evolution.
Chapman & Hall, New York.
Barton, N. H., 2001 The role of hybridization in evolution. Mol.
Ecol.10:551–568.
Charlesworth, B., M. Nordborg and D. Charlesworth,
1997 The effects of local selection, balanced polymorphism and background selection on equilibrium patterns of genetic di-versity in subdivided populations. Genet. Res.70:155–174. Charlesworth, D., and B. Charlesworth, 1987 Inbreeding
de-pression and its evolutionary consequences. Annu. Rev. Ecol. Syst.18:237–268.
Charnov, E. L., 1989 Phenotypic evolution under Fisher
funda-mental theorem of natural-selection. Heredity62:113–116. Churchill, G. A., and R. W. Doerge, 1994 Empirical threshold
val-ues for quantitative trait mapping. Genetics138:963–971. Clausen, J., W. M. Keckand W. M. Hiesey, 1941 Regional
differen-tiation in plant species. Am. Nat.75:231–250.
Clegg, M. T., and R. W. Allard, 1972 Patterns of genetic
differen-tiation in slender wild oat speciesAvena barbata.Proc. Natl. Acad. Sci. USA69:1820–1824.
Cox, G. W., 2004 Alien Species and Evolution: The Evolutionary Ecology of Exotic Plants, Animals, Microbes, and Interacting Native Species.
Island Press, London.
Dobzhansky, T., 1951 Genetics and the Origin of Species.Columbia
University Press, New York.
Ellstrand, N. C., and K. A. Schierenbeck, 2000 Hybridization as a
stimulus for the evolution of invasiveness in plants? Proc. Natl. Acad. Sci. USA97:7043–7050.
Falconer, D. S., 1952 The problem of environment and selection.
Am. Nat.86:293–298.
Falconer, D. S., 1989 Introduction to Quantitative Genetics, Ed. 2.
Longman, New York.
Fisher, R. A., 1930 The Genetical Theory of Natural Selection.Oxford
University Press, Oxford.
Forbes, S. N., R. K. Valenzuela, P. Keim and P. M. Service,
2004 Quantitative trait loci affecting life span in replicated pop-ulations ofDrosophila melanogaster.I. Composite interval mapping. Genetics168:301–311.
Fry, J. D., S. V. Nuzhdin, E. G. Pasyukova and T. F. C. McKay,
1998 QTL mapping of genotype-environment interaction for fitness inDrosophila melanogaster.Genet. Res.71:133–141. Gardner, K. M., and R. G. Latta, 2006 Identifying loci under
selec-tion across contrasting environments in Avena barbata using quantitative trait locus mapping. Mol. Ecol.15:1321–1333. Gardner, K. M., and R. G. Latta, 2008 Heritable variation and
genetic correlation of quantitative traits within and between ecotypes ofAvena barbata.J. Evol. Biol.21:737–748.
Grant, V., 1981 Plant Speciation, Ed. 2. Columbia University Press,
New York.
Hamrick, J. L., and R. W. Allard, 1972 Microgeographical
varia-tion in allozyme frequencies inAvena barbata.Proc. Natl. Acad. Sci. USA69:2100–2104.
Hamrick, J. L., and L. R. Holden, 1979 Influence of microhabitat
heterogeneity on gene-frequency distribution and gametic phase disequilibrium inAvena barbata.Evolution33:521–533. Hawthorne, D. J., and S. Via, 2001 Genetic linkage of ecological
specialization and reproductive isolation in pea aphids. Nature
412:904–907.
Hedrick, P. W., and L. Holden, 1979 Hitch-hiking—alternative
to co-adaptation for the barley and slender wild oat examples. Heredity43:79–86.
Hill, W. G., and A. Robertson, 1966 Effect of linkage on limits to
artificial selection. Genet. Res.8:269294.
Hutchinson, E. S., 1982 Genetic markers and ecotypic
differentia-tion ofAvena barbataPott. ex Link. Ph.D. Thesis, University of California, Davis, CA.
Hutchinson, E. S., S. C. Price, A. L Kahler, M. I. Morrisand R. W.
Allard, 1983 An experimental verification of segregation
the-ory in a diploidized tetraploid: esterase loci in Avena barbata.
J. Hered.74:381–383.
Jain, S. K., and K. N. Rai, 1980 Population biology ofAvena.8.
Col-onization experiment as a test of the role of natural-selection in population divergence. Am. J. Bot.67:1342–1346.
Jiang, C. J., and Z. B. Zeng, 1995 Multiple-trait analysis of
genetic-mapping for quantitative trait loci. Genetics140:1111–1127. Jin, H., L. L. Domier, X. J. Shenand F. L. Kolb, 2000 Combined
AFLP and RFLP mapping in two hexaploid oat recombinant in-bred populations. Genome43:94–101.
Johansen-Morris, A. D., and R. G. Latta, 2006 Fitness
consequen-ces of hybridization between ecotypes ofAvena barbata: hybrid breakdown, hybrid vigor, and transgressive segregation. Evolu-tion60:1585–1595.
Johansen-Morris, A. D., and R. G. Latta, 2008 Genotype by
envi-ronment interactions for fitness in hybrid genotypes ofAvena bar-bata.Evolution62:573–585.
Joshi, A., and J. N. Thompson, 1995 Trade-offs and the evolution of
host specialization. Evol. Ecol.9:82–92.
Kao, C. H., Z. B. Zengand R. D. Teasdale, 1999 Multiple interval
mapping for quantitative trait loci. Genetics152:1203–1216. Kawecki, T. J., and D. Ebert, 2004 Conceptual issues in local
adap-tation. Ecol. Lett.7:1225–1241.
Keller, L. F., and D. M. Waller, 2002 Inbreeding effects in wild
populations. Trends Ecol. Evol.17:230–241.
Kelly, J. K., 2005 Epistasis in monkeyflowers. Genetics171:1917–
1931.
Lande, R., 1975 Maintenance of genetic-variability by mutation in
a polygenic character with linked loci. Genet. Res.26:221–235. Lande, R., 1982 A quantitative genetic theory of life history
evolu-tion. Ecology63:607–615.
Latta, R. G., 2009 Testing for local adaptation inAvena barbata, a
classic example of ecotypic divergence identified with electro-phoretic techniques. Mol. Ecol.18:3781–3791.
Latta, R. G., and C. McCain, 2009 Path analysis of natural selection
via survival and fecundity across contrasting environments in Ave-na barbata.J. Evol. Biol.22:2458–2469.
Latta, R. G., K. M. Gardner and A. D. Johansen-Morris,
fit-ness variation across environments in Avena barbata.Genetica
129:167–177.
Levene, H., 1953 Genetic equilibrium when more than one
ecolog-ical niche is available. Am. Nat.87:331–333.
Lewontin, R. C., 1974 The Genetic Basis of Evolutionary Change.
Columbia University Press, New York.
Linhart, Y. B., and M. C. Grant, 1996 Evolutionary significance of
local genetic differentiation in plants. Annu. Rev. Ecol. Syst.27:
237–277.
Lowry, D. B., M. C. Hall, D. E. Saltand J. H. Willis, 2009 Genetic
and physiological basis of adaptive salt tolerance divergence between coastal and inlandMimulus guttatus.New Phytol.183:
776–788.
Luikart, G., P. R. England, D. Tallmon, S. Jordanand P. Taberlet,
2003 The power and promise of population genomics: from gen-otyping to genome typing. Nat. Rev. Genet.4:981–994. Lynch, M., and B. Walsh, 1998 Genetics and Analysis of Quantitative
Traits.Sinauer Associates, Sunderland, MA.
Marshall, D. R., and R. W. Allard, 1970 Maintenance of isozyme
polymorphisms in natural populations ofAvena barbata.Genetics
66:393–399.
Marshall, D. R., and S. K. Jain, 1969 Interference in pure and
mixed populations ofAvena fatuaand A. barbata.J. Ecol. 57:
251–270.
Nichols, K. M., K. W. Broman, K. Sundin, J. M. Young, P. A.
Wheeleret al., 2007 Quantitative trait loci3maternal
cytoplas-mic environment interaction for development rate in Oncorhyn-chus mykiss.Genetics175:335–347.
Nielsen, R., 2005 Molecular signatures of natural selection. Annu.
Rev. Genet.39:197–218.
Otto, S. P., and C. D. Jones, 2000 Detecting the undetected:
esti-mating the total number of loci underlying a quantitative trait. Genetics156:2093–2107.
Partridge, L., and R. Sibly, 1991 Constraints in the evolution of
life histories. Philos. Trans. R. Soc. Lond. Ser. B Biol. Sci.332:
3–13.
Price, T., and D. Schluter, 1991 On the low heritability of
life-history traits. Evolution45:853–861.
Reznick, D. N., and C. K. Ghalambor, 2001 The population
ecol-ogy of contemporary adaptations: what empirical studies reveal about the conditions that promote adaptive evolution. Genetica
112:183–198.
Rieseberg, L. H., A. Widmer, A. M. Arntz and J. M. Burke,
2003 The genetic architecture necessary for transgressive segregation is common in both natural and domesticated pop-ulations. Philos. Trans. R. Soc. Lond. Ser. B Biol. Sci.358:1141– 1147.
Roff, D. A., 1997 Evolutionary Quantitative Genetics. Chapman &
Hall, New York.
Roff, D. A., 2002 Life History Evolution.Sinauer Associates,
Sunder-land, MA.
Roff, D. A., and K. Emerson, 2006 Epistasis and dominance:
evi-dence for differential effects in life-history versus morphological traits. Evolution60:1981–1990.
Roff, D. A., and D. J. Fairbairn, 2007 The evolution of trade-offs:
Where are we? J. Evol. Biol.20:433–447.
Roff, D. A., and T. A. Mousseau, 1987 Quantitative genetics and
fitness—lessons fromDrosophila.Heredity58:103–118. Stearns, S. C., 1989 Trade-offs in life-history evolution. Funct. Ecol.
3:259–268.
Stearns, S. C., 1992 TheEvolution of Life Histories.Oxford University
Press, Oxford.
Turelli, M., and H. A. Orr, 2000 Dominance, epistasis and the
genetics of postzygotic isolation. Genetics154:1663–1679. Verhoeven, K. J. F., T. K. Vanhala, A. Biere, E. Nevoand J. M. M.
VanDamme, 2004 The genetic basis of adaptive population
dif-ferentiation: a quantitative trait locus analysis of fitness traits in two wild barley populations from contrasting habitats. Evolution
58:270–283.
Via, S., and R. Lande, 1987 Evolution of genetic-variability in a
spa-tially heterogeneous environment—effects of genotype-environ-ment interaction. Genet. Res.49:147–156.
Wang, S., C. J. Bastenand Z.-B. Zeng, 2007 Windows QTL
Cartogra-pher 2.5. Department of Statistics, North Carolina State University, Raleigh, NC. (http://statgen.ncsu.edu/qtlcart/WQTLCart.htm). Weinig, C., L. A. Dorn, N. C. Kane, Z. M. German, S. S. H
alldors-dottir et al., 2003 Heterogeneous selection at specific loci in
natural environments inArabidopsis thaliana.Genetics165:321–329. Whitlock, M. C., and D. Bourguet, 2000 Factors affecting the
genetic load in Drosophila: synergistic epistasis and correlations among fitness components. Evolution54:1654–1660.
Whitlock, M. C., P. C. Phillips, F. B. G. Mooreand S. J. Tonsor,
1995 Multiple fitness peaks and epistasis. Annu. Rev. Ecol. Syst.
26:601–629.
Wight, C. P., N. A. Tinker, S. F. Kianian, M. E. Sorrells, L. S.
O’Donoughueet al., 2003 A molecular marker map in ‘Kanota’
x ‘Ogle’ hexaploid oat (Avena spp.) enhanced by additional markers and a robust framework. Genome46:28–47.
Xu, S., 2003 Theoretical Basis of the Beavis Effect Genetics165:
2259–2268.
Yandell, B. S., T. Mehta, S. Banerjee, D. Shriner, R. Venkataraman et al., 2007 R/qtlbim: QTL with Bayesian interval mapping in ex-perimental crosses. Bioinformatics23:641–643.
Yi, N. J., 2004 A unified Markov chain Monte Carlo framework for
mapping multiple quantitative trait loci. Genetics167:967–975. Zeng, Z. B., 1993 Theoretical basis for separation of multiple linked
gene effects in mapping quantitative trait loci. Proc. Natl. Acad. Sci. USA90:10972–10976.