Condition Assessment of PCI Bridge Girder a Result of The Reduction
Prestressing Force
Made Suangga1, Irpan Hidayat1, Bobby Lutter1
1Bina Nusantara University, KH Syahdan 9, West Jakarta 11480, Indonesia
Abstract. PCI bridge girders is known and widely used for many construction e.g.: bridge, wharf, flyover, and other application. PC Bridge girders have two types: Pre - tensioned girders and post - tensioned girders. In pre tensioned girders, prestressing in carried out first then after that the fresh concrete poured. The prestressing process in only carried off after the concrete has sufficient strength. In this study, analysis was conducted for PCI bridge girder with span is 40 meters. Based on the data geometry bridge dimension girder, material girder, and material strands cable, it will be analyzed to calculate the natural frequencies and moment capacity using finite element program (Midas/Civil program). So it can be estimated how much the percentage reduction prestress force on the bridge until PCI bridge structure collapses. From the calculation, it found that the pattern comparison between reduction prestressing force and natural frequency are linear. These results are also similar for natural frequency versus moment capacity.PCI bridge will collapse when the reduction prestreesing force of 45 % to 50 % from the total loss of prestressing.
1. Introduction
Transportation is one of the most important requirements in every aspect of life such as politics, social, economic and even in cultural and the community. One of infrastructures that used to facilitate the transport activity is bridge. Bridge can shorten the distance between locations and also connect with each other locations disconnected because of rivers, lakes, valleys, ravines, irrigation canals, railroads and etc.
The strength of the bridge evaluations is needed, to know if the bridge is well maintained or not. The age of the bridge itself usually between 50-100 years, but if there is an error process during the implementation process, such as the design planning process, the construction process, the operational or even in the maintenance process, then it is possible that the bridge could not be used in less than 50 years.
As time goes by, every bridge structures will continue to experience decline in strength. To determine this deterioration of bridge is to know the natural frequencies and the capacity moment, by analyzing both values gives prediction on how much deterioration will happen.
2.
Research Significance
This research has objective to calculate natural frequency of the bridge structure due to reduction of prestressing force with single and multi girder modeling. After that, natural frequency values associated with cross-sectional moment capacity. By knowing the natural frequency and cross-sectional moment capacity of the bridge can be estimated the condition of the bridge.
The methodology that will be used in this study are identifying the loss of prestressed force in prestressed concrete after that, find the data needed to support the research process. Data that will be use for this research are geometry PCI Girder Bridge with span 40 m, dimension of girder, material PCI girder, material strand cables, and prestressing force of tendon (cables).
The modeling process and analysis are using the Midas/Civil program. The data obtained will be used as input on the Midas/Civil program. Loss of prestressed force in prestressed concrete will be modeled by a reduction in modulus of elasticity concrete. Any reduction in the value of the modulus of elasticity is analyzed natural frequencies and moment capacity of the bridge in order to get comparative results of decreased natural frequency and moment capacity of prestressed bridge structures.
3. The Modelling of PCI Girder Bridge
The data are assumed in this study is the geometry of the structure, type of material, and I girder cross-section properties. Here is the data:
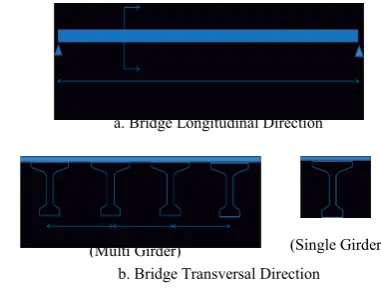
Figure 1 Geometry of PCI Bridge Girder A
a. Bridge Longitudinal Direction A
b. Bridge Transversal Direction
(Multi Girder) (Single Girder)
C
Owned by the authors, published by EDP Sciences, 2014
Figure 2 Dimension of girder and Location Tendons
Material properties from PCI girder and tendon (strand cables) are shown in table 1 and table 2
Table 1 Material PCI Girder
Compressive strength concrete
= 33,2 MPa
Modulus of elasticity = 27081,12
MPa
Poisson ratio = 0.2
Modulus of rigidity =
11283,81 MPa Thermal Expansion
Coefficient
Table 2 Material Strand Cable
Strand Type
prEN 10138 – 3 (2006) Y1860S7
ASTM A 416 – 06 Grade 270 Nominal diameter, d
(mm) 15,3 15,7 15,24
Nominal cross-section, Ap
(mm²) 140 150 140
Nominal mass, M
(kg/m) 1,093 1,172 1,102
Nominal yield strength, fp0,1k
(MPa) 1636 1640 1676
Nominal tensile strength, fpk
(MPa) 1860 1860 1860
Specific/min. breaking load,
Fpk (kN) 260 279 260,7
Young’s Modulus
(GPa) Approx. 195
Relaxation after 1000h at 20º and 0,7 Fpk
(%)
Max. 2,5
4. Analysis and Results
Natural frequency calculation on the bridge will be calculated with reductions in the prestressing cable force step by step. In this study, the reductions prestressing force with a range 5% to 50% of the value
occurred. The following figures are single girder, multi girder bridge and the prestress cable modelling.
Figure 3 Multi GirderBridge Design
Figure 4 Single Girder Bridge Design
The values prestressing force after short term and long term loss of prestress is 7526 kN. After the specified value of prestressing force, reduce that value with percentage 5 % to 50 %. The value of reduction prestressing force is shown on table 3.
Table 3 Reduction Prestressing Force
% Prestress Force Reduction
Prestressing Force (kN)
5 % 7150,55
10 % 6774,20
15 % 6397,86
20 % 6021,51
25 % 5645,17
30 % 5268,82
35 % 4892,48
40 % 4516,13
45 % 4139,79
50 % 3763,45
From the calculation using Midas/Civil program, value of natural frequency and moment for single girder and multi girder are obtained. The values is shown in table 4
Table 4 Calculation Results of Natural Frequency and Capacity Moment
Prestressing Force
Natural Frequency (Hz)
Capacity Moment (kN) Single
girder
Multi
girder (kN.m)
7526,89 0,486849 0,475579 14425,23
7150,55 0,475042 0,463430 13920,26
6774,20 0,464004 0,452164 13407,97
6397,86 0,453697 0,441677 12890,36
6021,51 0,444045 0,431886 12367,01
5645,17 0,434981 0,422714 11837,78
5268,82 0,426448 0,414101 11302,58
4892,48 0,418396 0,405991 10761,51
4516,13 0,412883 0,398337 10214,13
4139,79 0,405508 0,391098 9661,53
3763,45 0,398557 0,384238 9102,75
Comparison capacity moment and natural frequency will be shown from figure 5 and figure 6.
Figure 5 Comparison: Capacity Moment and Natural Frequency of Single Girder and Multi Girder Bridge
Figure 6 Comparisons: Presstress Force and Natural Frequency of Single Girder and Multi Girder Bridge
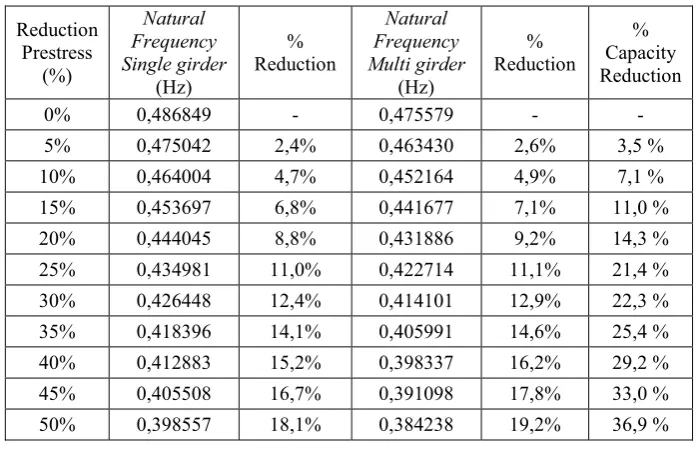
The next step is taking into account the percentage of natural frequency and moment capacity for single and multi girder. The results will be shown in table 5. The percentage values reduction natural frequency and capacity moment which is obtained from table 5 will be compared with the Condition Assessment for Superstructure with Vibrate Test Method Guidance (Penilaian Kondisi Jembatan Untuk Bangunan Atas Dengan Cara Uji Getar) [3].
Table 5 Percentage Natural Frequency and Moment Capacity Girder after Reduction Prestressing Force
Reduction Prestress
(%)
Natural Frequency Single girder
(Hz)
% Reduction
Natural Frequency Multi girder
(Hz)
% Reduction
% Capacity Reduction
0% 0,486849 - 0,475579 - -
5% 0,475042 2,4% 0,463430 2,6% 3,5 %
10% 0,464004 4,7% 0,452164 4,9% 7,1 %
15% 0,453697 6,8% 0,441677 7,1% 11,0 %
20% 0,444045 8,8% 0,431886 9,2% 14,3 %
25% 0,434981 11,0% 0,422714 11,1% 21,4 %
30% 0,426448 12,4% 0,414101 12,9% 22,3 %
35% 0,418396 14,1% 0,405991 14,6% 25,4 %
40% 0,412883 15,2% 0,398337 16,2% 29,2 %
45% 0,405508 16,7% 0,391098 17,8% 33,0 %
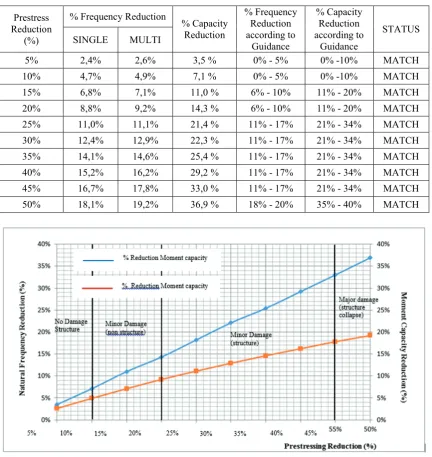
Table 6 Comparison Percentage Natural Frequency and Moment Capacity with Condition Assessment for Superstructure With Vibrate Test Method Guidance
Prestress Reduction
(%)
% Frequency Reduction
% Capacity Reduction
% Frequency Reduction according to
Guidance
% Capacity Reduction according to
Guidance
STATUS
SINGLE MULTI
5% 2,4% 2,6% 3,5 % 0% - 5% 0% -10% MATCH
10% 4,7% 4,9% 7,1 % 0% - 5% 0% -10% MATCH
15% 6,8% 7,1% 11,0 % 6% - 10% 11% - 20% MATCH
20% 8,8% 9,2% 14,3 % 6% - 10% 11% - 20% MATCH
25% 11,0% 11,1% 21,4 % 11% - 17% 21% - 34% MATCH
30% 12,4% 12,9% 22,3 % 11% - 17% 21% - 34% MATCH
35% 14,1% 14,6% 25,4 % 11% - 17% 21% - 34% MATCH
40% 15,2% 16,2% 29,2 % 11% - 17% 21% - 34% MATCH
45% 16,7% 17,8% 33,0 % 11% - 17% 21% - 34% MATCH
50% 18,1% 19,2% 36,9 % 18% - 20% 35% - 40% MATCH
Figure 7 Comparison Percentage Natural Frequency and Moment Capacity With Condition Assessment for Superstructure With Vibrate Test Method Guidance
5. Conclusion
From the study there are some conclusion which are : 1. The natural frequency single girder is greater
than multi girder bridge.
2. The comparison between reduction prestressing force and natural frequency are linear. These results are also similar for natural frequency and moment capacity.
3. The PCI bridge will collapse when the reduction prestressing force of 45 % to 50 % from the total loss of prestressing.
References
1. Badan Standarisasi Nasional. Perencanaan Struktur Beton Untuk Jembatan RSNI T-12-2004. Badan Standarisasi Nasional, Jakarta. (2004).
2. Badan Standarisasi Nasional. Tata Cara Perhitungan Struktur Beton Untuk Bangunan Gedung SNI 03-2847-2002. Badan Standarisasi Nasional, Jakarta. (2002).
(2002).
4. Nawy, Edward. G. Prestressed Concrete. New Jersey: Pearson. (2009)
5. Lin, T.Y. & Burns, N.H. Design of Prestressed Concrete Structures. John Wiley & Sons, New York. (1981)
6. Gilbert, R.I. & Mickleborough, N.C. Design of Prestressed Concrete. Spon Press, London and New York. (1990)