Manipulating graded exercise test variables
affects the validity of the lactate threshold and
_
V
O2
peak
Nicholas A. Jamnick1☯*, Javier Botella1☯, David B. Pyne2,3☯, David J. Bishop1,4☯
1 Institute for Health and Sport, College of Sport and Exercise Science, Victoria University, Melbourne, Australia, 2 Australian Institute of Sport, Canberra, Australia, 3 Research Institute for Sport and Exercise (UCRISE), University of Canberra, Canberra, Australia, 4 School of Medical and Health Sciences, Edith Cowan University, Joondalup, Australia
☯These authors contributed equally to this work.
Abstract
Background
To determine the validity of the lactate threshold (LT) and maximal oxygen uptake (V_O2max)
determined during graded exercise test (GXT) of different durations and using different LT calculations. Trained male cyclists (n = 17) completed five GXTs of varying stage length (1, 3, 4, 7 and 10 min) to establish the LT, and a series of 30-min constant power bouts to
estab-lish the maximal lactate steady state (MLSS).V_O2was assessed during each GXT and a
subsequent verification exhaustive bout (VEB), and 14 different LTs were calculated from four of the GXTs (3, 4, 7 and 10 min)—yielding a total 56 LTs. Agreement was assessed
between the highestV_O2measured during each GXT (V_O2peak) as well as between each LT
and MLSS.V_O2peakand LT data were analysed using mean difference (MD) and intraclass
correlation (ICC).
Results
TheV_O2peakvalue from GXT1was 61.0±5.3 mL.kg-1.min-1and the peak power 420±55 W
(mean±SD). The power at the MLSS was 264±39 W.V_O2peakfrom GXT3, 4, 7, 10
underesti-matedV_O2peakby ~1–5 mL
.kg-1.min-1. Many of the traditional LT methods were not valid and
a newly developed Modified Dmaxmethod derived from GXT4provided the most valid
esti-mate of the MLSS (MD = 1.1 W; ICC = 0.96).
Conclusion
The data highlight how GXT protocol design and data analysis influence the determination
of bothV_O2peakand LT. It is also apparent thatV_O2maxand LT cannot be determined in a
sin-gle GXT, even with the inclusion of a VEB. a1111111111 a1111111111 a1111111111 a1111111111 a1111111111 OPEN ACCESS
Citation: Jamnick NA, Botella J, Pyne DB, Bishop
DJ (2018) Manipulating graded exercise test variables affects the validity of the lactate threshold
andVO2peak. PLoS ONE 13(7): e0199794._ https:// doi.org/10.1371/journal.pone.0199794
Editor:Øyvind Sandbakk, Norwegian University of Science and Technology, NORWAY
Received: April 30, 2018
Accepted: June 13, 2018
Published: July 30, 2018
Copyright:©2018 Jamnick et al. This is an open access article distributed under the terms of the
Creative Commons Attribution License, which permits unrestricted use, distribution, and reproduction in any medium, provided the original author and source are credited.
Data Availability Statement: The data underlying
this study have been uploaded to the Open Science Framework and are accessible using the following link:https://osf.io/293ns/.
Funding: Funding was provided by the Graduate
Research Office (PhD Student Budget) at Victoria University. The funder had no role in study design, data collection and analysis, decision to publish, or preparation of the manuscript.
Competing interests: The authors have declared
Introduction
Sampling of expired gas and blood data during a graded exercise test (GXT) to exhaustion per-mits identification of the gas exchange threshold (GET), the respiratory compensation point (RCP), the lactate threshold (LT), and maximal oxygen uptake (VO_ 2max). These indices can dis-tinguish cardiorespiratory fitness, and demarcate the domains of exercise [1,2] that can be used to prescribe exercise and to optimize training stimuli [3–6]. However, despite the popu-larity of these indices, the methods used to determine them can differ substantially and there has been little systematic investigation of their validity [7–9].
The recommended duration of a GXT to assessVO_ 2maxis 8 to 12 minutes [10–13]. How-ever, there is little consensus on an appropriate GXT protocol design, including duration, stage length, or number of stages, needed to establish the LT. A stage length of at least 3 min-utes has been recommended [13], although an 8-minute stage length has also been suggested for blood lactate concentrations to stabilize [14]. The number of stages and GXT duration will depend on the starting intensity and power increments. Power is typically increased identically [15], regardless of sex or fitness, leading to a heterogenous GXT duration and number of stages completed [16]. A customized approach to LT testing has been recommended to ensure a more homogenous GXT duration [17].
More than 25 methods have been proposed to calculate the LT [18]; these include the power preceding a rise in blood lactate concentration of more than 0.5, 1.0 or 1.5 mmol.L-1 from baseline [19], the onset of a fixed blood lactate accumulation (OBLA) ranging from 2.0 to 4.0 mmol.L-1[20,21], or the use of curve fitting procedures such as the Dmaxor modi-fied Dmaxmethods (ModDmax) [22,23]. However, many of these ‘accepted’ methods are influenced by GXT protocol design [8,24] and their underlying validity has not been reported.
Assessing the validity of a measurement requires comparison with a criterion measure. The maximal lactate steady state (MLSS) represents the highest intensity where blood lac-tate appearance and disappearance is in equilibrium and where energy demand is ade-quately met by oxidative phosphorylation [25]. Exercise performed above the MLSS results in accelerated blood lactate appearance and it has therefore been suggested as an appropriate criterion measure for the LT [25,26]. The primary advantages of the MLSS test include its independence of participant effort, it’s submaximal and is reliable [27]. However, the disadvantage is the necessity of multiple laboratory visits and that it yields only one index of performance.
_
VO2maxis considered the “gold standard” for assessing cardiorespiratory fitness [28] and the highest recordedVO_ 2from a GXT is often accepted as theVO_ 2max[10]. Establish-ing the LT requires a GXT that typically exceeds 20 minutes [13]; however, in these instances the highestVO_ 2may underestimate theVO_ 2max[12] and is termedVO_ 2peak. Recently, the use of a verification exhaustive bout (VEB) has been recommended to con-firm theVO_ 2max. However, it is unknown if a VEB performed after a longer duration GXT provides a valid estimate ofVO_ 2max.
The aim of this study was to determine the validity of the LT andVO_ 2maxderived from a sin-gle visit GXT. We hypothesized that our results would yield one or more GXT stage length and LT calculation method combination that provides a valid estimation of the criterion measure of the LT (i.e., MLSS). We also hypothesized the highestVO_ 2measured during longer duration
GXTs would underestimateVO_ 2maxand that the highestVO_ 2value measured during each VEB
would be similar to theVO_ 2peakmeasured during the 8- to 12-minute GXT.
Abbreviations: LT, lactate threshold; GXT, graded
exercise testing;VO_ 2max, maximal oxygen uptake; OBLA, onset of fixed blood lactate accumulation; MLSS, maximal lactate steady state; VEB, verification exhaustive bout; BMI, body mass
Materials and methods
Ethical approval
All procedures were performed in accordance with the ethical standards of the institutional and/or national research committee, and with the 1964 Helsinki declaration and its later amendments or comparable ethical standards.
Participants/Experimental design
Seventeen trained male cyclists (VO_ 2max62.1± 5.8 mL .
kg-1.min-1, age 36.2± 7.4 years, body mass index (BMI): 24.1± 2.0 kg.m-2) volunteered for this study which required 7 to 10 visits to the laboratory. Informed consent was obtained from all individual participants included in the study.
Visit one included risk stratification using the American College of Sports Medicine Risk Stratification guidelines [29], written informed consent, self-reported physical activity rating (PA-R) [30], measurement of height and body mass, and completion of a cycling GXT with 1-minute stages (GXT1) followed by a VEB. The remaining visits consisted of four cycling GXTs with varying stage length (3-, 4-, 7- and 10-min stages) and a series of 30-min constant power bouts to establish the MLSS. The GXTs and constant power bouts were performed in an alternating order and the order of the GXTs was randomised. Prior to each GXT and the con-stant power bouts a 5-min warm up was administered at a self-selected power followed by 5 min of passive rest. Participants performed each test at their preferred cadence determined during the initial visit. Antecubital venous blood (1.0 mL) was sampled during all visits (excluding GXT1) at rest, and at the end of every stage during the GXTs or every 5 min during the constant power exercise bouts. All participants self-reported abstaining from the consump-tion of alcohol and caffeine or engaging in heavy exercise 24 h prior to each visit. Participants were given at least 48 h between visits and all tests were completed within 6 weeks. The Victo-ria University Human Research Ethics Committee approved all procedures (HRE 017–035).
Equipment/Instruments
All exercise testing was conducted using an electronically-braked cycle ergometer (Lode Excal-ibur v2.0, The Netherlands). A metabolic analyser (Quark Cardiopulmonary Exercise Testing, Cosmed, Italy) was used to assess oxygen uptake (VO_ 2) on a breath-by-breath basis, and heart
rate was measured throughout all tests. Antecubital venous blood was analysed using a blood lactate analyser (YSI 2300 STAT Plus, YSI, USA).
GXTs with verification exhaustive bout
Demographic data, PA-R, and measurements of height and body mass were used to estimate _
VO2max[31] and maximum power output _Wmax[30,32].
Est:VO2max¼56:363þ ð1:921x PA RÞ ð0:381x AGEÞ ð0:754x BMIÞ þ ð10:987x SEX;1
¼MALE;0¼FEMALEÞ
_
Wmax¼ f½ðVO2max 7Þx BM=1:8g=6:12 Eq 2
WhereVO_ 2maxis expressed in millilitres per kilogram per minute, BMI is in kg .
m-2, and _Wmax is in Watts.
A custom GXT protocol with a desired time limit of 10 min was then designed for each par-ticpant using: _Wmax=10min = 1-min intensities (W.min-1). Additional customized protocols
were designed for each of the remaining GXTs based on a percentage of the measured _Wmax from GXT1. The predicted _Wmaxwas 80%, 77%, 72% and 70% for GXT3,GXT4, GXT7, and GXT10, respectively. The target number of stages for each participant was nine; the initial stage and subsequent stages of the remaining GXTs were determined using the following equations:
Stage1Power¼PredictedWmax_ 0:25 Eq 3
Subsequent power increments¼ ðPredicted _Wmax Stage1Þ=8Þ Eq 4
where stage 1 power and predicted _Wmaxsubsequent power increments are expressed in Watts. A 5-min recovery was administered after each GXT, followed by a VEB performed at 90% of _Wmaxmeasured from GXT1to measure the highest measuredVO_ 2measure (VO_ 2peak) [17].
Constant power exercise bouts to establish the maximal lactate steady state
The power associated with the respiratory compensation point (RCP) from GXT1was used in a regression equation (Eq 5) to estimate the MLSS (RCPMLSS) and the first constant power exercise [33]. The RCP was determined as the average of the power output associated with: 1) the break point in ventilation relative to expired carbon dioxide (V_E=VCO_ 2), 2) second break
point inV_Eand 3) the fall in end-tidal carbon dioxide (PETCO2) after an apparent steady state [34–36].
Estimated MLSSðRCPMLSSÞ ¼23:329þ ð0:79127x RCPÞ Eq 5
where the RCPMLSSand RCP are expressed in Watts
Participants performed 3 min of baseline cycling at 20 W prior to each constant power bout. The MLSS was established as the highest intensity where blood lactate increased<1.0 mmol.L-1from the 10thto the 30thminute [26]. If the blood lactate concentration increased >1.0 mmol.L-1the power was decreased by 3%, otherwise the power was increased by 3% [27]. This process continued until the MLSS was obtained.
LT and respiratory compensation point calculations
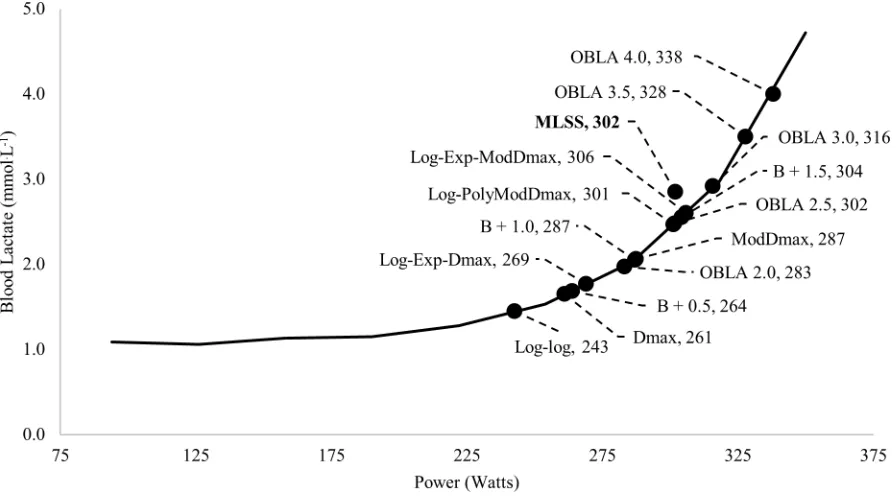
The LTs were calculated from GXT3,4,7 and 10using 14 methods (4 GXTs14 LTs = 56 LTs in total), and the RCP and the RCPMLSSwere also calculated from GXT1(56 LTs + RCP and RCPMLSS= 58 total estimates) (Fig 1):
1. Log-log: The lactate curve was divided into two segments and the intersection point of the two lines with the lowest residuals sum of squares was taken as the LT [37].
2. OBLA value of 2.0, 2.5, 3.0, 3.5, or 4.0 mmol.L-1[1,24,38].
3. Baseline + absolute value(s) (B + mmol.L-1): The intensity at which blood lactate concentra-tion increased 0.5, 1.0 or 1.5 mmol.L-1above baseline value(s) [39,40].
4. Dmax: The point on the third order polynomial regression curve that yielded the maximum perpendicular distance to the straight line formed by the two end points of the curve [23].
6. Exponential Dmax(Exp-Dmax): The point on the exponential plus-constant regression curve that yielded the maximum perpendicular distance to the straight line formed by the two end points of the curve [41,42].
7. Log-log Modified Dmax(Log-Poly-ModDmax): The intensity at the point on the third order polynomial regression curve that yielded the maximal perpendicular distance to the straight line formed by the intensity associated with the log-log LT and the final lactate point.
8. Log-log Exponential Modified Dmaxmethod (Log-Exp-ModDmax): The intensity at the point on the exponential plus-constant regression curve that yielded the maximal perpen-dicular distance to the straight line formed by the intensity associated with the log-log LT and the final lactate point.
9. RCP: refer to Constant Power Exercise Bouts to Establish the Maximal Lactate Steady State method section.
10. The estimated MLSS was based on a regression equation based on the RCP from GXT1 (RCPMLSS) (Eq 5).
Data analysis
Breath-by-breath data were edited individually with values greater than three standard devia-tions from the mean excluded [43]. The data was interpolated on a second-by-second basis and averaged into 5- and 30-s bins [44,45]. The highest measuredVO_ 2value from every GXT
and VEB was determined as the highest 20-s rolling average. TheVO_ 2maxwas computed as the
Fig 1. Representative blood lactate curve with 14 LTs calculated from GXT4(participant #9). The power of the MLSS was 302 W and the
blood lactate concentration was 2.85 mmol.L-1. Log-log = power at the intersection of two linear lines with the lowest residual sum of squares; log = using the log-log method as the point of the initial data point when calculating the Dmaxor Modified Dmax; poly = Modified
Dmaxmethod calculated using a third order polynomial regression equation; exp = Modified Dmaxmethod calculated using a constant plus
exponential regression equation; OBLA = onset of blood lactate accumulation; B + absolute value = the intensity where blood lactate increases above baseline.
highestV_O2measured from any GXT or VEB. TheV_O2peakfor each GXT was defined as the highest measuredVO_ 2from either the GXT or the subsequent VEB.
The _Wmaxfor every GXT was determined as the power from the last completed stage plus the time completed in the subsequent stage multiplied by the slope (Eq 6). TheVO_ 2response
at the MLSS was determined by the averageVO_ 2value during the last two minutes of the
30-minute constant power bout.
_
Wmax¼Power of Last StageðWÞ þ ½slopeðW:s 1Þ timeðsec:Þ Eq 6
Calculated LTs were excluded if the mean difference between the MLSS and calculated LT was greater than the error of the measurement of the MLSS [coefficient of the variation (CV%) = 3%, 7.9 W] [27], the effect size (ES) was greater than 0.2, or the Pearson Product moment correlation coefficient (r) was less than 0.90. Using these criteria, 10 of the 56 LTs and the RCPMLSS(Eq 5) were included in the analysis (Table 1).
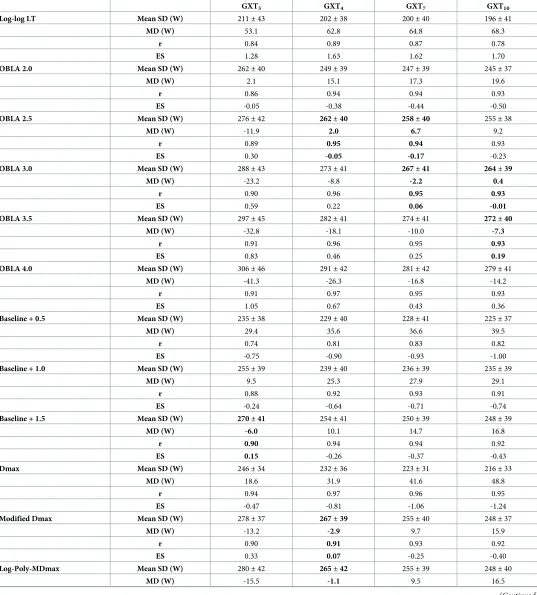
Also shown is the mean difference (MD), the Pearson product moment correlation (r) and effect size (ES) of the difference when compared with the MLSS. (log = using the log-log method as the point of the initial data point when calculating the Dmaxor Modified Dmax; poly = Modified Dmaxmethod calculated using a third order polynomial regression equation; exp = Modified Dmaxmethod calculated using a constant plus exponential regression equation; OBLA = onset of blood lactate accumulation, B + = baseline lactate value plus an absolute lac-tate value). Bold represents the LT that met the three criteria for inclusion in our final analysis: mean difference less than 7.9 Watts, Pearson moment product correlation>0.90, and a less than trivial ES difference from the MLSS (ES<0.2)
Statistical analysis
A one-way analysis of variance with repeated measures was used to assess significant differences between the MLSS and the calculated LTs. Agreement between the MLSS and the calculated LTs was evaluated using a two-way mixed intraclass correlation coefficient (ICC), standard error of the measurement (SEM), Lin’s concordance correlation coefficient (pc) [46], Bland-Altman plots [47], (r), CV% [48,49] and a magnitude-based inference approach involving standardised differ-ences (ED) [50,51]. Differences betweenVO_ 2peakvalues measured during each GXT were assessed using ES, p-values, and the CV%. Agreement betweenVO_ 2measured during each GXT and
sub-sequent VEB was evaluated using intraclass calculation coefficient (ICC), SEM, and CV% [49]. Descriptive statistics are reported as the mean± SD. Alpha was set to P0.05.
Results
MLSS
The power associated with the MLSS was 264± 39 W, and the blood lactate concentrations at the 10thand 30thmin were 2.8± 0.8 and 3.3 ± 0.8 mmol.L-1, respectively. The blood lactate val-ues at 3% above the MLSS (272± 41 W) at the 10thand 30thmin were 3.6± 0.8 and 5.0 ± 0.9 mmol.L-1, respectively. TheVO_ 2at the MLSS was 81.4± 4.7% ofVO_ 2max(3892± 441 mL
. min-1; 50.5± 4.0 mL.kg-1.min-1). For each GXT theVO_ 2at the MLSS and the power at the MLSS are
shown inTable 2.
Validity of LT estimates
Table 1. The mean± standard deviation (SD) of the 14 lactate thresholds calculated from the 4 prolonged graded exercise tests (i.e., GXT3, GXT4, GXT7and
GXT10), and the respiratory compensation point (RCP) and the maximal lactate steady state (MLSS) estimated from the RCP (RCPMLSS) calculated from GXT1.
GXT3 GXT4 GXT7 GXT10
Log-log LT Mean SD (W) 211± 43 202± 38 200± 40 196± 41
MD (W) 53.1 62.8 64.8 68.3
r 0.84 0.89 0.87 0.78
ES 1.28 1.63 1.62 1.70
OBLA 2.0 Mean SD (W) 262± 40 249± 39 247± 39 245± 37
MD (W) 2.1 15.1 17.3 19.6
r 0.86 0.94 0.94 0.93
ES -0.05 -0.38 -0.44 -0.50
OBLA 2.5 Mean SD (W) 276± 42 262± 40 258± 40 255± 38
MD (W) -11.9 2.0 6.7 9.2
r 0.89 0.95 0.94 0.93
ES 0.30 -0.05 -0.17 -0.23
OBLA 3.0 Mean SD (W) 288± 43 273± 41 267± 41 264± 39
MD (W) -23.2 -8.8 -2.2 0.4
r 0.90 0.96 0.95 0.93
ES 0.59 0.22 0.06 -0.01
OBLA 3.5 Mean SD (W) 297± 45 282± 41 274± 41 272± 40
MD (W) -32.8 -18.1 -10.0 -7.3
r 0.91 0.96 0.95 0.93
ES 0.83 0.46 0.25 0.19
OBLA 4.0 Mean SD (W) 306± 46 291± 42 281± 42 279± 41
MD (W) -41.3 -26.3 -16.8 -14.2
r 0.91 0.97 0.95 0.93
ES 1.05 0.67 0.43 0.36
Baseline + 0.5 Mean SD (W) 235± 38 229± 40 228± 41 225± 37
MD (W) 29.4 35.6 36.6 39.5
r 0.74 0.81 0.83 0.82
ES -0.75 -0.90 -0.93 -1.00
Baseline + 1.0 Mean SD (W) 255± 39 239± 40 236± 39 235± 39
MD (W) 9.5 25.3 27.9 29.1
r 0.88 0.92 0.93 0.91
ES -0.24 -0.64 -0.71 -0.74
Baseline + 1.5 Mean SD (W) 270± 41 254± 41 250± 39 248± 39
MD (W) -6.0 10.1 14.7 16.8
r 0.90 0.94 0.94 0.92
ES 0.15 -0.26 -0.37 -0.43
Dmax Mean SD (W) 246± 34 232± 36 223± 31 216± 33
MD (W) 18.6 31.9 41.6 48.8
r 0.94 0.97 0.96 0.95
ES -0.47 -0.81 -1.06 -1.24
Modified Dmax Mean SD (W) 278± 37 267± 39 255± 40 248± 37
MD (W) -13.2 -2.9 9.7 15.9
r 0.90 0.91 0.93 0.92
ES 0.33 0.07 -0.25 -0.40
Log-Poly-MDmax Mean SD (W) 280± 42 265± 42 255± 39 248± 40
MD (W) -15.5 -1.1 9.5 16.5
total) and the MLSS (all log-log methods were excluded given an ES>1.0). Ten of the calcu-lated LTs and the RCPMLSSmet our inclusion criteria for final analysis—detailed comparisons with the MLSS are provided inTable 3andFig 3. Figs3–7shows Bland-Altman plots of the 11 estimations included in our analysis; the newly developed ModDmaxLT calculations (Fig 5 Panel C and D;Fig 6Panel C) had the lowest limits of agreement with the MLSS. The log-log polynomial modified Dmax(Log-Poly-ModDmax) method derived from GXT4provided the best estimation of the MLSS (Fig 5Panel C). There was an inverse relationship between the power calculated for each of the 14 LTs and stage length (Tables1and4).
_
W
maxand
V
_
O
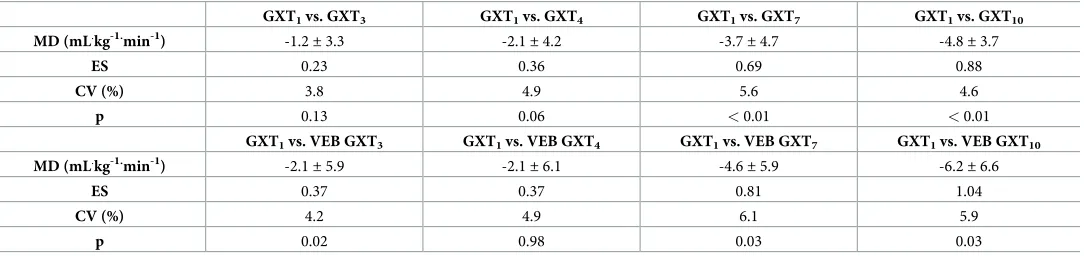
2maxThere was an inverse relationship between GXT duration and both _WmaxandVO_ 2peak (Table 5). TheVO_ 2peakvalues derived from GXT3and GXT4were similar to theVO_ 2peak mea-sured during GXT1(Table 6); however, the values were outside the variability of the measure-ment (CV>3%) [27].VO_ 2peakvalues from GXT1and the corresponding VEB had the highest agreement (MD = 0.5 mL.kg-1.min-1, ICC = 0.96, SEM = 1.1 mL.kg-1.min-1and CV = 2.0%) compared with any GXT and corresponding VEB. The remaining GXTs and corresponding
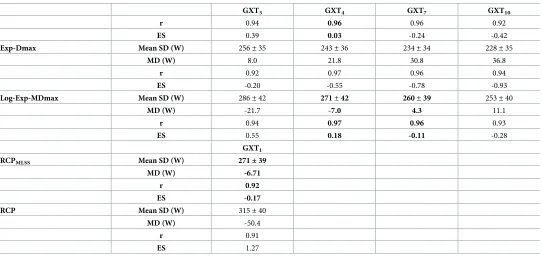
Table 1. (Continued)
GXT3 GXT4 GXT7 GXT10
r 0.94 0.96 0.96 0.92
ES 0.39 0.03 -0.24 -0.42
Exp-Dmax Mean SD (W) 256± 35 243± 36 234± 34 228± 35
MD (W) 8.0 21.8 30.8 36.8
r 0.92 0.97 0.96 0.94
ES -0.20 -0.55 -0.78 -0.93
Log-Exp-MDmax Mean SD (W) 286± 42 271± 42 260± 39 253± 40
MD (W) -21.7 -7.0 4.3 11.1
r 0.94 0.97 0.96 0.93
ES 0.55 0.18 -0.11 -0.28
GXT1
RCPMLSS Mean SD (W) 271± 39
MD (W) -6.71
r 0.92
ES -0.17
RCP Mean SD (W) 315± 40
MD (W) -50.4
r 0.91
ES 1.27
https://doi.org/10.1371/journal.pone.0199794.t001
Table 2. Mean, standard deviation, and range of theVO_
2and power associated with the maximal lactate steady state (MLSS) expressed as a percentage of the
maxi-mal power (W_max) andVO_ 2peakmeasured during each GXT. Note: TheVO_ 2at the MLSS was 81.4± 4.7% of theVO_ 2max. (Defined as the highest measuredVO_ 2during any GXT).
GXT1 GXT3 GXT4 GXT7 GXT10
_
VO2at MLSS
(% ofV_O2peak)
83.0± 4.5 [75.5–90.7]
84.7± 4.7 [76.6–91.9]
86.1± 5.9 [73.9–94.2]
88.4± 6.0 [77.4–103.2]
90.2± 5.3 [78.7–99.9]
Power at MLSS (% ofW_
max)
62.9± 3.9 [56.8–71.7]
78.4± 4.3 [69.8–84.4]
82.4± 3.6 [73.7–88.8]
87.3± 4.4 [79.8–96.0]
89.6± 4.7 [81.6–98.1]
VEB had a CV of 3.3, 2.0, 3.5 and 5.2%, for GXT3, GXT4, GXT7and GXT10, respectively. The VEB performed following the longer duration GXTs (GXT3-10) underestimated theVO_ 2peak from GXT1(Table 6).
Discussion
The main findings of the present study are as follows. Only 11 of the 58 threshold values met our inclusion criteria as valid estimates of the MLSS. Of the 11 methods included in our analy-sis, three of the ModDmaxmethods yielded the most favourable estimations of the MLSS, and the Log-Poly-ModDmaxderived from GXT4provided the best estimation of the MLSS. There was an inverse relationship between stage length and LT, and this effect was larger in all Dmax methods compared with the OBLA and baseline plus absolute lactate value methods. The
_
VO2peakvalues measured during the longer duration GXTs (GXT3-10) underestimated the
_
VO2maxand theVO_ 2peakvalues obtained from GXT1(MD = 1.2 to 4.8 mL .
kg-1.min-1). Finally,
contrary to our hypothesis, the VEB after the longer duration GXTs did not yieldVO_ 2peak val-ues comparable to theVO_ 2peakderived from GXT1.
The use of five GXT protocols, 14 common LT methods, the RCP and RCPMLSSresulted in 58 unique thresholds. However, despite their common use, we observed that only 11 of these values met our criteria for inclusion (MD<7.9 W; ES<0.2; r>0.90). Of the four Dmax meth-ods included in our analysis, one consisted of the traditional ModDmaxmethod [22]. This had the poorest agreement relative to the other ModDmaxmethods included in our analysis. The remaining three Dmaxmethods are new variations of the ModDmaxmethod, and the
Log-Poly-Fig 2. (A-D) Forrest Plots of the difference (ES± 95% CI) between the MLSS and the power calculated from the 13 lactate thresholds derived from (A) GXT3, (B) GXT4, (C) GXT7and (D) GXT10(52 in total and excluding log-log). The
solid vertical bar represents no difference from the MLSS and the dashed vertical bars represents the threshold between a trivial and small difference (ES = 0.2) established by Cohen (50) and Hopkins (49). log = using the log-log method as the initial data point when calculating the Dmaxor Modified Dmax; poly = Modified Dmaxmethod calculated using a
third order polynomial regression equation; exp = Modified Dmaxmethod calculated using a constant plus exponential
regression equation; OBLA = onset of blood lactate accumulation.
https://doi.org/10.1371/journal.pone.0199794.g002
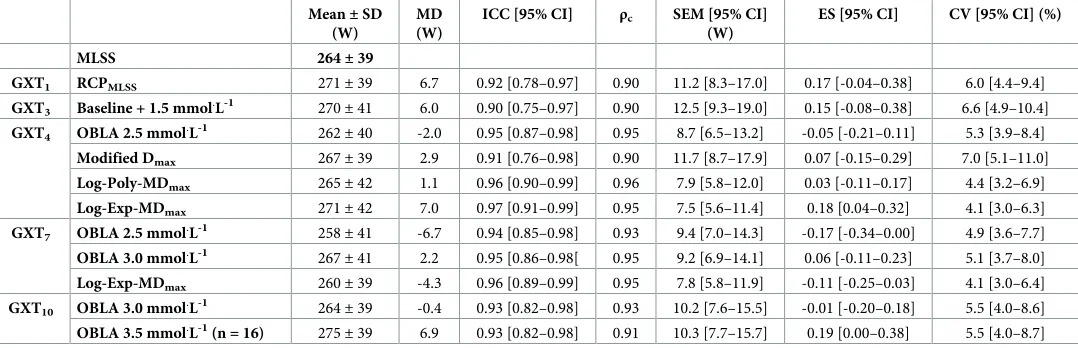
Table 3. Mean± standard deviation, mean difference (MD), intraclass correlation coefficient (ICC), Lin’s concordance correlation coefficient (ρc), standard error
of the measurement (SEM), effect size (ES) with 95% confidence limits, and coefficient of the variation (%CV) between the maximal lactate steady state (MLSS) and the eleven thresholds included in our analysis. (RCPMLSS= MLSS estimate based on the respiratory compensation point; log = Modified Dmaxmethod using the log-log
method as the point of the initial lactate point; poly = Modified Dmaxmethod calculated using a third order polynomial regression equation; exp = Modified Dmaxmethod
calculated using a constant plus exponential regression equation; OBLA = onset of blood lactate accumulation).
Mean± SD (W)
MD (W)
ICC [95% CI] ρc SEM [95% CI]
(W)
ES [95% CI] CV [95% CI] (%)
MLSS 264± 39
GXT1 RCPMLSS 271± 39 6.7 0.92 [0.78–0.97] 0.90 11.2 [8.3–17.0] 0.17 [-0.04–0.38] 6.0 [4.4–9.4]
GXT3 Baseline + 1.5 mmol.L-1 270± 41 6.0 0.90 [0.75–0.97] 0.90 12.5 [9.3–19.0] 0.15 [-0.08–0.38] 6.6 [4.9–10.4]
GXT4 OBLA 2.5 mmol.L-1 262± 40 -2.0 0.95 [0.87–0.98] 0.95 8.7 [6.5–13.2] -0.05 [-0.21–0.11] 5.3 [3.9–8.4]
Modified Dmax 267± 39 2.9 0.91 [0.76–0.98] 0.90 11.7 [8.7–17.9] 0.07 [-0.15–0.29] 7.0 [5.1–11.0]
Log-Poly-MDmax 265± 42 1.1 0.96 [0.90–0.99] 0.96 7.9 [5.8–12.0] 0.03 [-0.11–0.17] 4.4 [3.2–6.9]
Log-Exp-MDmax 271± 42 7.0 0.97 [0.91–0.99] 0.95 7.5 [5.6–11.4] 0.18 [0.04–0.32] 4.1 [3.0–6.3]
GXT7 OBLA 2.5 mmol.L-1 258± 41 -6.7 0.94 [0.85–0.98] 0.93 9.4 [7.0–14.3] -0.17 [-0.34–0.00] 4.9 [3.6–7.7]
OBLA 3.0 mmol.L-1 267
± 41 2.2 0.95 [0.86–0.98[ 0.95 9.2 [6.9–14.1] 0.06 [-0.11–0.23] 5.1 [3.7–8.0]
Log-Exp-MDmax 260± 39 -4.3 0.96 [0.89–0.99] 0.95 7.8 [5.8–11.9] -0.11 [-0.25–0.03] 4.1 [3.0–6.4]
GXT10 OBLA 3.0 mmol.L-1 264± 39 -0.4 0.93 [0.82–0.98] 0.93 10.2 [7.6–15.5] -0.01 [-0.20–0.18] 5.5 [4.0–8.6]
OBLA 3.5 mmol.L-1(n = 16) 275
± 39 6.9 0.93 [0.82–0.98] 0.91 10.3 [7.7–15.7] 0.19 [0.00–0.38] 5.5 [4.0–8.7]
ModDmaxderived from GXT4had the highest correlation and lowest mean difference with the MLSS. These variations of the ModDmax method use the power at the log-log LT as the initial intensity to calculate the ModDmaxand then either the traditional third-order polynomial or exponential plus-constant regression curve to fit the lactate curve [23,41]. Although the valid-ity of these three methods has not previously been assessed, the favourable estimations of the MLSS may be related to the greater objectivity with which they determine the intensity that corresponds with the initial rise in blood lactate concentration [37].
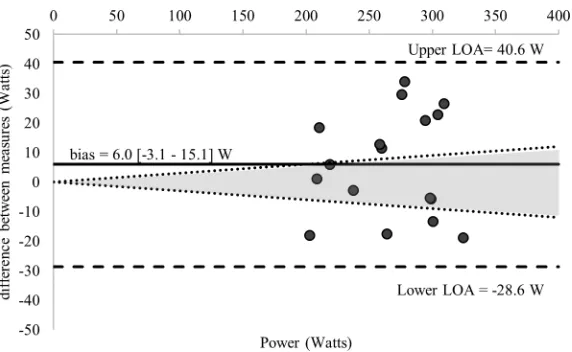
Fig 3. Bland-Altman plots displaying agreement between measures of the power associated with the RCP regression equation (RCPMLSS) calculated from GXT1and the MLSS. The differences between measures (y-axis) are
plotted as a function of the mean of the two measures (x-axis) in power (Watts). The horizontal solid line represents the mean difference between the two measures (i.e., bias). The two horizontal dashed lines represent the limits of agreement (1.96 x standard deviation of the mean difference between the estimated lactate threshold via the RCPMLSS
and the maximal lactate steady state). The dotted diagonal lines represent the boundaries of the 95% CI for MLSS reliability (CV = 3.0%; 95%; CI = 3.8%) calculated from Hauser et al., 2014) (RCP = respiratory compensation point).
https://doi.org/10.1371/journal.pone.0199794.g003
Fig 4. Bland-Altman plots displaying agreement between measures of the power associated with the baseline plus 1.5 mmol.L-1calculated from GXT3and the MLSS. The differences between measures (y-axis) are plotted as a
function of the mean of the two measures (x-axis) in power (Watts). The horizontal solid line represents the mean difference between the two measures (i.e., bias). The two horizontal dashed lines represent the limits of agreement (1.96 x standard deviation of the mean difference between the lactate threshold and the maximal lactate steady state). The dotted diagonal lines represent the boundaries of the 95% CI for MLSS reliability (CV = 3.0%; 95%; CI = 3.8%) calculated from Hauser et al., 2014).
Although the original Dmaxmethod is a commonly cited method for determining the LT [23], we observed large mean differences (19 to 49 W) between the Dmaxand MLSS. Three pre-vious studies have purported to investigate the validity of this method to estimate the MLSS in trained male cyclists [15,52,53]. One concluded that the Dmaxmethod derived from GXT3 was a valid estimation of the MLSS (r = 0.97) [54]. We also observed a high correlation between Dmaxand the MLSS (r = 0.94 to 0.97) (Table 1), but, as indicated by the MD and other measures, a high correlation is not sufficient to establish validity [55]. Another study examined Dmaxderived from two GXTs with similar durations (36 vs. 39 min), but with different stage lengths (30-s vs. 6-min) [15]. The Dmaxderived from GXT30swas not correlated (r = 0.51) with the MLSS, even though the MD was 5 W, whilst the Dmaxderived from GXT6was correlated (r = 0.85); however, it underestimated the MLSS (MD = 22 W). The third study concluded the Dmaxderived from GXT1yielded poor estimates of the MLSS (r = 0.56; bias = -1.8± 38.1 W) [53]. Thus, although some studies [15,54] have used correlation analysis to suggest the Dmax provides a valid estimate of the MLSS, this is not supported by the more comprehensive assess-ment of validity performed in the present and other studies [53].
There were five fixed blood LT methods and one baseline plus an absolute value that met our inclusion criteria, and, as previously reported [15,24], these varied with the GXT protocol used. The baseline + 1.5 mmol.L-1was the only LT derived from GXT3included in our analysis (bias = -6± 35 W). This is consistent with the results of one previous study (bias = 0.5 ± 24 W), which also recruited trained male cyclists and had a similar GXT protocol design [56]. Consistent with our findings, this study also reported that an OBLA of 3.5 mmol.L-1derived from GXT3did not provide a valid estimation of the MLSS. In contrast, another study con-firmed the validity of the OBLA of 3.5 mmol.L-1[52], despite recruiting trained cyclists and using an identical GXT protocol. These conflicting results are likely attributable to the low reproducibility of the OBLA methods [16].
While none of the OBLAs from GXT3met our inclusion criteria, the OBLA methods of 2.5 mmol.L-1derived from GXT4and GXT7provided valid estimations of the MLSS, as did the OBLA of 3.0 mmol.L-1derived from GXT7and GXT10. The OBLA of 3.5 mmol.L-1from GXT10was the highest fixed blood LT that identified the MLSS. There is no previous data investigating the validity of these OBLA methods. However, it is worth noting that these five methods provided superior estimations of the MLSS compared with the original ModDmax, but were less favourable than the newly-developed ModDmaxmethods.
An OBLA of 4.0 mmol.L-1is the most commonly-accepted fixed blood lactate value for esti-mating the LT or MLSS. Three previous studies have attempted to validate use of an OBLA of 4.0 mmol.L-1with cycle ergometry [15,53,57]. One study found that it overestimated the MLSS (MD = 49 W) when derived from GXT1[53]. The other study reported poor agreement (bias 7± 49 W) when OBLA of 4.0 mmol.
L-1was derived from GXT4[57]. The final study observed a poor correlation between an OBLA of 4.0 mmol.L-1and the MLSS (r = 0.71) [15]. Our results indicated the OBLA of 4.0 mmol.L-1overestimated the MLSS across all GXTs.
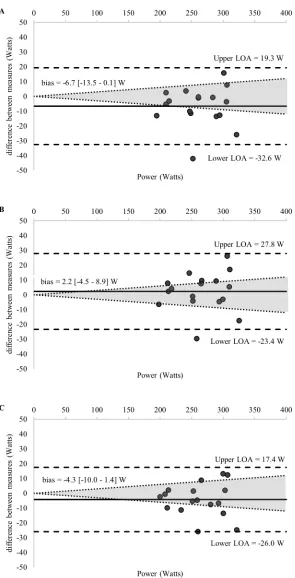
Fig 5. (A-D) Bland-Altman plots displaying agreement between measures of the power associated with the (A) OBLA
2.5 mmol.L-1, (B) Modified Dmax, (C) Log-Poly-Modified Dmax, (D) Log-Exp-Modified Dmaxcalculated from GXT4
and the MLSS. The differences between measures (y-axis) are plotted as a function of the mean of the two measures (x-axis) in power (Watts). The horizontal solid line represents the mean difference between the two measures (i.e., bias). The two horizontal dashed lines represent the limits of agreement (1.96 x standard deviation of the mean difference between the lactate threshold and the maximal lactate steady state). The dotted diagonal lines represent the boundaries of the 95% CI for MLSS reliability (CV = 3.0%; 95%; CI = 3.8%) calculated from Hauser et al., 2014) (log = Modified Dmaxmethod using the log-log method as the point of the initial lactate point; poly = Modified Dmaxmethod calculated
using a third order polynomial regression equation; exp = Modified Dmaxmethod calculated using a constant plus
exponential regression equation; OBLA = onset of blood lactate accumulation.).
Fig 6. (A-C) Bland-Altman plots displaying agreement between measures of the power associated with the (A) OBLA
2.5 mmol.L-1(GXT
7), (B) OBLA 3.0 mmol.L-1(GXT7), (C) Log-Exp-Modified Dmaxcalculated from GXT7and the
Thus, in agreement with previous research, our results indicate; the OBLA of 4.0 mmol.L-1 does not accurately estimate the MLSS. It is also worth noting that the original authors cau-tioned the use of this OBLA method, given the lack of a significant correlation when compar-ing OBLA methods from a GXT and the MLSS [24].
The RCP derived from an 8- to 12-minute GXT consistently overestimates the MLSS [44, 53], and this was confirmed in our study (Table 1). Therefore, we used a regression equation based on the RCP (RCPMLSS) (Eq 5) to estimate the starting intensity for establishing the MLSS [33]. Our results indicate there was good agreement between the MLSS and RCPMLSS
CI for MLSS reliability (CV = 3.0%; 95%; CI = 3.8%) calculated from Hauser et al., 2014) (log = Modified Dmaxmethod
using the log-log method as the point of the initial lactate point; exp = Modified Dmaxmethod calculated using a
constant plus exponential regression equation; OBLA = onset of blood lactate accumulation.).
https://doi.org/10.1371/journal.pone.0199794.g006
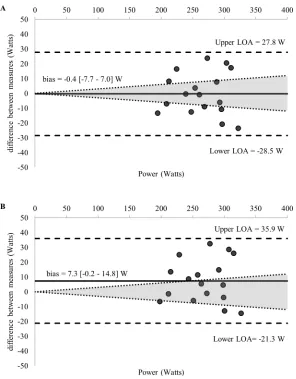
Fig 7. (A-B) Bland-Altman plots displaying agreement between measures of the power associated with the (A) OBLA
3.0 mmol.L-1, (B) OBLA 3.5 mmol.L-1calculated from GXT
10and the MLSS. The differences between measures
(y-axis) are plotted as a function of the mean of the two measures (x-(y-axis) in power (Watts). The horizontal solid line represents the mean difference between the two measures (i.e., bias). The two horizontal dashed lines represent the limits of agreement (1.96 x standard deviation of the mean difference between the lactate threshold and the maximal lactate steady state). The dotted diagonal lines represent the boundaries of the 95% CI for MLSS reliability (CV = 3.0%; 95%; CI = 3.8%) calculated from Hauser et al., 2014) (OBLA = onset of blood lactate accumulation.).
(Table 3). Nonetheless, for many participants the difference between MLSS and RCPMLSS exceeded the CV% for the MLSS (Fig 3). Therefore, although the RCPMLSScan be used as a convenient ‘starting point’ when establishing the MLSS, we recommend methods based on blood sampling from the current study and assessing blood lactate kinetics in real time as rec-ommended by Hering et al. [58] for a more accurate estimation of the MLSS.
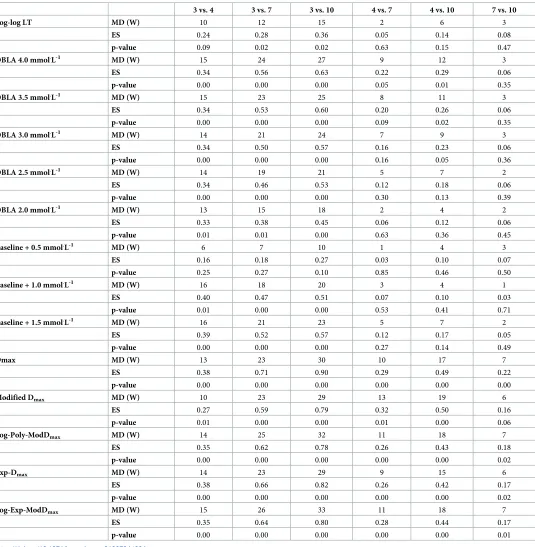
Table 4. Mean difference (MD), effect size (ES), and p-value comparing the influence of graded exercise test stage length on all 14 lactate threshold methods.
3 vs. 4 3 vs. 7 3 vs. 10 4 vs. 7 4 vs. 10 7 vs. 10
Log-log LT MD (W) 10 12 15 2 6 3
ES 0.24 0.28 0.36 0.05 0.14 0.08
p-value 0.09 0.02 0.02 0.63 0.15 0.47
OBLA 4.0 mmol.L-1 MD (W) 15 24 27 9 12 3
ES 0.34 0.56 0.63 0.22 0.29 0.06
p-value 0.00 0.00 0.00 0.05 0.01 0.35
OBLA 3.5 mmol.L-1 MD (W) 15 23 25 8 11 3
ES 0.34 0.53 0.60 0.20 0.26 0.06
p-value 0.00 0.00 0.00 0.09 0.02 0.35
OBLA 3.0 mmol.L-1 MD (W) 14 21 24 7 9 3
ES 0.34 0.50 0.57 0.16 0.23 0.06
p-value 0.00 0.00 0.00 0.16 0.05 0.36
OBLA 2.5 mmol.L-1 MD (W) 14 19 21 5 7 2
ES 0.34 0.46 0.53 0.12 0.18 0.06
p-value 0.00 0.00 0.00 0.30 0.13 0.39
OBLA 2.0 mmol.L-1 MD (W) 13 15 18 2 4 2
ES 0.33 0.38 0.45 0.06 0.12 0.06
p-value 0.01 0.01 0.00 0.63 0.36 0.45
Baseline + 0.5 mmol.L-1 MD (W) 6 7 10 1 4 3
ES 0.16 0.18 0.27 0.03 0.10 0.07
p-value 0.25 0.27 0.10 0.85 0.46 0.50
Baseline + 1.0 mmol.L-1 MD (W) 16 18 20 3 4 1
ES 0.40 0.47 0.51 0.07 0.10 0.03
p-value 0.01 0.00 0.00 0.53 0.41 0.71
Baseline + 1.5 mmol.L-1 MD (W) 16 21 23 5 7 2
ES 0.39 0.52 0.57 0.12 0.17 0.05
p-value 0.00 0.00 0.00 0.27 0.14 0.49
Dmax MD (W) 13 23 30 10 17 7
ES 0.38 0.71 0.90 0.29 0.49 0.22
p-value 0.00 0.00 0.00 0.00 0.00 0.00
Modified Dmax MD (W) 10 23 29 13 19 6
ES 0.27 0.59 0.79 0.32 0.50 0.16
p-value 0.01 0.00 0.00 0.01 0.00 0.06
Log-Poly-ModDmax MD (W) 14 25 32 11 18 7
ES 0.35 0.62 0.78 0.26 0.43 0.18
p-value 0.00 0.00 0.00 0.00 0.00 0.02
Exp-Dmax MD (W) 14 23 29 9 15 6
ES 0.38 0.66 0.82 0.26 0.42 0.17
p-value 0.00 0.00 0.00 0.00 0.00 0.02
Log-Exp-ModDmax MD (W) 15 26 33 11 18 7
ES 0.35 0.64 0.80 0.28 0.44 0.17
p-value 0.00 0.00 0.00 0.00 0.00 0.01
Although a single GXT can be used to estimate bothVO_ 2maxand LT, the optimal test dura-tion for each measure is different [11,13]. To address this challenge, we added a supramaximal VEB after each GXT, equivalent to that performed following GXT1, expecting all VEBs would yield similarVO_ 2values. However, theVO_ 2peakvalues from the VEB after the longer duration GXTs underestimated theVO_ 2peakfrom GXT1. Although theVO_ 2peakvalues from GXT3and GXT4were similar to GXT1, the differences were larger than the typical coefficient of variabil-ity forVO_ 2peak(CV<3%) [59]. Our results are consistent with previous recommendations that longer duration GXTs are not optimal for establishingVO_ 2peak[10,60]. Furthermore, while a VEB can be used to verify thatVO_ 2peakwas achieved, it appears that a VEB following a prolonged GXT cannot be used to establishVO_ 2max.
Extending the duration of the GXT stages results in a lowerW_ max[61]. This has implica-tions for exercise prescription, as it is common in sport and exercise science research to pre-scribe exercise intensity as a percentage ofW_max. For example, in the present study the MLSS ranged from 63± 4% (range = 52 to 72%) ofW_ maxfrom GXT1to 82± 4% (range = 74 to 88%)
Table 5. Mean and standard deviation ofVO_ 2max—highest measuredVO_ 2during any graded exercise test (GXT); GXTVO_ 2-highest measuredVO_ 2during each
GXT; VEBVO_ 2highest measuredVO_ 2during each verification exhaustive bout (VEB);VO_ 2peak, highest measuredVO_ 2during either the GXT or corresponding
VEB. Mean and standard deviation of GXT duration, max power (Watts) from each GXT, percentage of maximum power from the prolonged GXT expressed as a
per-centage of W maximum power from GXT1and power of each VEB (Watts) from the GXTs. Relative power of the verification exhaustive bout expressed as a percentage
(%) of the maximal power measured during the GXT. The subscript (i.e., 1, 3, 4, 7 or 10) refers to the stage duration (minutes) for each test.
GXT1 GXT3 GXT4 GXT7 GXT10
_
VO2max(mL .
kg-1.min-1) 62.1± 5.8
GXTVO_ 2(mL .
kg-1.min-1) 60.6± 5.4 58.2± 5.3 57.3± 5.7 56.4± 5.2 54.9± 4.9
VEBVO_ 2(mL
.kg-1.min-1) 60.1± 5.8 58.9± 5.9 58.8± 6.1 56.4± 5.9 54.7± 6.6 _
VO2peak(mL .
kg-1.min-1) 61.0± 5.3 59.7± 5.4 58.9± 6.0 57.3± 5.4 56.2± 5.5
GXT Duration (min) 11.3± 0.9 26.8± 1.4 34.9± 1.9 59.2± 3.3 81.6± 4.6
Maximum Power (Watts) 420± 55 337± 46 321± 47 303± 43 295± 43
PercentW_maxof GXT1(%) 100 80.3± 2.9 76.4± 3.1 72.1± 3.6 70.3± 4.0
VEB (Watts) 378± 50
VEB (% of GXTW_max) 90 109.7± 3.8 118.4± 18.7 125.4± 19.3 128.8± 20.4
https://doi.org/10.1371/journal.pone.0199794.t005
Table 6. Mean difference (MD) and standard deviation, effect size (ES), coefficient of the variation (CV) and p-value (p) for the measuredVO_ 2peakvalues from
GXT1compared with theVO_ 2peakvalues from GXT3, GXT4, GXT7, and GXT10and for theVO_ 2peakvalues from GXT1compared with theVO_ 2peakvalues from the
VEB following GXT3, GXT4, GXT7, and GXT10. The subscript (i.e., 1, 3, 4, 7 or 10) refers to the stage duration (minutes) for each test.
GXT1vs. GXT3 GXT1vs. GXT4 GXT1vs. GXT7 GXT1vs. GXT10
MD (mL.kg-1.min-1) -1.2± 3.3 -2.1± 4.2 -3.7± 4.7 -4.8± 3.7
ES 0.23 0.36 0.69 0.88
CV (%) 3.8 4.9 5.6 4.6
p 0.13 0.06 <0.01 <0.01
GXT1vs. VEB GXT3 GXT1vs. VEB GXT4 GXT1vs. VEB GXT7 GXT1vs. VEB GXT10
MD (mL.kg-1.min-1) -2.1± 5.9 -2.1± 6.1 -4.6± 5.9 -6.2± 6.6
ES 0.37 0.37 0.81 1.04
CV (%) 4.2 4.9 6.1 5.9
p 0.02 0.98 0.03 0.03
ofW_ maxfrom GXT4. Prescribing exercise in the current study cohort at a fixed percentage of
_
Wmax(e.g., 73% ofW_ max), would result in all participants exercising above or below the MLSS, GXT1and GXT4, respectively. This is important as it has previously been reported that pre-scribing exercise relative to LT results in a more homogenous physiological response than when exercise performed relative toW_max[62]. This also highlights why it is important to con-sider the GXT protocol and the method used to determine relative exercise intensity when comparing results between studies.
The wide range ofW_ maxfor each GXT is also note-worthy, theW_maxrange for GXT1was 320 to 517 W and the duration ranged from 9 to 12 minutes. Had we employed a standardized GXT (e.g., 35 W increments), and assumingW_ maxstayed constant, the range would have been 9- to 15 min. Applying this to our longer duration GXTs resulted in a homogenous duration (GXT4: 32- to 39 min), whereas a standardised approach (e.g., 35 W increments) would have resulted in a range of 27- to 46 min [57]. Thus, individualizing GXT protocol design is a useful approach to ensure homogenous test duration [17].
Conclusion
In conclusion, the traditional Dmaxand OBLA of 4.0 mmol .
L-1did not provide valid estimates of the MLSS. The best estimation of the MLSS was the Log-Poly-ModDmaxderived from GXT4. The validity of our newly-developed ModDmaxmodel may relate to the objectivity for determining the initial rise in blood lactate concentration. However, we must advise caution with the use of our newly-developed method until future research investigates the reliability and reproducibility. It is apparent that bothVO_ 2maxand LT cannot be determined in a single GXT, even if the GXT is followed by a VEB. Therefore, to appropriately determineVO_ 2maxthe optimum duration of a GXT is 8–12 minutes and theVO_ 2values measured during the GXT
and VEB be within 3% = CV [63]. Our data also highlight how differences in GXT protocol design and methods used to calculate the relative exercise intensity may contribute to the con-flicting findings reported in the literature.
Author Contributions
Conceptualization: Nicholas A. Jamnick, Javier Botella, David B. Pyne, David J. Bishop. Data curation: Nicholas A. Jamnick, Javier Botella, David B. Pyne, David J. Bishop. Formal analysis: Nicholas A. Jamnick, Javier Botella, David B. Pyne, David J. Bishop. Investigation: Nicholas A. Jamnick, Javier Botella, David J. Bishop.
Methodology: Nicholas A. Jamnick, Javier Botella, David B. Pyne, David J. Bishop. Project administration: Nicholas A. Jamnick, David J. Bishop.
Resources: Nicholas A. Jamnick, Javier Botella, David J. Bishop. Software: Nicholas A. Jamnick.
Supervision: David B. Pyne.
Validation: Nicholas A. Jamnick, Javier Botella, David J. Bishop. Visualization: Javier Botella.
Writing – review & editing: Nicholas A. Jamnick, Javier Botella, David B. Pyne, David J.
Bishop.
References
1. Skinner JS, McLellan TH. The transition from aerobic to anaerobic metabolism. Research Quarterly for Exercise and Sport. 1980; 51(1):234–48.https://doi.org/10.1080/02701367.1980.10609285PMID: 7394286
2. Londeree BR. Effect of training on lactate/ventilatory thresholds: a meta-analysis. Medicine and Sci-ence in Sport and Exercise. 1997; 29(6):837–43. PMID:9219214
3. Wenger HA, Bell GJ. The interactions of intensity, frequency and duration of exercise training in altering cardiorespiratory fitness. Sports Medicine. 1986; 3(5):346–56. PMID:3529283
4. Mann T, Lamberts RP, Lambert MI. Methods of prescribing relative exercise intensity: physiological and practical considerations. Sports Medicine. 2013; 43(7):613–25. https://doi.org/10.1007/s40279-013-0045-xPMID:23620244
5. Coen B, Schwarz L, Urhausen A, Kindermann W. Control of training in middle-and long-distance run-ning by means of the individual anaerobic threshold. International Journal of Sports Medicine. 1991; 12 (06):519–24.
6. Granata C, Jamnick NA, Bishop DJ. Principles of Exercise Prescription, and How They Influence Exer-cise-Induced Changes of Transcription Factors and Other Regulators of Mitochondrial Biogenesis. Sports Medicine. 2018:1–19.
7. Gonza´lez-Haro C. Differences in Physiological Responses Between Short-vs. Long-Graded Laboratory Tests in Road Cyclists. Journal of Strength and Conditioning Research. 2015; 29(4):1040–8.https://doi. org/10.1519/JSC.0000000000000741PMID:25330085
8. McNaughton LR, Roberts S, Bentley DJ. The relationship among peak power output, lactate threshold, and short-distance cycling performance: effects of incremental exercise test design. Journal of Strength and Conditioning Research. 2006; 20(1):157.https://doi.org/10.1519/R-15914.1PMID:16506862 9. Bentley D, McNaughton L, Batterham A. Prolonged stage duration during incremental cycle exercise:
effects on the lactate threshold and onset of blood lactate accumulation. European Journal of Applied Physiology. 2001; 85(3–4):351–7.https://doi.org/10.1007/s004210100452PMID:11560091 10. Poole DC, Jones AM. Measurement of the maximum oxygen uptakeVo_ 2max: _Vo2peakis no longer
acceptable. Journal of Applied Physiology. 2017; 122(4):997–1002.https://doi.org/10.1152/ japplphysiol.01063.2016PMID:28153947
11. Buchfuhrer MJ, Hansen JE, Robinson TE, Sue DY, Wasserman K, Whipp BJ. Optimizing the exercise protocol for cardiopulmonary assessment. Journal of Applied Physiology. 1983; 55(5):1558–64.https:// doi.org/10.1152/jappl.1983.55.5.1558PMID:6643191
12. Yoon B-K, Kravitz L, Robergs R. VO2max, Protocol Duration, and the VO2 Plateau. Medicine and Sci-ence in Sport and Exercise. 2007; 39(7):1186–92.https://doi.org/10.1249/mss.0b13e318054e304 PMID:17596788
13. Bentley DJ, Newell J, Bishop D. Incremental exercise test design and analysis. Sports Medicine. 2007; 37(7):575–86. PMID:17595153
14. Foxdal P, Sjo¨din A, Sjo¨din B. Comparison of blood lactate concentrations obtained during incremental and constant intensity exercise. International Journal of Sports Medicine. 1996; 17(05):360–5. 15. Van Schuylenbergh R, Vanden EB, Hespel P. Correlations between lactate and ventilatory thresholds
and the maximal lactate steady state in elite cyclists. International Journal of Sports Medicine. 2004; 25 (6):403–8.https://doi.org/10.1055/s-2004-819942PMID:15346226
16. Morton RH, Stannard SR, Kay B. Low reproducibility of many lactate markers during incremental cycle exercise. British Journal of Sports Medicine. 2012; 46(1):64–9.https://doi.org/10.1136/bjsm.2010. 076380PMID:21343140
17. Pettitt R, Clark I, Ebner S, Sedgeman D, Murray S. Gas Exchange Threshold and VO2max Testing for Athletes: An Update. Journal of Strength and Conditioning Research. 2013; 27(2):549–55.https://doi. org/10.1519/JSC.0b013e31825770d7PMID:22531615
18. Faude O, Kindermann W, Meyer T. Lactate threshold concepts. Sports Medicine. 2009; 39(6):469–90. https://doi.org/10.2165/00007256-200939060-00003PMID:19453206
20. Kindermann W, Simon G, Keul J. Significance of the aerobic-anaerobic transition for the determination of work load intensities during endurance training. European Journal of Applied Physiology and Occu-pational Physiology. 1979; 42(1):25–34.https://doi.org/10.1007/bf00421101PubMed PMID: WOS: A1979HN15900003. PMID:499194
21. Heck H, Mader A, Hess G, Mucke S, Muller R, Hollmann W. Justification of the 4-mmol/L lactate thresh-old. International Journal of Sports Medicine. 1985; 6(3):117–30. https://doi.org/10.1055/s-2008-1025824PubMed PMID: WOS:A1985ALS1800002. PMID:4030186
22. Bishop D, Jenkins DG, Mackinnon LT. The relationship between plasma lactate parameters, Wpeak and 1-h cycling performance in women. Medicine and Science in Sports and Exercise. 1998; 30 (8):1270–5. PMID:9710868
23. Cheng B, Kuipers H, Snyder A, Keizer H, Jeukendrup A, Hesselink M. A new approach for the determi-nation of ventilatory and lactate thresholds. Interdetermi-national Journal of Sports Medicine. 1992; 13(7):518– 22.https://doi.org/10.1055/s-2007-1021309PMID:1459746
24. Heck H, Mader A, Hess G, Mu¨cke S, Mu¨ller R, Hollmann W. Justification of the 4-mmol/l lactate thresh-old. International Journal of Sports Medicine. 1985;(6):117–30.
25. Billat VL, Sirvent P, Py G, Koralsztein J-P, Mercier J. The concept of maximal lactate steady state. Sports Medicine. 2003; 33(6):407–26. PMID:12744715
26. Beneke R. Methodological aspects of maximal lactate steady state—implications for performance test-ing. European Journal of Applied Physiology. 2003; 89(1):95–9. https://doi.org/10.1007/s00421-002-0783-1PMID:12627312
27. Hauser T, Bartsch D, Baumga¨rtel L, Schulz H. Reliability of maximal lactate-steady-state. International Journal of Sports Medicine. 2013; 34(3):196–9.https://doi.org/10.1055/s-0032-1321719PMID: 22972242
28. Hill AV, Long C, Lupton H. Muscular exercise, lactic acid, and the supply and utilisation of oxygen. Pro-ceedings of the Royal Society of London Series B, Containing Papers of a Biological Character. 1924; 97(681):84–138.
29. Riebe D, Franklin BA, Thompson PD, Garber CE, Whitfield GP, Magal M, et al. Updating ACSM’s rec-ommendations for exercise preparticipation health screening. Medicine and Science in Sport and Exer-cise. 2015; 47(11):2473–9.https://doi.org/10.1249/MSS.0000000000000664PMID:26473759 30. Jamnick NA, By S, Pettitt CD, Pettitt RW. Comparison of the YMCA and a Custom Submaximal
Exer-cise Test for Determining VO2max. Medicine and Science in Sport and ExerExer-cise. 2016; 48(2):254–9. https://doi.org/10.1249/MSS.0000000000000763PMID:26339726
31. Jackson AS, Blair SN, Mahar MT, Wier LT, Ross RM, Stuteville JE. Prediction of functional aerobic capacity without exercise testing. Medicine and Science in Sports and Exercise. 1990; 22(6):863–70. Epub 1990/12/01. PMID:2287267.
32. Medicine ACoS. ACSM’s guidelines for exercise testing and prescription: Lippincott Williams & Wilkins; 2013.
33. Smekal G, von Duvillard SP, Pokan R, Hofmann P, Braun WA, Arciero PJ, et al. Blood lactate concen-tration at the maximal lactate steady state is not dependent on endurance capacity in healthy recreation-ally trained individuals. European Journal of Applied Physiology. 2012; 112(8):3079–86.https://doi.org/ 10.1007/s00421-011-2283-7PMID:22194004
34. Beaver W, Wasserman K, Whipp B. A new method for detecting anaerobic threshold by gas exchange. Journal of Applied Physiology. 1986; 60(6):2020–7.https://doi.org/10.1152/jappl.1986.60.6.2020 PMID:3087938
35. Whipp BJ, Davis JA, Wasserman K. Ventilatory control of the ‘isocapnic buffering’region in rapidly-incre-mental exercise. Respiration Physiology. 1989; 76(3):357–67. PMID:2501844
36. Caiozzo VJ, Davis JA, Ellis JF, Azus JL, Vandagriff R, Prietto C, et al. A comparison of gas exchange indices used to detect the anaerobic threshold. Journal of Applied Physiology. 1982; 53(5):1184–9. https://doi.org/10.1152/jappl.1982.53.5.1184PMID:7174412
37. Beaver W, Wasserman K, Whipp B. Improved detection of lactate threshold during exercise using a log-log transformation. Journal of Applied Physiolog-logy. 1985; 59(6):1936–40.https://doi.org/10.1152/jappl. 1985.59.6.1936PMID:4077801
38. Kindermann W, Simon G, Keul J. The significance of the aerobic-anaerobic transition for the determina-tion of work load intensities during endurance training. European Journal of Applied Physiology and Occupational Physiology. 1979; 42(1):25–34. PMID:499194
39. Zoladz JA, Rademaker A, Sargeant AJ. Non-linear relationship between O2 uptake and power output at high intensities of exercise in humans. Journal of Physiology. 1995; 488(Pt 1):211.
41. Machado FA, Nakamura FY, Moraes SMFD. Influence of regression model and incremental test proto-col on the relationship between lactate threshold using the maximal-deviation method and performance in female runners. Journal of Sports Sciences. 2012; 30(12):1267–74.https://doi.org/10.1080/ 02640414.2012.702424PMID:22775431
42. Hughson RL, Weisiger KH, Swanson GD. Blood lactate concentration increases as a continuous func-tion in progressive exercise. Journal of Applied Physiology. 1987; 62(5):1975–81.https://doi.org/10. 1152/jappl.1987.62.5.1975PMID:3597269
43. Lamarra N, Whipp BJ, Ward SA, Wasserman K. Effect of interbreath fluctuations on characterizing exercise gas exchange kinetics. Journal of Applied Physiology. 1987; 62(5):2003–12.https://doi.org/10. 1152/jappl.1987.62.5.2003PMID:3110126
44. Keir DA, Fontana FY, Robertson TC, Murias JM, Paterson DH, Kowalchuk JM, et al. Exercise Intensity Thresholds: Identifying the Boundaries of Sustainable Performance. Medicine and Science in Sport and Exercise. 2015; 47(9):1932–40.https://doi.org/10.1249/MSS.0000000000000613PMID:25606817 45. Keir DA, Murias JM, Paterson DH, Kowalchuk JM. Breath-by-breath pulmonary O2 uptake kinetics:
effect of data processing on confidence in estimating model parameters. Experimental Physiology. 2014; 99(11):1511–22.https://doi.org/10.1113/expphysiol.2014.080812PMID:25063837 46. Lawrence I, Lin K. A concordance correlation coefficient to evaluate reproducibility. Biometrics.
1989:255–68. PMID:2720055
47. Bland JM, Altman D. Statistical methods for assessing agreement between two methods of clinical mea-surement. The Lancet. 1986; 327(8476):307–10.
48. Hopkins W. Analysis of validity by linear regression (Excel spreadsheet). 2015; 19:36–44.
49. Hopkins W. Measures of reliability in sports medicine and science. Sports Medicine. 2000; 30(1):1–15. PMID:10907753
50. Hopkins W, Marshall S, Batterham A, Hanin J. Progressive statistics for studies in sports medicine and exercise science. Medicine and Science in Sports and Exercise. 2009; 41(1):3.https://doi.org/10.1249/ MSS.0b013e31818cb278PMID:19092709
51. Cohen J. A power primer. Psychological Bulletin. 1992; 112(1):155. PMID:19565683
52. Denadai B, Figueira T, Favaro O, Gonc¸alves M. Effect of the aerobic capacity on the validity of the anaerobic threshold for determination of the maximal lactate steady state in cycling. Brazilian Journal of Medical and Biological Research. 2004; 37(10):1551–6.https://doi.org//S0100-879X2004001000015 PMID:15448877
53. Pallare´s JG, Mora´n-Navarro R, Ortega JF, Ferna´ndez-Elı´as VE, Mora-Rodriguez R. Validity and Reli-ability of Ventilatory and Blood Lactate Thresholds in Well-Trained Cyclists. PloS one. 2016; 11(9): e0163389.https://doi.org/10.1371/journal.pone.0163389PMID:27657502
54. Czuba M, Zając A, Cholewa J, Poprzęcki S, Waśkiewicz Z, Mikołajec K. Lactate threshold (D-max method) and maximal lactate steady state in cyclists. Journal of Human Kinetics. 2009; 21:49–56. 55. Aldrich J. Correlations genuine and spurious in Pearson and Yule. Statistical Science. 1995:364–76. 56. Grossl T, De Lucas RD, De Souza KM, Antonacci Guglielmo LG. Maximal lactate steady-state and
anaerobic thresholds from different methods in cyclists. European Journal of Sport Science. 2012; 12 (2):161–7.
57. Hauser T, Adam J, Schulz H. Comparison of selected lactate threshold parameters with maximal lactate steady state in cycling. International Journal of Sports Medicine. 2014; 35(6):517–21.https://doi.org/10. 1055/s-0033-1353176PMID:24227122
58. Hering GO, Hennig EM, Riehle HJ, Stepan J. A Lactate Kinetics Method for Assessing the Maximal Lac-tate Steady SLac-tate Workload. Frontiers in Physiology. 2018; 9(310).https://doi.org/10.3389/fphys.2018. 00310PMID:29651253
59. Kirkeberg J, Dalleck L, Kamphoff C, Pettitt R. Validity of 3 protocols for verifying VO2max. International Journal of Sports Medicine. 2011; 32(04):266–70.
60. Bishop D, Jenkins DG, Mackinnon LT. The effect of stage duration on the calculation of peak VO2 dur-ing cycle ergometry. Journal of Science and Medicine in Sport. 1998; 1(3):171–8. PMID:9783518 61. Adami A, Sivieri A, Moia C, Perini R, Ferretti G. Effects of step duration in incremental ramp protocols
on peak power and maximal oxygen consumption. European Journal of Applied Physiology. 2013; 113 (10):2647–53.https://doi.org/10.1007/s00421-013-2705-9PMID:23949790
62. Baldwin J, Snow RJ, Febbraio MA. Effect of training status and relative exercise intensity on physiological responses in men. Medicine and Science in Sport and Exercise. 2000; 32(9):1648–54. PMID:10994919 63. Pettitt RW, Jamnick NA. Commentary on “Measurement of the maximum oxygen uptakeVo_ 2max:
_