University of South Carolina
Scholar Commons
Theses and Dissertations
Spring 2019
Metal-Organic Frameworks: Photophysics, Energy
Transfer, and Electronic Structure
Ekaterina A. Dolgopolova
Follow this and additional works at:https://scholarcommons.sc.edu/etd Part of theChemistry Commons
This Open Access Dissertation is brought to you by Scholar Commons. It has been accepted for inclusion in Theses and Dissertations by an authorized administrator of Scholar Commons. For more information, please [email protected].
Recommended Citation
METAL-ORGANIC FRAMEWORKS:
PHOTOPHYSICS, ENERGY TRANSFER, AND ELECTRONIC STRUCTURE
by
Ekaterina A. Dolgopolova Bachelor of Materials Science
Lomonosov Moscow State University, 2013
Submitted in Partial Fulfillment of the Requirements For the Degree of Doctor of Philosophy in
Chemistry
College of Arts and Sciences University of South Carolina
2019 Accepted by:
Natalia B. Shustova, Major Professor Hans-Conrad zur Loye, Committee Member
Andrew B. Greytak, Committee Member Yanwen Wu, Committee Member
DEDICATION
ACKNOWLEDGEMENTS
I would like to express my gratitude to all people who were a great help to me
throughout my Ph.D.
First, I would like to thank my research advisor, Dr. Natalia Shustova, for her
continuous support during my time at the University of South Carolina. I will always be
grateful for her guidance, patience, and motivation during this journey. Thank you for
everything you have taught me and all the help you have given me.
I would also like to thank my committee members: Dr. zur Loye, Dr. Greytak, and
Dr. Wu for all of your helpful comments, which not only made my work better, but
helped me to grow as a scientist.
Next, special thanks have to go to past and present members of the Shustova Lab.
To Derek Williams for mentoring me in the lab, as I have learned a lot from you and I
really appreciate the time spent working with you. To my not only a lab mate but also a
great friend, Allison Rice, for all your help and support in science and in life in general,
thank you for sharing this journey with me. Thank you to Otega Ejegbavwo, Brandon
Yarbrough, Gabrielle Leith, Corey Martin, Richard Ly, Vladimir Galitskiy, and Anna
Berseneva for your constant help and support. It was a great pleasure to work and learn
alongside all of you. I also want to thank all my friends from around the world for their
encouragement and help. Lastly, I want to give my sincerest gratitude to my family for
ABSTRACT
The current landscape of technological and industrial related fields is looking for
novel materials with enhanced performances, which will not only improve various fields
in science, but also can ensure increased environmental safety. Recently, metal-organic
frameworks (MOFs) have been shown as a promising type of material for a wide range of
applications including gas storage and separation, sensing, and heterogeneous catalysis.
The main advantages of MOFs rely on their modular structures as well as their porosity.
For instance, the modular nature of MOFs provides a control over chromophore
arrangement, systematic tuning of ligand design and synthetic conditions allowing one to
systematically tune photophysical or electronic properties. Thus, these materials could be
utilized as a tool to address the current need in enhancement of material performance.
This work presented within the following nine chapters is focused on the design,
synthesis, and characterization of MOFs that target fundamental understanding of
photophysical properties, energy transfer processes, and the ability to tune electronic
structures of these materials. The first chapter reviews MOF applications in areas for
which development is highly dependent on fundamental studies of MOF photophysics.
Next four chapters discuss a utilization of MOF as an efficient replica of a protein β -barrel to maintain chromophore emission. The major principles governing chromophore
photophysical response inside a confined environment are examined. Chapters six and
seven describe the key factors responsible for tunability of MOF electronic structure as a
demonstrates the unprecedented role of MOF modularity necessary for engineering of
radionuclide containing materials. Finally, chapter nine reveals the possibility of MOF
electronic structure modulation as a function of external light stimuli.
Overall, this work shows the possibility of MOF engineering towards various
TABLE OF CONTENTS
Dedication ... iii
Acknowledgements ... iv
Abstract ...v
List of Tables ... viii
List of Figures ...x
List of Schemes ... xxi
Chapter 1: Metal–organic Framework Photophysics: Optoelectronic Devices, Photoswitches, Sensors, and Photocatalysts ...1
Chapter 2: A Bio-inspired Approach for Chromophore Communication: Ligand-to-Ligand and Host-to-Guest Energy Transfer in Hybrid Crystalline Scaffolds ...19
Chapter 3: Photophysics of GFP-related Chromophores Imposed by a Scaffold Design ...62
Chapter 4: Photophysics, Dynamics, and Energy Transfer in Rigid Mimics of GFP- based Systems ...97
Chapter 5: A Metal-Organic Framework as a Flask: Photophysics of Confined Chromophores with a Benzylidene Imidazolinone Core ...153
Chapter 6: Active Sites in Copper-Based Metal−Organic Frameworks: Understanding Substrate Dynamics, Redox Processes, and Valence- Band Structure ...183
Chapter 7: Electronic Properties of Bimetallic Metal−Organic Frameworks (MOFs): Tailoring the Density of Electronic States through MOF Modularity ...222
Chapter 8: Multifaceted Modularity: A Key for Stepwise Building of Hierarchical Complexity in Actinide Metal−Organic Frameworks ...264
Chapter 9: Connecting Wires: Photoinduced Electronic Structure Modulation in Metal-Organic Frameworks ...331
LIST OF TABLES
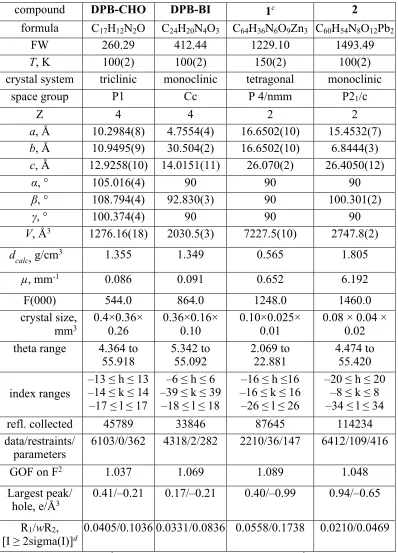
Table 2.1. The amplitude-weighted average lifetimes (tav), ET rate constants (kET), Förster critical radii (Ro), ET efficiency (FET), and spectral overlap functions (J) for DPB-BI, DPB-BI-1, DPB-BI-1¢, BI, and BI@2 samples ...29 Table 2.2. X-ray structure refinement data for DPB-CHO, DPB-BI, BI, 1, and 2 ...53 Table 3.1. X-ray structure refinement data for 1 and MeO-oHBI ...83 Table 4.1. X-ray structure refinement data for OH-oHBI, Me-oHBI, tBu-oHBI,
and EC-oHBI ...145 Table 4.2. X-ray structure refinement data for F-oHBI, Cl-oHBI, Me-BI,
and MeO-BI ...146 Table 4.3. X-ray structure refinement data for F-BI, Cl-BI, and Br-BI ...147 Table 5.1. X-ray structure refinement data for pCOOH-BI-CO2Me and pCOOH-BIi ...179 Table 6.1. Calculated adsorption energies and natural charges for the adsorption of different gas molecules on the Cu+2/Cu+2 dimer of the neutral Cu2(BTC)4 unit and
Cu+1/Cu+2 dimer of the negatively charged Cu2(BTC)4 unit ...196 Table 6.2. X-ray structure refinement data for 2 ...216 Table 7.1. Thermal treatment procedures for prepared monometallic and bimetallic MOFs ...258 Table 8.1. Synthetic conditions for An-containing MOFs ...271 Table 8.2. Energy of formation for one- and six-atom (Zr-to-An) substitution ...281 Table 8.3. X-ray structure refinement data for U6-Me2BPDC-8,
Th6-Me2BPDC-10, and Th6-TPDC-NH2-12 ...296 Table 8.4. X-ray structure refinement data for Zr6U0.87-Me2BPDC-8 and
Th6U4-Me2BPDC-8 ...306 Table 8.5. X-ray structure refinement data for Zr6-Me2BPDC(TPDC-DEPU) ...315 Table 8.6. X-ray structure refinement data for Zr6(Th)-Me2BPDC-8 and
LIST OF FIGURES
Figure 1.1. Metal–organic framework photoluminescence: emission from an organic
linker, a metal node, or a guest molecule ...4
Figure 1.2. White light emission of ([CH3]2NH2)15([Cd2Cl]3[TATPT]4) with immobilized (Ir[ppy]2[bpy])+ ...7
Figure 1.3. Tuning of the emission profile of EuxTb1–xDMBDC as a function of temperature. ...9
Figure 1.4. Band alignment of MOF-177, DH6T, and PCBM, showing energy transfer and electron transfer from the excited linker of MOF-177 to incorporated molecules of DH6T and PCBM ...11
Figure 1.5. Representation of photocatalytic hydrogen generation and CO2 reduction using a light-harvesting Zr-based metal–organic framework, UiO-67 ...13
Figure 2.1. The X-ray structures of Zn2(ZnTCPP), DPB-BI, 1, and 1¢ ...24
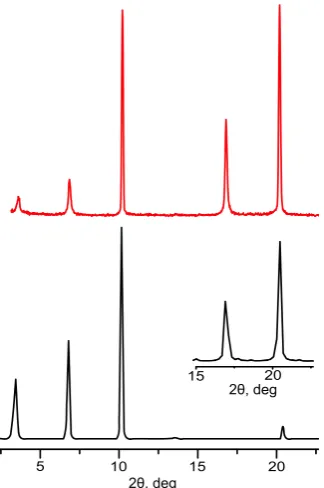
Figure 2.2. PXRD patterns of 2 and BI@2. The inset shows the single-crystal X-ray structure of 2 ...26
Figure 2.3. (a) The DR spectrum of Zn2(ZnTCPP) and emission spectra of DPB-BI and Zn2(ZnTCPP). (b) The emission spectrum of 1. (c) The DR spectrum of 2 and emission spectra of BI and 2. (d) The emission spectrum of BI@2. ...26
Figure 2.4. Molecular structure of DPB-CHO ...32
Figure 2.5. Molecular structure of BI ...32
Figure 2.6. Single-crystal X-ray structure of 2 ...33
Figure 2.7. Molecular structure of DPB-BI ...35
Figure 2.8. FT-IR spectrum of DPB-BI ...35
Figure 2.9. 1H NMR (top) and 13C NMR (bottom) spectra of the synthesized DPB-BI ligand ...36
Figure 2.10. FT-IR spectrum of 1 ...37
Figure 2.12. PXRD patterns of 1 ...39
Figure 2.13. Thermogravimetric analysis plot of 1 ...39
Figure 2.14. 1H NMR spectrum of digested 1 ...40
Figure 2.15. FT-IR spectrum of 1¢ ...42
Figure 2.16. Thermogravimetric analysis plot of 1¢ ...42
Figure 2.17. Single-crystal X-ray structure of 1¢ ...43
Figure 2.18. PXRD patterns of 1¢ ...44
Figure 2.19. 1H NMR spectrum of digested 1¢ ...44
Figure 2.20. Thermogravimetric analysis plot of BI@2 ...46
Figure 2.21. 1H NMR spectrum of digested BI@2 ...46
Figure 2.22. (left) Fluorescence decays of DPB-BI-1 and DPB-BI (right) Fluorescence decays of DPB-BI-1’ and DPB-BI ...56
Figure 2.23. Fluorescence decays of BI and BI@2 ...56
Figure 2.24. Förster analysis of 1 ...57
Figure 3.1. (Top) Representations of the GFP with immobilized HBI and (bottom) the rigid porous scaffold 1 with the incorporated HBI chromophore. HBI molecules are depicted in green ...64
Figure 3.2. (Top) Normalized emission spectra of BI@1, pMBI@1, MeO-oHBI@1, HBI@1, and oHBI@1. (bottom) Photographs of the materials under UV irradiation ...66
Figure 3.3. Normalized diffuse reflectance and emission spectra of 1, HBI, and HBI@1. The inset shows photographs of non-emissive 1 and HBI and fluorescent HBI@1 ...68
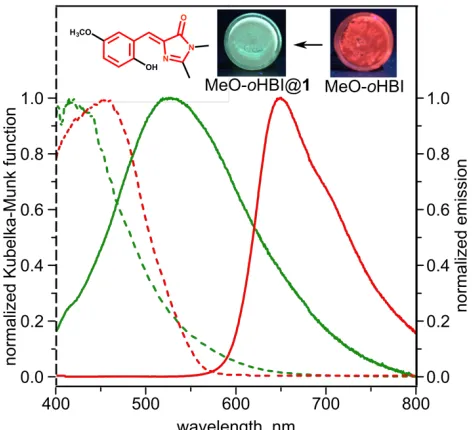
Figure 3.4. Normalized diffuse reflectance and emission spectra of oHBI and MeO-oHBI@1. The inset shows photographs of MeO-oHBI and MeO-oHBI@1 ...69
Figure 3.5. The excited-state intramolecular proton transfer in MeO-oHBI. Two views of molecular packing in the MeO-oHBI crystal structure. ...70
Figure 3.6. (a) Synthetic routes for coordinative immobilization of BDC-BI2− and preparation of 2′ and 3. (b) and (c) Fragments of the X-ray crystal structures of the parent structure 2 (isoreticular to 2′) and the parent structure UiO-67 (isoreticular to 3). (d) and (e) Normalized diffuse reflectance and emission of 2′ and 3 ...73
Figure 3.8. The Zn2(O2C–)4 secondary building unit and a part of the X-ray crystal
structure of 1 ...82
Figure 3.9. PXRD patterns of 1 ...84
Figure 3.10. Thermogravimetric analysis plot of 1 ...84
Figure 3.11. FT-IR spectrum of 1 ...85
Figure 3.12. PXRD patterns of 1, BI@1, pMBI@1, HBI@1, oHBI@1, and MeO-oHBI@1 ...86
Figure 3.13. 1H NMR spectrum of digested 2’ in DMSO-d6 ...87
Figure 3.14. PXRD patterns of 2’ ...87
Figure 3.15. FT-IR spectrum of 2’ ...88
Figure 3.16. The Zn4O(O2C–)6 and Zr6O4(OH)4 secondary building units in 2 and 3 ...88
Figure 3.17. PXRD patterns of 3 ...89
Figure 3.18. Thermogravimetric analysis plot of 3 ...90
Figure 3.19. FT-IR spectrum of 3 ...90
Figure 3.20. HBI loading (wt%) in 1 calculated from the UV-vis calibration curve ...91
Figure 4.1. Coordinative and noncoordinative approaches for incorporation of chromophores with HBI cores inside a rigid scaffold ...102
Figure 4.2. (Top) Color palette of fluorescent proteins and the chromophores mimicking the emission profiles of the natural proteins. (Bottom) Normalized emission spectra of HBI-based chromophores incorporated inside a rigid scaffold, Zn3(BTC)2 ...104
Figure 4.3. Approaches involved in the incorporation of HBI-and porphyrin-based cores inside the rigid scaffold ...105
Figure 4.4. Prepared chromophores containing a benzylidene imidazolinone core ...107
Figure 4.5. (a) The excited-state intramolecular proton transfer in X-oHBI chromophores. (b) Molecular structure of Me-oHBI ...108
Figure 4.6. Normalized solid-state emission of EC-oHBI@Zn3(BTC)2, Br-oHBI@Zn3(BTC)2, and tBu-oHBI@ Zn3(BTC)2 and the corresponding “free” chromophores ...108
Figure 4.8. (Top) Isomerization of H2BDC-BI. (Bottom) Fragment of the
Zr6O4(OH)4(BDC-BI)6 X-ray crystal structure ...113
Figure 4.9. 1H NMR (top) and 13C NMR (bottom) spectra of the synthesized NO2-oHBI ...123
Figure 4.10. FT-IR spectrum of NO2-oHBI ...123
Figure 4.11. 1H NMR (top) and 13C NMR (bottom) spectra of the synthesized EC-oHBI ...123
Figure 4.12. FT-IR spectrum of EC-oHBI ...124
Figure 4.13. 1H NMR (top) and 13C NMR (bottom) spectra of the synthesized Br-oHBI ...124
Figure 4.14. FT-IR spectrum of Br-oHBI ...124
Figure 4.15. 1H NMR (top) and 13C NMR (bottom) spectra of the synthesized Cl-oHBI...125
Figure 4.16. FT-IR spectrum of Cl-oHBI ...125
Figure 4.17. 1H NMR (top) and 13C NMR (bottom) spectra of the synthesized F-oHBI ...126
Figure 4.18. FT-IR spectrum of F-oHBI ...126
Figure 4.19. 1H NMR (top) and 13C NMR (bottom) spectra of the synthesized Me-oHBI ...127
Figure 4.20. FT-IR spectrum of Me-oHBI ...127
Figure 4.21. 1H NMR (top) and 13C NMR (bottom) spectra of the synthesized OH-oHBI ...128
Figure 4.22. FT-IR spectrum of OH-oHBI ...128
Figure 4.23. 1H NMR (top) and 13C NMR (bottom) spectra of the synthesized tBu-oHBI ...129
Figure 4.24. FT-IR spectrum of tBu-oHBI ...129
Figure 4.25. PXRD patterns of chromophore @Zn3(BTC)2 ...130
Figure 4.26. PXRD patterns of Zr6O4(OH)4(BDC-BI)6 ...131
Figure 4.28. 1H NMR spectrum of digested Zr
6O4(OH)4(BDC-BI)6 after
UV-irradiation ...132
Figure 4.29 1H NMR spectrum of H 2BDC-BI after 25 minutes of UV-irradiation ...132
Figure 5.1. (top) Single-crystal X-ray structure of MeO-oHBI. Emission of MeO-oHBI in DMF, solid state, and inside Zn3(BTC)2 (bottom) The synthesized MOFs and emission maxima are shown for MeO-oHBI@MOFs ...157
Figure 5.2. (a) GFP with incorporated 4-hydroxybenzylidene imidazolinone (HBI). (b) pCOOH-BI-CO2Me@UiO-68-NH2 prepared though ‘‘fastened’’ immobilization. (c) Normalized emission spectra of UiO-68-NH2, pCOOH-BI@UiO-68-NH2, and pCOOH-BI-CO2Me@UiO-68-NH2 obtained through peptide coupling ...160
Figure 5.3. (left, top) The solid-state 2H NMR spectrum of Zr6O4(OH)4(BDC-BI-d3)6. (left, bottom) Simulated 2H NMR spectrum composed of narrow isotropic signal from rotation of DMF methyl groups , rotation of restricted DMF molecules (, and a Pake pattern from free rotation of CD3 group of BI-ligand. (right) Variable temperature quadrupolar spin-echo solid state 2H NMR spectra of Zr 6O4(OH)4(BDC-BI-d3)6 ...162
Figure 5.4. 1H and 13C NMR spectra of the synthesized pCOOH-BI chromophore ...166
Figure 5.5. FT-IR spectrum of pCOOH-BI ...167
Figure 5.6. Crystal structure of pCOOH-BI ...167
Figure 5.7. 1H and 13C NMR spectra of the synthesized pCOOH-BI-CO 2Me chromophore ...169
Figure 5.8. FT-IR spectrum of pCOOH-BI-CO2Me ...170
Figure 5.9. (top) Molecular structure of pCOOH-BI-CO2Me. (bottom) Carboxylic acid dimers ...170
Figure 5.10. Normalized emission spectra of pCOOH-BI and pCOOH-BI-CO2Me in the solid state ...171
Figure 5.11. PXRD patterns of MeO-oHBI@MOFs ...176
Figure 5.12. (top) 1H NMR spectrum of digested UiO-68-NH2 after “fastened” incorporation of pCOOH-BI. (bottom) 1H NMR spectrum of digested UiO-68-NH 2 after “fastened” incorporation of pCOOH-BI-CO2Me ...177
Figure 5.13. (top) 1H NMR spectrum of digested MIL-101-Al-NH 2 after “fastened” incorporation of pCOOH-BI. (bottom) 1H NMR spectrum of digested MIL-101-Al-NH 2 after “fastened” incorporation of pCOOH-BI-CO2Me ...178
Figure 6.2. (top) The PXRD patterns of 1. (bottom) The PXRD patterns of 2 ...188 Figure 6.3. XPS data for the Cu(2p3/2) region for: 1 and 2 ...190
Figure 6.4. XPS data for the Cu(2p3/2) region after exposure to X-rays and the charge
neutralizer for various times ...192 Figure 6.5. XPS data for the Cu(2p3/2) region after exposure of 1 to CO, air, and H2 ....197
Figure 6.6. XPS data for the valence band region for 1and 2 ...200 Figure 6.7. Total and partial density of states of neutral Cu2(BTC)4, H atom adsorbed on
the neutral Cu2(BTC)4, and negatively charged Cu2(BTC)4 cluster models ...201
Figure 6.8. Thermogravimetric analysis plot of 1 ...202 Figure 6.9. FTIR spectra of 1 and 2 ...203 Figure 6.10. (left) The PXRD patterns of 1: as-synthesized and after following successive treatment. (right) The PXRD patterns of 1: as-synthesized and after exposure to X-rays and the charge neutralizer ...203 Figure 6.11. (left) The PXRD patterns of 1 as-synthesized and after following successive treatments. (right) The PXRD patterns of 1 as-synthesized and after heating in Ar at 225 °C for 10 h ...204 Figure 6.12. (left) The PXRD patterns of 1 as-synthesized and after heating at 225 °C. (right) The PXRD patterns of 1 as-synthesized and after heating at 120 °C for 12 h and heating in vacuum at 225 °C for 35 h ...204 Figure 6.13. The secondary building unit in 2 ...205 Figure 6.14. The single-crystal X-ray structure of 2 ...205 Figure 6.15. XPS data for 1 powder: as received; after heating in Ar in the catalysis cell for 14 h at 225 °C; after exposure to O2 at room temperature for 2 h; and after heating in
vacuum at 275 °C for 5 h ...209 Figure 6.16 XPS data for 1 powder heated in Ar in the catalysis cell
for 35 h at 225 °C ...210 Figure 6.17. XPS data for Cu(2p3/2) region for 1 in powder form after exposure
to X-rays and the charge neutralizer ...211 Figure 6.18. XPS data for the Cu(2p3/2) region after the same 1 powder ...212
Figure 6.20. Optimized structure of neutral Cu2(BTC)4 cluster model. Calculated
minimum energy structures of H2O, O2, CO, H2 adsorbed on the Cu2+ site of neutral
Cu2(BTC)4 and H atom adsorbed on the carboxylate oxygen ...215
Figure 6.21. Optimized structure of negatively charged Cu2(BTC)4 cluster model. Calculated minimum energy structures of H2O, O2, CO, and H2 adsorbed on the Cu1+ site of negatively charged Cu 2(BTC)4 ...215
Figure 7.1. Paddle-wheel metal nodes of M3-yM’y-MOFs with unsaturated metal sites and M6-yM’y(BTB)4(BP)3 with metal sites blocked by the BP ligand ...228
Figure 7.2. The XPS data for the valence band region for: Cu3(BTC)2, Cu3(BTC)2 (additional heating at 225 °C for 14 h under argon), Zn3(BTC)2, and Cu2.25Zn0.75(BTC)2 ...230
Figure 7.3. The XPS data for the valence band region of Cu1.05Zn1.95(BTC)2, Cu1.5Co1.5(BTC)2, Cu2.82Co0.18(BTC)2, and Cu2.34Co3.66(BTB)4(BP)3 ...233
Figure 7.4. Total and partial density of states of Cu2(BTC)4 and CuCo(BTC)4 ...237
Figure 7.5. (left) Metal nodes Zr6O4(OH)8 extended by incorporation of Co2+ to Zr6O4(OH)8. (right) Coordination of the second metal, cobalt, occurs through coordination to the organic linker, H2sal-TPD, instead of the Zr-based metal node ...238
Figure 7.6. PXRD patterns of Cu3(BTC)2 ...242
Figure 7.7. PXRD patterns of Zn3(BTC)2 ...243
Figure 7.8. PXRD patterns of Cu2.82Co0.18(BTC)2 ...243
Figure 7.9. PXRD patterns of Cu2.4Co0.6(BTC)2 ...244
Figure 7.10. PXRD patterns of Cu2.4Co0.6(BTC)2 ...244
Figure 7.11. PXRD patterns of Cu2.25Zn0.75(BTC)2 ...246
Figure 7.12. PXRD patterns of Cu2.05Zn1.95(BTC)2 ...246
Figure 7.13. (left) A secondary building unit and (right) X-ray crystal structure of Cu3(BTB)2 ...247
Figure 7.14. (left) A secondary building unit and (right) X-ray crystal structure of Cu6(BTB)4(BP)3 ...247
Figure 7.15. PXRD patterns of Cu3(BTB)2 ...248
Figure 7.16. PXRD patterns of Cu6(BTB)4(BP)3 ...248
Figure 7.18. XPS data for the Cu(2p3/2) and Zn(2p3/2) regions for
Cu1.05Zn1.95(BTC)2 after evacuation ...251
Figure 7.19. XPS data for the Cu(2p3/2) and valence band regions for Cu2.25Zn0.75(BTC)2 ...251
Figure 7.20. XPS data for Cu1.5Co1.5(BTC)2 andCu2.82Co0.18(BTC)2 ...252
Figure 7.21. Valence band XPS data for CoCl2 ...252
Figure 7.22. Valence band XPS data for Cu3(BTB)2 ...253
Figure 7.23. Power reflection coefficients versus frequency for monometallic and bimetallic MOF samples and moisture exposure dependence for the Cu3(BTC)2 sample ...255
Figure 7.24. The optimized structures of Cu2(BTC)4 and Co-Cu(BTC)4 ...257
Figure 8.1. Crystal structures and metal nodes of frameworks utilized as precursors for building hierarchical complexity ...269
Figure 8.2. Installation of H2TPDC-NH2 capping linker in Th6-Me2BPDC-10 through coordination to “unsaturated” metal nodes leading to formation of Th6-Me2BPDC(TPDC-NH2) ...273
Figure 8.3. Wt% of thorium in MOFs as a function of structural 1/d ...274
Figure 8.4. Stepwise installation of two capping linkers in Zr6-Me2BPDC-8 leading to formation of Zr6-Me2BPDC(TPDC-DEPU)(NDC) ...275
Figure 8.5. (top) Packing and metal nodes of Zr6-Me2BPDC-8 and Zr6U0.87-Me2BPDC-8. (bottom) XPS data for Zr(3d) and U(4f) regions for Zr6U0.87-Me2BPDC-8 ...276
Figure 8.6. (top) Packing and metal nodes of Th6-Me2BPDC-10 and Th6U4-Me2BPDC-8. (bottom) FTIR spectra of Th6-Me2BPDC-10 and Th6U4-Me2BPDC-8 ...277
Figure 8.7. Transmetallation in a molecular Zr-containing planar 15-membered macrocycle and MOFs ...280
Figure 8.8. Packing and metal nodes of U6-Me2BPDC-8 and Th6-Me2BPDC-8 ...282
Figure 8.9. (left) PXRD patterns of Th6-Me2BPDC-10. (right) Thermogravimetric analysis plot of Th6-Me2BPDC-10 ...285
Figure 8.10. (left) FTIR spectrum of Th6-Me2BPDC-10. (right) N2 adsorption isotherm of Th6-Me2BPDC-10 ...285
Figure 8.12. FTIR spectrum of U6-Me2BPDC-8 ...287
Figure 8.13. (left) PXRD patterns of Th6-TPDC-NH2-12. (right) Thermogravimetric
analysis plot of Th6-TPDC-NH2-12 ...288
Figure 8.14. (left) FTIR spectrum of Th6-TPDC-NH2-12. (right) N2 adsorption isotherm
of Th6-TPDC-NH2-12 ...288
Figure 8.15. (left) PXRD patterns of Zr6U0.87-Me2BPDC-8. (right) Thermogravimetric
analysis plot of Zr6U0.87-Me2BPDC-8 ...297
Figure 8.16. (left) XPS survey scan for Zr6U0.87-Me2BPDC-8. (right) FTIR
spectra of Zr6-Me2BPDC-8, Zr6U0.87-Me2BPDC-8 before washing using
a Soxhlet extractor, and Zr6U0.87-Me2BPDC-8 after the 3-day washing
procedure using a Soxhlet extractor ...298 Figure 8.17. (left) PXRD patterns of Th6U4-Me2BPDC-8. (right) Thermogravimetric
analysis plot of Th6U4-Me2BPDC-8 ...298
Figure 8.18 Photographs of Th6-Me2BPDC-10 and Th6U4-Me2BPDC-8 ...299
Figure 8.19. (top) XPS survey scan for Th6U4-Me2BPDC-8; (bottom) XPS data
for U(4f) and Th(4f) regions for Th6U4-Me2BPDC-8 ...299
Figure 8.20. (left) PXRD patterns of simulated Th6-Me2BPDC-8
and experimental Th5.65U0.35-Me2BPDC-8. (right) Thermogravimetric analysis
plot of Th5.65U0.35-Me2BPDC-8 ...307
Figure 8.21. FTIR spectrum of Th5.65U0.35-Me2BPDC-8 ...307
Figure 8.21. 1H NMR spectrum of digested Th
6-Me2BPDC(TPDC-NH2) ...309
Figure 8.22. FTIR spectra of Th6-Me2BPDC-10, H2TPDC-NH2,
and Th6-Me2BPDC (TPDC-NH2) ...310
Figure 8.23 PXRD patterns of simulated Th6-Me2BPDC-10 and
experimental Th6-Me2BPDC(TPDC-NH2) ...310
Figure 8.24. PXRD patterns of simulated Zr6-Me2BPDC-8 and experimental Zr6
-Me2BPDC(TPDC-DEPU)(NDC) ...312
Figure 8.25. 1H NMR spectrum of digested Zr6-Me2BPDC(TPDC-DEPU)(NDC) ...312
Figure 8.26. The simulated PXRD pattern of Zr6-Me2BPDC(NDC)
and experimental PXRD pattern of Zr6U0.87-Me2BPDC(SDC) ...316
Figure 8.27. 1H NMR spectrum of digested Zr
6U0.87-Me2BPDC(SDC) ...316
Figure 8.29. (left) PXRD patterns of simulated Th6-Me2BPDC-8, experimental
Th5.65U0.35-Me2BPDC-8, experimental Th5.65U0.35-Me2BPDC(SDC), and simulated Th6-Me2BPDC-10. (right) PXRD patterns of simulated Th6-Me2BPDC-10 and experimental
Th5.65U0.35-Me2BPDC(SDC) ...318
Figure 9.1. (a) Single-crystal X-ray structures of 1 with simulated spiropyran moieties. (b) Changes in conductance of a single crystal of 1 and Cu3(BTC)2 upon 365-nm irradiation, followed by 590-nm irradiation. (c) Normalized optical cycling of current and absorption as a function of alternating irradiation ...336
Figure 9.2. (a) Photoisomerization of BPMTC coordinated to Zn2(O2C−)4 nodes. (b, c) Experimental DR spectra and Tauc plot of 2 (d, e) XPS data of 2 for the S(2p) region. (f) Simulated density of states of a truncated MOF model in the open and closed forms ....339
Figure 9.3. (top) Single-crystal X-ray structures of 2 and 2′. (bottom) Conductivity for 2 and 2′ ...340
Figure 9.4. PXRD patterns of 1 ...344
Figure 9.5. Diffuse reflectance spectra of 1 ...345
Figure 9.6. Tauc plot of 1 ...345
Figure 9.7. PXRD patterns of 2 ...346
Figure 9.8. XPS survey scan of 2 ...346
Figure 9.9. PXRD patterns of Zn2(DBTD)(DPB-CHO) ...347
Figure 9.10. The X-ray crystal structure of Zn2(DBTD)(DPB-CHO) ...348
Figure 9.11. The X-ray crystal structure of one non-interpenetrated component of 2′ ..349
Figure 9.12. PXRD patterns of 2′ ...350
Figure 9.13. Diffuse reflectance spectra of 2′ ...350
Figure 9.14. Tauc plot of 2′ ...351
Figure 9.15. XPS data of 2′ ...351
Figure 9.16. Modulation of the electric response of 1, Zn2(DBTD)(DPB-CHO), and Cu3(BTC)2 by alternating light irradiation ...357
Figure 9.17. (left) A photograph of a two-contact probe single-crystal set up of Zn2(DBTD)(DPB-CHO). (right) Modulation of the electric response of a single crystal of Zn2(DBTD)(DPB-CHO) ...359
LIST OF SCHEMES
Scheme 2.1. (top) A schematic representation of ET between the two coupled chromophore cores of a green fluorescent protein variant (EGFP) and the
electron-transfer protein, cytochrome b562. (bottom) Approaches I and II involved incorporation of chromophores with HBI- and porphyrin-based cores inside the rigid scaffold ...23
Scheme 2.2. Synthesis of DPB-BI ...34
Scheme 4.1. (a and b) Schematic representation of ET between two coupled
chromophores in a green fluorescent protein variant (EGFP) and cytochrome b562 and (c) emission spectrum of a donor and absorptionspectrum of an acceptor ...101
Scheme 7.1. A schematic representation of monometallic and bimetallic MOFs ...227
Scheme 8.1. A schematic representation of precursors (An-MOF and Zr-MOF) and synthetic strategies utilized for actinide integration inside the rigid framework ...268
Scheme 9.1. (top) “Wiring” stimuli-responsive linkers as a function of excitation wavelength for framework electronic structure modulation. (bottom) Visualization of changes of MOF electronic properties through LED switching ...333
CHAPTER 1
METAL-ORGANIC FRAMEWORK PHOTOPHYSICS: OPTOELECTRONIC DEVICES, PHOTOSWITCHES, SENSORS, AND PHOTOCATALYSTS
____________________
INTRODUCTION
The development of new hierarchical materials capable of efficient energy
transfer along a predesigned pathway will boost various applications, ranging from
organic photovoltaics to catalytic systems. Due to their exceptional tunability and
structural diversity, metal-organic frameworks (MOFs) offer a unique platform to study
and model directional energy-transfer processes and, thereby, an efficient path for energy
utilization. This chapter summarizes the latest advances in MOF applications in the fields
of optoelectronics, photoswitching, sensing, and photocatalysis, for which development is
highly dependent on fundamental studies of MOF photophysics.
The development of novel materials with enhanced performance is a continuous
process mainly driven by everyday demands. Furthermore, rapid human population
growth is accelerating the need for fast enhancement of materials performance in areas
ranging from organic photovoltaics to photocatalytic systems. The field of
optoelectronics is an excellent example where constantly growing societal demands in
energy usage have forced materials evolution to speed up. Recently, MOFs, which are
crystalline materials consisting of organic linkers connected to inorganic secondary
building units, have been evaluated as promising candidates for a variety of
renewable-energy applications.
Early excitement about MOF-based materials was mainly due to their high
surface areas, with applications focusing primarily on gas storage and separation.1,2
Today, those applications could be considered “classic” applications for MOFs, due to
the tremendous amount of research that has mainly centered on hydrogen/methane
storage or CO2 sequestration.3–6 More recently, it has been demonstrated that MOF
unprecedented surface areas.7,8 For instance, the self-assembled nature of MOFs provides
a powerful method for arranging hundreds of organic compounds with high structural
organization, thereby providing an opportunity to utilize these materials as
light-harvesting mimics of natural photosystems. At the same time, crystallinity allows one to
determine the precise distances and angles between self-assembled organic linkers and,
therefore, study and model short- and long-range energy-transfer processes. MOFs also
offer a high degree of synthesis tunability, which could help adjust optical, electrical, and
sometimes even mechanical properties from the design stage.
These materials have ideal properties for the development of new systems with
desirable properties. In this chapter, we survey MOF applications in areas for which
development is highly dependent on fundamental studies of MOF photophysics,
including sensors, noninvasive thermometers, optoelectronic devices, photocatalysts, and
photoswitches.
Sensors
The main principle of any sensing device is the conversion of a stimulus into a
response. For example, an efficient change in inherent material properties after
interaction with an analyte. Due to the combination of high surface area and structural
tunability, MOFs stand out as a unique platform for sensing, with applications in this area
being one of the most explored to date. Comprehensive review articles on this topic have
been published elsewhere.9–14 Because of the advantages of rapid response and high
sensitivity, we focus on and summarize the state of the art in the area of MOF
photoluminescence-based sensing, with a concise discussion of perspectives and
Luminescent MOFs have been proven successful for the detection of pollutants,
toxins, and explosives.11 Compared to purely organic or inorganic sensors, the hybrid
nature of MOFs offers the possibility of utilizing both organic linkers and inorganic
building units for sensing enhancement or simultaneous multiple-analyte detection
(Figure 1.1). MOF photoluminescence response is strongly affected by changes in the
coordination environment of the metal ions located at the nodes, interactions with guest
molecules (e.g., π–π interactions, hydrogen and halogen bonding), and coordination of
metal cations to organic linkers modified with chelating groups.9–14 Through fine-pore
tunability, MOFs also allow implementation of an analyte size-exclusion strategy,
thereby offering an additional pathway for sensing selectivity enhancement.
Furthermore,their relatively high thermal stability allows tuning of the sensor selectivity
as a function of temperature. Thus, crystallinity, porosity, tunability, and structural
modularity are distinct advantages for the rational engineering of MOF-based sensors.
Despite a broad range of analytes, such as explosives and toxic gases probed for
detection by MOFs, there is still much room for improvement. The majority of MOF
sensors are based on a “turn-off” mechanism (i.e., a decrease in the photoluminescence
response upon exposure to an analyte). For example, toxins such as aflatoxins B1, B2, or
G1, found in food, could be detected via fluorescence quenching of Zn2(BPDC)2(TPPE)
(BPDC = biphenyl-4,4′-dicarboxylate, TPPE =
1,1,2,2-tetrakis(4-(pyridin-4-yl)phenyl)ethene).15 The reverse, a “turn-on” response, especially in the visible range,16,17
is a more favorable, albeit less common, strategy because it facilitates visualization and
easier real-time monitoring. This response is also more difficult to design.
Another underexplored area is tandem sensing. Highly tunable MOF structures
allow the introduction of different functional groups for more sophisticated recognition,
where several types of molecules can be simultaneously detected.16,18 Indeed, current
studies mainly focus on a singular MOF “receptor.” For instance, common receptors in
MOFs are unsaturated metal sites, which bind only one type of gaseous analyte (or every
analyte in the mixture).16,18 Constantly growing activity in this area continues to promote
rapid development of novel sophisticated structures, which indicates that the next
generation of efficient MOF sensors is fast approaching.
White light-emitting diodes
The development of white light-emitting diodes (LEDs) is driven not only by the
need to replace environmentally unfriendly light bulbs (or fluorescent lamps) with short
life- times, but also by the possibility of a variety of new devices, including flexible
groups.19–24 MOF-based LEDs rely on synergistic photoluminescence arising from both
organic and inorganic components of the framework. As a result, white emission can be
achieved through fine-tuning of the color and the relative amount of monochromatic
emission from the organic linkers and metal nodes.19–21 Compared to purely organic
devices, the utilization of both ligand and metal nodes can provide more robust and stable
materials with enhanced efficiency.
To date, there are two main approaches for engineering white light-emitting
MOF-based materials. The first approach relies on combining red, green, and blue
emitters, which need to be carefully balanced to produce white light. Realization of this
approach occurs through the doping of a MOF framework with various concentrations of
lanthanides, which exhibit versatile emissions (red, Eu; green, Tb; blue, Ce).22–24
Although the metal doping strategy is attractive, it usually suffers, due to the fact that the
ensuing LEDs have relatively low efficiency. A different approach for generating white
light emission in these materials is based on a combination of blue emission from the
framework with yellow emission from guest complexes inside the pores (Figure 1.2). The
latter strategy has already resulted in a white-emitting LED with high efficiency, which
was engineered from blue-emitting ([CH3]2NH2)15([Cd2Cl]3[TATPT]4) (TATPT =
2,4,6-tris(2,5-dicarboxylphenyl-amino)-1,3,5-triazine) with immobilized yellow-emitting
cationic iridium complexes.25 To summarize, a tremendous library of luminescent MOFs,
in combination with potentially emissive organic linkers,10–12 provides a high degree of
flexibility for the rational design of high-performance LEDs. Currently, improving the
Figure 1.2. White light emission of ([CH3]2NH2)15([Cd2Cl]3[TATPT]4) (blue
framework) with immobilized (Ir[ppy]2[bpy])+
(yellow sphere). The blue, red, and gray components within the framework represent nitrogen, oxygen, and carbon atoms, respectively. Note: TATPT, 2,4,6-tris(2,5-dicarboxylphenyl-amino)-1,3,5- triazine; ppy, 2-phenylpyridine; bpy, 2,2′-bipyridine.
Noninvasive thermometers
The capability to tune MOF luminescence as a function of temperature has been
utilized to develop noninvasive thermometers for remote temperature measurements.26–31
In addition to being noninvasive, this type of temperature determination has advantages,
including high sensitivity, quick response, and invariance with electric or magnetic fields,
which could be critical for industrial manufacturing, for instance. In general, the
photoluminescence response from an organic compound dramatically drops with an
significantly sup- press the vibrational modes responsible for photoluminescence
quenching at elevated temperatures.16
For example, ligand rigidity achieved through coordinative immobilization inside
a MOF matrix allows, in some cases, extension of the luminescence temperature range of
an organic molecule by more than 100°C.16 This was clearly demonstrated with the
tetraphenylethylene (TPE) chromophore when compared with a TPE-based MOF.
Changes in the intensity of ligand-centered emission can therefore indicate temperature
changes. However, tuning the emission color as a function of temperature is a more
appealing strategy that also offers the possibility of remote temperature detection or
detection by the naked eye. This approach has been demonstrated in bimetallic
lanthanide-based MOFs, which contain two different metals inside the center— each
metal with a distinct emission color depending on the surrounding temperature, thus
providing an opportunity to drastically change the photoluminescence response (Figure
1.3).28–31
Further studies in MOF thermometry could lead to a number of novel
applications, including thermal mapping of biological systems. However, this field
suffers from the absence of more systematic studies, which would provide both the
motivation and interpretation of correlations of MOF parameters (e.g., ligand design,
metal choice, incorporated guest, and framework topology) with MOF-based
thermometer performance.
Active layers in organic photovoltaics
Great demand for low-cost photovoltaic systems capable of converting sunlight
into electrical energy has brought organic solar cells to the forefront as promising
Figure 1.3. Tuning of the emission profile of EuxTb1–xDMBDC (DMBDC =
2,5-dimethoxy-1,4-benzenedicarboxylate) as a function of temperature. Luminescent thermometry is accomplished through the design of a bimetallic lanthanide- based metal–organic framework. The color change represents the change in emission (from green to red) of the lanthanide framework as a function of temperature. Blue octahedra and gray, red, and blue spheres represent metal nodes, carbon, oxygen, and nitrogen atoms, respectively.
influence the efficiency of bulk heterojunction (BH) solar cells—light harvesting, charge
separation, and charge mobility. An almost unlimited number of combinations of metal
ions and organic molecules, which could be utilized for MOF preparation, allow tailoring
of the light-harvesting properties of a framework, starting from the design stage.
There are many studies of light-harvesting MOFs in which enhancement of light
capture is achieved through several mechanisms involving light-absorbing organic
linkers, guest molecules, or inclusions such as quantum dots.32–36 MOFs also offer precise
network and, therefore, affecting charge separation and carrier mobility. Recent studies by the Dincă group demonstrated that charge mobility in a MOF matrix is comparable to or even higher than that in organic semiconductors.37 With light absorption and mobility demonstrated, at least as proofs of concept, the question of charge separation remains, which has not been studied extensively in MOFs. To this end, an interpenetrated donor– acceptor MOF morphology may offer an attractive strategy for eliminating problems associated with phase segregation, which is responsible for severe charge recombination losses in BH cells.
One of the first examples of utilizing a MOF for active- layer engineering was introduced by the Allendorf group, who developed a new organic photovoltaic material by incorporating α,ω-dihexylsexithiophene (DH6T) and (6,6)-phenyl-C61-butyric acid methyl ester (PCBM) inside a ZnO4(BTB)2 framework (MOF-177, BTB = 1,3,5-benzenetribenzoate).32 Preliminary studies of energy-transfer processes in the designed material revealed that in the case of MOF linker excitation, Förster resonance energy transfer (i.e., the mechanism describing energy transfer between two chromophores) could occur between the framework and DH6T, and either energy or electron transfer could occur between MOF-177 and PCBM (Figure 1.4). Thus, in this case, DH6T can play a dual role, serving as an acceptor for MOF-177 and donor for PCBM, thus facilitating energy transfer.
Figure 1.4. Band alignment of MOF-177, DH6T, and PCBM, showing energy transfer and electron transfer from the excited linker of MOF-177 to incorporated molecules of DH6T and PCBM. The donor–acceptor active layer was fabricated by incorporating DH6T and PCBM inside a ZnO4(BTB)2 framework (MOF-177, BTB =
1,3,5-benzenetribenzoate). The arrows depict the energy transfer (purple), charge transfer (blue), and FRET cascade (red). Adapted with permission from Reference 32.
© 2014 Royal Society of Chemistry. Note: MOF, metal–organic framework; DH6T, α,ω-dihexylsexithiophene; PCBM, (6,6)-phenyl-C61
relationship between light-harvesting properties and MOF topology is also unknown,
despite its importance for device-performance optimization. Finally, the question of
integrating a MOF-based active layer inside a larger-scale device, including thin-film
growth, remains open.
In conclusion, as multifunctional platforms, MOFs offer unique opportunities to
incorporate light-harvesting building blocks, enhance charge separation and mobility, and
prevent phase segregation—key components for successful engineering of organic
photovoltaic devices. However, we should first address fundamental questions, including
MOF photophysics.
Photocatalysts
A key advantage that makes MOFs attractive candidates for photocatalytic
applications is the potential of integrating the three fundamental steps of artificial
photosynthesis into a single material: light absorption, generation of charge-separated
excited states, and charge transfer to reactive centers where reduction or oxidation could
take place.33,38–41 MOFs may be able to mimic the natural photosystem (e.g., replication
of chromophore organization in a leaf photosystem), a hierarchically ordered
chloroplast-like structure that is capable of photon col- lection and subsequent energy transfer. In
principle, the attributes that make MOFs attractive for photovoltaic applications are valid
here as well. In addition, their porous nature, coupled with their structural tunability,
could facilitate more facile diffusion of reactants and products relative to “conventional”
solid photocatalysts, including metal-doped zeolites.42–44
Furthermore, crystalline MOFs facilitate mathematical predictions and
computational modeling, thus providing mechanistic insights for short- and long-range
Figure 1.5. Representation of photocatalytic hydrogen generation and CO2 reduction using a
light-harvesting Zr-based MOF, UiO-67. The UiO-67 is prepared from organic ligands ([Ir(ppy)2(bpy)]Cl-derived dicarboxylic acid,
red lines). The Pt nanoparticles (gray cubes) were loaded into the MOF cavities. Note: UiO, University of Oslo; ppy,2-phenylpyridine; bpy, 2,2′-bipyridine.
nanoparticles immobilized within MOF pores (Zr-based UiO framework built from a
linear dicarboxylate ligand) (UiO = University of Oslo) showed a fivefold increase in
catalytic efficiency for hydrogen evolution from water compared to its homogeneous
control, or reference material (Figure 1.5).45
Despite tremendous progress made in the design and synthesis of photoactive
MOFs, it is still difficult to predict the photocatalytic activity of a new MOF-based
system. Clearly, MOFs can function as photocatalysts, co-catalysts, or host materials for
heterogeneous catalysis. However, the catalytic activity of these systems is often low and
will need to be significantly enhanced to satisfy the requirements for practical
implementation. There are a number of examples of MOFs that function as photocatalysts
for hydrogen evolution, such as the one previously mentioned, but further development is
the relatively low stability of many MOFs in an aqueous solution or in the presence of
strong oxidants. For MOFs to become a major player in the field of photocatalysis, which
is relevant for energy conversion, water-based processes should be targeted and,
accordingly, materials that are more stable in such environments should be produced.
Photoswitches
Recent studies on understanding energy-transfer mechanisms in MOFs have
suggested the idea of their use as photoswitches (i.e., molecules that can isomerize as a
function of incident light). For instance, coordinative immobilization of photo- chromic
molecules such as bis(5-pyridyl-2-methyl-3-thienyl) cyclopentene as organic linkers
allows control over the emission wavelength as a function of external stimuli, particularly
the excitation wavelength.46 Therefore, this concept allows utilization of photochromic
ligands to direct photophysical properties of large light-harvesting ensembles.
Photoswitchable behavior was also demonstrated in a europium-containing MOF with a
photoactive ligand,47 which acted as a switch due to efficient energy transfer from the
lanthanide ion to the viologen-based linker. The initial photoluminescence response was
recovered by exposing the MOF to atmospheric oxygen.
The idea of solid-state photoswitching is highly appealing for the design of smart
windows/screens or sensors.48 In contrast to other MOF applications (e.g., in sensing or
gas storage), there are few reports in the literature related to MOF- based photoswitches.
This could be explained by a number of factors, including a slow response in the solid
state, a limited number of optical cycles, a loss of MOF crystallinity or complete
framework degradation during photoisomerization cycles, and challenges in the
preparation of MOF thin films. To conclude, MOF photoswitching is still in its infancy,
Summary
The foregoing discussions demonstrate only a small portion of possible
applications for MOF-based materials in the rapidly growing areas of optoelectronics,
sensing, photocatalysis, and photoswitching. Proof-of-concept examples, as well as
ongoing challenges, have been highlighted. Further developments in these areas rely on
the understanding of fundamental questions in MOF photophysics, including directional
energy- transfer mechanisms, quantum-efficiency enhancement, and up-conversion
phenomena. Therefore, in addition to device- fabrication development, the underlying
photophysical processes in MOF-based materials must first be addressed for successful
REFERENCES
1. Furukawa, H.; Cordova, K. E.; O’Keeffe, M.; Yaghi, O. M.; O’Keeffe, M.; Yaghi,
O. M. Science 2013, 341, 974.
2. Zhou, H.-C.; Long, J. R.; Yaghi, O. M. Chem. Rev.2012, 112, 673–674.
3. Hu, Z.; Deibert, B. J.; Li, J. Chem Soc Rev2014, 43, 5815–5840.
4. Kuppler, R. J.; Timmons, D. J.; Fang, Q. R.; Li, J. R.; Makal, T. A.; Young, M.
D.; Yuan, D. Q.; Zhao, D.; Zhuang, W. J.; Zhou, H. C. Coord. Chem. Rev. 2009,
253, 3042–3066.
5. Kreno, L. E.; Leong, K.; Farha, O. K.; Allendorf, M.; Duyne, R. P. Van; Hupp, J.
T.; Van Duyne, R. P.; Hupp, J. T. Chem. Rev.2012, 112, 1105–1125.
6. He, Y.; Zhou, W.; Qian, G.; Chen, B. Chem. Soc. Rev.2014, 43, 5657–5678.
7. Mason, J. A.; Veenstra, M.; Long, J. R. Chem. Sci.2014, 5, 32–51.
8. Sumida, K.; Rogow, D. L.; Mason, J. A.; McDonald, T. M.; Bloch, E. D.; Herm,
Z. R.; Bae, T. H.; Long, J. R. Chem. Rev.2012, 112, 724–781.
9. Zhai, Q.-G.; Bu, X.; Mao, C.; Zhao, X.; Feng, P. J. Am. Chem. Soc. 2016, 138,
2524–2527.
10.Falcaro, P.; Ricco, R.; Doherty, C. M.; Liang, K.; Hill, A. J.; Styles, M. J. Chem.
Soc. Rev.2014, 43, 5513–5560.
11.Stavila, V.; Talin, A. A.; Allendorf, M. D. Chem. Soc. Rev.2014, 5994–6010.
12.Cui, Y.; Yue, Y.; Qian, G.; Chen, B. Chem. Rev.2012, 112 (2), 1126–1162.
13.Zhang, X.; Wang, W.; Hu, Z.; Wang, G.; Uvdal, K. Coord. Chem. Rev.2015, 284,
206–235.
14.Zhao, D.; Cui, Y.; Yang, Y.; Qian, G. CrystEngComm2016, 18, 3746–3759.
15.Hu, Z.; Lustig, W. P.; Zhang, J.; Zheng, C.; Wang, H.; Teat, S. J.; Gong, Q.;
Rudd, N. D.; Li, J. J. Am. Chem. Soc.2015, 137, 16209–16215.
16.Shustova, N. B.; Cozzolino, A. F.; Reineke, S.; Baldo, M.; Dincă, M. J. Am.
Chem. Soc.2013, 135, 13326–13329.
17.Nagarkar, S. S.; Saha, T.; Desai, A. V.; Talukdar, P.; Ghosh, S. K. Sci. Rep.2015,
4, 7053.
18.Duke, A. S.; Dolgopolova, E. A.; Galhenage, R. P.; Ammal, S. C.; Heyden, A.;
Smith, M. D.; Chen, D. A.; Shustova, N. B. J. Phys. Chem. C2015, 119, 27457–
19.Xie, W.; Zhang, S.-R.; Du, D.-Y.; Qin, J.-S.; Bao, S.-J.; Li, J.; Su, Z.-M.; He,
W.-W.; Fu, Q.; Lan, Y.-Q. Inorg. Chem.2015, 54, 3290–3296.
20.Li, S.-M.; Zheng, X.-J.; Yuan, D.-Q.; Ablet, A.; Jin, L.-P. Inorg. Chem.2012, 51,
1201–1203.
21.Sava Gallis, D. F.; Rohwer, L. E. S.; Rodriguez, M. A.; Nenoff, T. M. Chem.
Mater.2014, 26, 2943–2951.
22.Sava, D. F.; Rohwer, L. E. S.; Rodriguez, M. A.; Nenoff, T. M. J. Am. Chem. Soc.
2012, 134, 3983–3986.
23.Yang, Q.-Y.; Pan, M.; Wei, S.-C.; Li, K.; Du, B.-B.; Su, C.-Y. Inorg. Chem.
2015, 54, 5707–5716.
24.Liu, Z.-F.; Wu, M.-F.; Wang, S.-H.; Zheng, F.-K.; Wang, G.-E.; Chen, J.; Xiao,
Y.; Wu, A.-Q.; Guo, G.-C.; Huang, J.-S. J. Mater. Chem. C2013, 1, 4634.
25.Sun, C.-Y.; Wang, X.-L.; Zhang, X.; Qin, C.; Li, P.; Su, Z.-M.; Zhu, D.-X.; Shan,
G.-G.; Shao, K.-Z.; Wu, H.; Li, J. Nat. Commun.2013, 4, 2717.
26.Cui, Y.; Zhu, F.; Chen, B.; Qian, G. Chem. Commun. 2015, 51, 7420–7431.
27.Kent, C. A.; Liu, D.; Ma, L.; Papanikolas, J. M.; Meyer, T. J.; Lin, W. J. Am.
Chem. Soc.2011, 133, 12940–12943.
28.Son, H.-J.; Jin, S.; Patwardhan, S.; Wezenberg, S. J.; Jeong, N. C.; So, M.;
Wilmer, C. E.; Sarjeant, A. A; Schatz, G. C.; Snurr, R. Q.; Farha, O. K.;
Wiederrecht, G. P.; Hupp, J. T. J. Am. Chem. Soc.2013, 135, 862–869.
29.Narayan, T. C.; Miyakai, T.; Seki, S.; Dincă, M. J. Am. Chem. Soc. 2012, 134,
12932–12935.
30.Farha, O. K. Chem. Commun.2015, 51, 3501–3510.
31.Nasalevich, M. A.; van der Veen, M.; Kapteijn, F.; Gascon, J. CrystEngComm
2014, 16, 4919.
32.Li, Y.; Xu, H.; Ouyang, S.; Ye, J. Phys. Chem. Chem. Phys.2016, 18, 7563–7572.
33.Wang, J.-L.; Wang, C.; Lin, W. ACS Catal.2012, 2 (12), 2630–2640.
34.Lian, X.; Zhao, D.; Cui, Y.; Yang, Y.; Qian, G. Chem. Commun. 2015, 51,
17676–17679.
35.Zhao, S.-N.; Li, L.-J.; Song, X.-Z.; Zhu, M.; Hao, Z.-M.; Meng, X.; Wu, L.-L.;
Feng, J.; Song, S.-Y.; Wang, C.; Zhang, H.-J. Adv. Funct. Mater.2015, 25, 1463–
36.Cadiau, A.; Brites, C. D. S.; Costa, P. M. F. J.; Ferreira, R. A. S.; Rocha, J.;
Carlos, L. D. ACS Nano2013, 7, 7213–7218.
37.Liu, X.; Akerboom, S.; de Jong, M.; Mutikainen, I.; Tanase, S.; Meijerink, A.;
Bouwman, E. Inorg. Chem.2015, 54, 11323–11329.
38.Cui, Y.; Xu, H.; Yue, Y.; Guo, Z.; Yu, J.; Chen, Z.; Gao, J.; Yang, Y.; Qian, G.;
Chen, B. J. Am. Chem. Soc.2012, 134, 3979–3982.
39.Leong, K.; Foster, M. E.; Wong, B. M.; Spoerke, E. D.; Van Gough, D.; Deaton,
J. C.; Allendorf, M. D. J. Mater. Chem. A2014, 2, 3389–3398.
40.Zhang, T.; Lin, W. Chem. Soc. Rev.2014, 43, 5982–5993.
41.Kent, C. A.; Mehl, B. P.; Ma, L.; Papanikolas, J. M.; Meyer, T. J.; Lin, W. J. Am.
Chem. Soc.2010, 132, 12767–12769.
42.Corma, A.; Garcia, H. Chem. Commun.2004, 1443.
43.Hisatomi, T.; Kubota, J.; Domen, K. Chem. Soc. Rev.2014, 43, 7520–7535.
44.Li, X.; Yu, J.; Jaroniec, M. Chem. Soc. Rev.2016, 45, 2603–2636.
45.Wang, C.; deKrafft, K. E.; Lin, W. J. Am. Chem. Soc.2012, 134, 7211–7214.
46.Williams, D. E.; Rietman, J. A.; Maier, J. M.; Tan, R.; Greytak, A. B.; Smith, M.
D.; Krause, J. A.; Shustova, N. B. J. Am. Chem. Soc.2014, 136, 11886–11889.
47.Sun, J.-K.; Cai, L.-X.; Chen, Y.-J.; Li, Z.-H.; Zhang, J. Chem. Commun.2011, 47,
6870–6872.
48.Wade, C. R.; Li, M.; Dincă, M. Angew. Chem. Int. Ed. Engl. 2013, 52, 13377–
CHAPTER 2
A BIO-INSPIRED APPROACH FOR CHROMOPHORE COMMUNICATION: LIGAND-TO-LIGAND AND HOST-TO-GUEST ENERGY TRANSFER IN HYBRID
CRYSTALLINE SCAFFOLDS
____________________
Efficient multiple-chromophore coupling in a crystalline metal–organic scaffold
was achieved by mimicking a protein system possessing 100 % energy-transfer (ET)
efficiency between a green fluorescent protein variant and cytochrome b562. The two
approaches developed for ET relied on the construction of coordination assemblies and
host–guest coupling. Based on time-resolved photoluminescence measurements in
combination with calculations of the spectral overlap function and Förster radius, we
demonstrated that both approaches resulted in a very high ET efficiency. In particular, the
observed ligand-to-ligand ET efficiency value was the highest reported so far for two
distinct ligands in a metal-organic framework. These studies provide important insights
for the rational design of crystalline hybrid scaffolds consisting of a large ensemble of
chromophore molecules with the capability of directional ET.
INTRODUCTION
Efficient energy utilization that could significantly affect the current energy
landscape involves a number of challenges, including achieving energy transfer (ET) in a
predesigned pathway. For example, to mimic the natural photosystem, possessing high
efficiency of directional ET, an artificial system should rely on the cooperative work of
hundreds of chromophores. Owing to the complexity of the hierarchical chromophore
organization, self-assembly typically becomes a key strategy to design ensembles with
efficient ET, mimicking the natural analogues. Coordination polymers possessing
well-defined rigid structures (for example, metal-organic frameworks (MOFs)) could
potentially address the existing challenges in the modeling of long- and short-range ET
processes.1–18 A great advantage of these crystalline scaffolds is that the distances and
angles between chromophores, as well as their molecular conformations, can be
or variation of the experimental conditions.21–43 Previously, the synthetic and structural
versatility of hybrid scaffolds was successfully deployed to design and study Dexter and
Förster ET mechanisms.1 However, development of the next generation of artificial
systems possessing enhanced and directional ET still requires new structural
insights.1,12,44
Results and Discussion
In designing the system presented here, we were inspired by the high ET
efficiency achieved in a protein system (a “bio-inspired approach”): a didomain protein
made from a green fluorescent protein variant (EGFP) and a heme-binding protein,
cytochrome b562 (cyt b562, Scheme 2.1).19 Through modulation of chromophore coupling,
Jones and co-workers showed that a rational design of the protein scaffold could lead to
nearly 100 % ET efficiency.19 Herein, we focused on replication of the efficient multiple
intermolecular chromophore coupling achieved in the protein system through integration
of chromophores with 4-hydroxybenzylidene imidazolinone (HBI) and porphyrin cores
into an artificial rigid framework (Scheme 2.1). Recently, we showed that a porous MOF
could be utilized as a mimic of the GFP b-barrel to maintain emission of HBI-based
chromophores, and, therefore, replicate the photophysical properties of natural GFP-like
systems.46 In the present study, we designed multiple-chromophore hybrid scaffolds for
modeling ET processes. The choice of chromophores with HBI and porphyrin cores was
dictated by the necessary overlap of the emission spectrum of the donor (HBI-based
derivative) with the absorption spectrum of the acceptor (porphyrin-based chromophore),
which is required to accomplish efficient resonance energy transfer (RET). With this in
mind, we prepared donor-acceptor pairs and developed two distinct approaches to
(Scheme 2.1). Approach I involved coordinative immobilization of
methyl-2-(4-(2,5-di(pyridin-4-yl)benzylidene)-2-methyl-5-oxo-4,5-dihydro-1H-imidazol-1-yl)acetate
(DPB-BI, donor) and tetrakis(4-carboxyphenyl)-porphyrin (H4TCPP, acceptor), which
resulted in formation of the crystalline MOFs. Approach II focused on non-coordinative
inclusion of benzylidene imidazolinone (BI) molecules (donor) inside a
three-dimensional (3D) porphyrin-based host (acceptor). The guest size, host aperture, and
chromophore photoluminescence (PL) responses were the main selection criteria in
Approach II to achieve efficient chromophore coupling. To the best of our knowledge,
the ligand-to-ligand ET efficiency (65 %), calculated based on the experimental
time-resolved PL data, is the highest value achieved so far between two distinct linkers in a
MOF matrix.
In Approach I, incorporation of DPB-BI and H4TCPP ligands into a rigid scaffold
was achieved using a stepwise procedure. The four-step synthesis and molecular structure
of the novel DPB-BI ligand utilized in scaffold preparation is described in the
experimental section. The first step of Approach I was preparation of a two-dimensional
Zn2(ZnTCPP) framework (Figure 2.1). Afterwards, coordinative immobilization of
DPB-BI was carried out through immersion of the Zn2(ZnTCPP) crystals into
N,N-dimethylformamide (DMF) or N,N-diethylformamide (DEF) solutions of DPB-BI.
Depending on the solvent choice in the second step, formation of two MOFs,
[Zn2(ZnTCPP)(DPB-BI)0.86(DMF)1.14]·(DMF)8.86(H2O)20 (1) and [Zn2(ZnTCPP)(DPB-
BI)0.64(DEF)0.36]·(DEF)6.94·(H2O)12.55 (1¢), were achieved (Figure 2.1). In Approach II
Scheme 2.1. (top) A schematic representation of ET between the two coupled chromophore cores of a green fluorescent protein variant (EGFP) and the electron-transfer protein, cytochrome b562.19
(bottom) Approaches I and II involved
incorporation of chromophores with HBI- and porphyrin-based cores inside the rigid scaffold. Approach I focused on coordinative immobilization of both chromophores in crystalline scaffolds 1 and 1¢ while Approach II is based on inclusion of the BI donor molecule in the porphyrin-based crystalline framework 2.
frameworks 1, 1¢, and BI@2 underwent comprehensive characterization by single-crystal
and powder X-ray crystallography, elemental and thermogravimetric analyses, and FT-IR
spectroscopy (Figures 2.1 and 2.2). Furthermore, the digested 1, 1¢, and BI@2 samples
(destroyed in the presence of acid) were analyzed by mass-spectrometry and 1H NMR
Figure 2.1. The X-ray structures of Zn2(ZnTCPP),45 DPB-BI, 1, and 1¢. Increase of
the interlayer distance occurred, owing to coordinative immobilization of DPB-BI.
The structural analysis of 1 and 1¢ is shown in Figure 2.1. The Zn2(ZnTCPP)
framework consists of two-dimensional (2D) layers in which ZnTCPP4- is coordinated to
paddle-wheel Zn2(O2C–)4 secondary building units (SBUs, Figure 2.1). Immersion of the
2.8 Å (O···O distance in Zn2(ZnTCPP)) to 11.5 Å (11.4 Å) (N···N distance in 1 (1¢)),
which is consistent with the DPB-BI length determined from its molecular structure
(11.45 Å, Figure 2.1). The powder X-ray diffraction (PXRD) studies of 1 and 1¢
confirmed the preservation of crystallinity during the two-step chromophore
immobilization procedure.
Structural analysis of 2 (Figure 2.2) revealed that the 3D framework utilized as a
host for the BI molecules consists of TCPP4— linkers connected to carboxylate-bridged
Pb2+ chains.47 More importantly, 2 contains 1D 8 × 11 Å channels suitable for BI
incorporation (Figure 2.2). The PXRD analysis showed that inclusion of BI molecules
does not affect the host crystallinity, and spectroscopic studies of digested BI@2 revealed
that the framework contains one guest molecule per two TCPP4— units (Figure 2.2).
To test whether ET can occur in the designed scaffolds, photophysical properties
of donor/acceptor molecules as well as 1, 1¢, and BI@2 were studied by diffuse
reflectance (DR), fluorescence, and time-resolved PL spectroscopies. For effective RET,
the emission spectrum of the HBI-based donor should overlap with the absorption
spectrum of the porphyrin-based acceptor. The absorption spectrum in the solid state was
evaluated by DR (Figure 2.3), and indicated the DPB-BI (donor) used for preparation of 1
is emissive in the range of 400–550 nm with lmax = 440 nm (lex = 365 nm). The BI
molecule used in Approach II exhibits a similar PL profile to DPB-BI and emits in the
same 400–550 nm range with lmax = 440 nm (lex = 365 nm, Figure 2.3). Notably, the
EGFP originally used in the didomain protein system (see above) fluoresces in the same
Figure 2.2. PXRD patterns of 2 and BI@2. The inset shows the single-crystal X-ray structure of 2. The grey arrow indicates the 1D channels suitable for BI incorporation. H atoms and guest solvent molecules were omitted for clarity.
Figure 2.3. (a) The DR spectrum of Zn2(ZnTCPP)
(dashed grey line) and emission spectra of DPB-BI (solid black line) and Zn2(ZnTCPP) (solid grey
the PL profiles of both BI and DPB-BI replicate the fluorescence response of the EGFP
that was initially used as a model for the HBI-based chromophore design.
Based on the DR data, both acceptors, Zn2(ZnTCPP) and framework 2, absorb
light up to 650 nm (Figure 2.3), which provides the necessary spectral overlap of their
absorption profiles with the donor emission responses. Coordinative immobilization of
both donor and acceptor moieties in rigid 1 and 1¢ resulted in complete disappearance of
donor emission (Figure 2.3), which could be attributed to efficient ET.7,48 To
quantitatively describe possible ET processes occurring in 1, 1¢, and BI@2, time-resolved
fluorescence decay measurements were carried out. The ET efficiency (FET) was
determined based on donor lifetimes in the presence and absence of the acceptor
molecules.48 We investigated the PL decays within the donor emission range to exclude
the PL response of porphyrin-based acceptors. Time-resolved decays for coordinatively
immobilized DPB-BI (DPB-BI-1 [or DPB-BI-1¢], in the presence of the acceptor) and
DPB-BI coordinated to Zn2+ (in the absence of the acceptor) demonstrated more rapid
decay than free DPB-BI. Analysis of the curves with a reconvolution fit supported a
triexponential decay model in each case and revealed a shortening of the
amplitude-weighted average lifetimes from 1.09 (DPB-BI) to 0.38 and 0.51 ns in the presence of the
acceptor molecules in 1 and 1¢, respectively (Table 2.1).
The estimated values of the corresponding FET and ET rate constant (kET) of 1
were found to be 65 % and 1.71 × 10¹⁰ s—1, respectively. Interestingly, slightly smaller
FET (53 %) was observed for 1¢ (Table 2.1), which could be attributed to the different
topology of 1¢, that is, the difference in stacking of 2D layers as shown in Figure 2.1.

![Figure 1.2. White light emission of ([CH3]2NH2)15([Cd2Cl]3[TATPT]4) (blue framework) with immobilized (Ir[ppy]2[bpy])+ (yellow sphere)](https://thumb-us.123doks.com/thumbv2/123dok_us/8339527.1381431/29.612.208.441.72.329/figure-white-emission-tatpt-framework-immobilized-yellow-sphere.webp)