O R I G I N A L A R T I C L E
Improving public services by mining citizen
feedback: An application of natural language
processing
Radoslaw Kowalski
1|
Marc Esteve
1,2|
Slava Jankin Mikhaylov
31
Department of Political Science, University College London, London, UK
2
ESADE - Ramon Llull University, Barcelona,
Spain
3
Data Science Lab, Hertie School of
Governance, Berlin, Germany
Correspondence
Marc Esteve, School of Public Policy,
University College London, The Rubin Building, 29/31 Tavistock Square, London
WC1H 9QU, UK.
Email: [email protected]
Funding information
Agència de Gestió d'Ajuts Universitaris i de Recerca, Grant/Award Number: SGR Program, 2017-SGR-1556; Ministerio de Economía y Competitividad, Grant/Award Number: CSO2016-80823-P
Abstract
Research on user satisfaction has increased substantially in
recent years. To date, most studies have tested the
signifi-cance of predefined factors thought to influence user
satis-faction, with no scalable means of verifying the validity of
their assumptions. Digital technology has created new
methods of collecting user feedback where service users
post comments. As topic models can analyse large volumes
of feedback, they have been proposed as a feasible
approach to aggregating user opinions. This novel approach
has been applied to process reviews of primary care
prac-tices in England. Findings from an analysis of more than
200,000 reviews show that the quality of interactions with
staff and bureaucratic exigencies are the key drivers of user
satisfaction. In addition, patient satisfaction is strongly
influenced by factors that are not measured by
state-of-the-art patient surveys. These results highlight the potential
benefits of text mining and machine learning for public
administration.
1
|
I N T R O D U C T I O N
Democratic governance is possible and effective when citizens' opinions are incorporated into public decisions (Mahmoud and Hinson 2012; Feldman 2014; Fung 2015). However, the opinions of citizens are difficult to capture. They are generally unrelated to the formal performance measures used within organizations (Harding 2012;
DOI: 10.1111/padm.12656
This is an open access article under the terms of the Creative Commons Attribution License, which permits use, distribution and reproduction in any medium, provided the original work is properly cited.
© 2020 The Authors.Public Administrationpublished by John Wiley & Sons Ltd.
Moynihan et al. 2014; Sanders and Canel 2015; Ma 2017) or the opinions of organization managers (Sanders and Canel 2015; Andersen and Hjortskov 2016). According to existing studies of citizen satisfaction, the nature of public opinion is determined by several factors, including the ways in which citizens use public services (Brown 2007; Van Ryzin and Charbonneau 2010; Im et al. 2012; Ladhari and Rigaux-Bricmont 2013; Pierre and Røiseland 2016), their involvement in providing such services (Scott and Vitartas 2008; Sanders and Canel 2015; Taylor 2015), and their held-out knowledge, beliefs (Brown 2007; Harding 2012; Ladhari and Rigaux-Bricmont 2013; Barrows et al. 2016) and emotions (Lawton and Macaulay 2013; Ma 2017). A continuous analysis of citizen preferences will help man-agers of public institutions make decisions that align with public needs (Walker and Boyne 2009)).
Digital technologies have created a host of new opportunities for collecting citizen feedback (Kong and Song 2016). On the one hand, these new data resources can be very insightful because they contain a full range of citi-zen opinions about public services, whereas traditional survey methods probe narrower sets of issues. For this rea-son, private sector organizations make extensive use of user comments (Qi et al. 2016), although few public sector organizations have followed suit (Hogenboom et al. 2016). On the other hand, the new data resources also create problems. First, the datasets can be too large to read or analyse manually (Kong and Song 2016). Second, the data obtained may consist predominantly of unstructured text, which is hard to summarize using statistical techniques (Kong and Song 2016). Finally, sample biases may be difficult to pinpoint because author identities are unknown (Yang 2010). The volume and structure of textual feedback, such as that derived from reviews, makes it difficult to understand the causes of user satisfaction in relation to public services. At the same time, the existing tools devel-oped for private organizations may not be suitable for use in the public sector. Public organizations require insights into service-user preferences in situations where citizens are‘forced customers’(Di Pietro et al. 2013) and where public organizations must fulfil objectives unrelated to service demand or profitability (Brownson et al. 2012).
The present study addresses the challenges associated with quantifying user satisfaction using unstructured tex-tual feedback. Unstructured and anonymous opinions can provide a substantial answer to the research question:
‘What are the determinants of user satisfaction in public services?’Large quantities of reviews can be summarized using natural-language processing (NLP) models, such as topic models, to obtain actionable insights (Blei et al. 2003; Hogenboom et al. 2016; Anastasopoulos and Whitford 2019). Insights drawn from topic modelling can be compared with other forms of analysis, such as surveys, to systematically evaluate the validity and reliability of text-derived insights. The present article makes two significant contributions to the public management field: (1) it evaluates a model of determinants of citizen satisfaction, constructed from a large corpus of written feedback; and (2) it offers a method of analysing big data that incorporates citizens' voices into public service reforms. These contributions reflect the use of NLP to solve a public management analytical problem.
2
|
U S E R S A T I S F A C T I O N F O R I N C L U S I V E P U B L I C P O L I C Y
of satisfaction may bias insights from commissioned studies in unpredictable ways. How, why and in what ways this happens can be entirely obscure (Pierre and Røiseland 2016).
As researchers choose from a wide range of theories when designing their opinion research, it is difficult to con-struct a robust, holistic understanding of the factors that matter most to public service users across multiple studies. Analysts may choose to emphasize the impact of available information (James and Moseley 2014; Marvel 2016), self-centred utility maximization (Jensen and Andersen 2015), emotions (Ladhari and Rigaux-Bricmont 2013), a sense of identity (Jlike et al. 2014), the unconscious tendency towards conformity (Sanders and Canel 2015) or the level of physical involvement with services under review (Loeffler 2016). In the end, it can be difficult to understand whether subconscious identification as a member of a group (Sanders and Canel 2015) interacts with, for instance, self-interest (Jensen and Andersen 2015), leading to a specific set of reasons why a given service user (dis)likes a specific public service. Similarly, it is not always clear why improved official performance measures often fail to generate equivalent citizen satisfaction levels (Brenninkmeijer 2016). Narratives used by citizens to explain their (dis)satisfac-tion may be unknown, even when their behaviour is well understood (Müssener et al. 2016). Politicians and policy-makers frequently struggle to include the citizen perspective in decisions, even when user-opinion studies are abun-dantly available.
The existing literature reveals a gap in our understanding of the relative importance of (and relationships between) the determinants of service user satisfaction, combined with few ways to assess whether any factors that influence user satisfaction have been omitted from citizen satisfaction evaluations. Citizens' written comments about public services are a big data resource that can address some gaps in our understanding of user satisfaction, making insights more useful for guiding policy-making. As citizen comments contain holistic insights into the reasons for user satisfaction, they can help to establish the relative importance of various issues. Machine learning can also be a use-ful tool for summarizing textual comments and retrieving relevant insights effectively (Anastasopoulos and Whitford 2019).
3
|
U S E R F E E D B A C K A S A M E A S U R E O F S A T I S F A C T I O N
Taking public opinion seriously is a prerequisite for successful democratic governance (Feldman 2014); this perspec-tive is needed to solve problems that relate to service output performance (Mahmoud and Hinson 2012; Fung 2015). The physical participation of citizens in public decision-making is one way for the authorities to engage with and understand service users' perceptions of public services (Fung 2015). This approach can facilitate institutional change and increase public satisfaction with public services (Moon 2015). At the same time, it can be difficult to include direct public participation in decisions that relate to complex policy areas. In an applied context, public partic-ipation may politicize and complicate administrative decisions that would otherwise be quick and straightforward, producing poor marginal returns (Bartenberger and Szesciło 2016). Moreover, in many institutional contexts, it is dif-ficult to generate enough interest among service users to keep them regularly involved in decision-making (Greer et al. 2014; Fung 2015). Liu (2016) has argued, using hands-on examples, that information technologies can produce a more complete understanding of service user preferences, leading to new modes of decision-making.
unsuitable for continuous opinion monitoring to observe organizational change in real time (Walker and Boyne 2009); Burton 2012). Feedback received through restricted lists of survey questions tends to oversimplify the rea-sons for user satisfaction (Amirkhanyan et al. 2013; Jlike et al. 2014). The structure of surveys may bias their results (Van de Walle and Van Ryzin 2011), while final survey outputs may blur the distinction between service providers with similar scores (Voutilainen et al. 2015). For these reasons, both practitioners and academics rely on other forms of data to determine user satisfaction with public services (Amirkhanyan et al. 2013; Lavertu 2014; Andersen et al. 2016; Brenninkmeijer 2016).
Alternative ways of measuring user satisfaction should map dynamic changes in the meaning of organizational per-formance across various contexts and timespans. Data-based insights must holistically capture and represent the role and significance of service users and other relevant individuals, including political decision-makers and public servants. The conceptualization of public service performance as an ever-changing phenomenon, defined in different ways by dif-ferent people, can help to avoid deficiencies in evidence-based policy-making. Such deficiencies include the suppression of the less powerful voice of service users within the performance measurement process (Mergel et al. 2016) and methods of measuring user satisfaction that quickly lose their relevance, requiring efforts to develop replacements (Gao 2015). Newly available data have the potential to improve public services by enabling dynamic performance monitoring (Rogge et al. 2017). For example, network signals and written feedback have been used to improve services in the areas of e-government, traffic control and crime detection (Rogge et al. 2017). New technologies require additional effort to make use of new data within the public policy domain. As the sheer volume of data may be challenging to handle (Grimmer and Stewart 2013; Anastasopoulos and Whitford 2019) decision-makers may struggle to collect, process, visualize and interpret them (Lavertu 2014; Brenninkmeijer 2016; Rogge et al. 2017). Public policy researchers have highlighted ethical issues inherent in handling personal data, from respect for individual privacy and security to concerns around the quality of democratic processes (Mergel et al. 2016). The tools developed to handle complex service user data must be designed to address such concerns, while adding value to the delivery of public services.
One data resource that captures and includes the voice of service users in public decision-making is written reviews of public services. Online written reviews can be posted anonymously, addressing privacy issues. Despite complex sample biases (Grimmer and Stewart 2013), they can provide decision-makers in public institutions with a valid resource. Online written reviews can be validated against state-of-the-art structured forms of user feedback, such as carefully drafted surveys involving large numbers of reviewers (Grimmer and Stewart 2013; Rogge et al. 2017). Furthermore, basic literacy requirements in any language, combined with access to the Internet, can turn online forums into a channel through which almost any public service user can contribute to and inform research and practice. As online forums are easy to use, written reviews represent a valuable resource for ensuring the equitable distribution of services (Kroll 2017) and addressing concerns about democratic deficits in public decision-making (Mergel et al. 2016). Moreover, organizations assessed through user reviews may find it harder to manipulate perfor-mance scores, a common problem with the current perforperfor-mance evaluations of public institutions (Hood and Dixon 2015, pp. 265–67). User reviews make it less likely that decision-makers will make poor decisions because they rely too heavily on very narrow understandings of service quality (Luciana 2013). Thus, online reviews can help organiza-tions understand and include citizen feedback when deciding how best to provide public services.
4
|
D A T A
The corpus of reviews was pre-processed, following standard practice (Grimmer and Stewart 2013; Anastasopoulos and Whitford 2019). The present study lower-cased and stemmed the tokens (words) and removed numbers, punctuation, stop words, tokens shorter than three characters and tokens that appeared fewer than 10 times or more than 100,000 times in the corpus. Pre-processing removed 46,277 terms that occurred 89,374 times in the GP reviews. The final corpus contained 9,148 terms, which occurred more than 8.5 million times in the dataset.
Each month, anonymous users posted between 3,000 and 5,000 written comments, accompanied by 5-point Likert-scale star ratings of six aspects of their GP service experiences. The Likert-scale star ratings referred to the fol-lowing survey statements: (1)‘Are you able to get through to the surgery by telephone?’(2)‘Are you able to get an appointment when you want one?’(3)‘Do the staff treat you with dignity and respect?’(4)‘Does the surgery involve you in decisions about your care and treatment?’(5)‘How likely are you to recommend this GP surgery to friends and family if they needed similar care or treatment?’and (6)‘This GP practice provides accurate and up-to-date infor-mation on services and opening hours’. The Likert-scale questions had stable formatting across the entire period when comments were posted, eliminating the risk of variable author comments or star ratings, due to fluctuating interpretations of the questions.
It should be noted that the users posting data had no known socio-demographic attributes, so the sample could have been skewed towards certain demographic groups. Anyone is free to comment on the NHS website or to evalu-ate a GP practice. A qualitative reading of the comments reveals that most comments are posted by patients or patients' caregivers, relatives or friends, especially when a significant positive or negative experience has affected them emotionally. Although a lack of Internet access or computer skills among some groups of patients may not pre-vent them from sharing opinions, it may make their participation less likely. In addition, NHS administrators manually remove malicious or inappropriate messages from the server, while ensuring that unfavourable but legitimate reviews remain in the dataset across England.
5
|
T O P I C M O D E L L I N G
One key challenge, when using written reviews to design inclusive public policy, is deciding how to process the reviews in a scalable way that public decision-makers will find meaningful. Fortunately, it is well known that machine-learning models, such as topic models, can simplify insights from any quantity of written reviews into easy-to-understand summaries in near real time (Blei et al. 2003; Griffiths and Steyvers 2004). In comparison to user surveys, these summaries have the advantage of being able to adapt automatically to changes in citizen com-ments (Blei and Lafferty 2006; Dai and Storkey 2015), without making prior assumptions or limiting which service elements reviewers are able to express opinions about (Blei et al. 2003). This function is especially useful when there are too many written documents to label manually, or when new documents are added to the dataset con-tinuously and require processing. Several studies have attempted to use machine-learning algorithms to analyse written user feedback on services as a way of achieving organizational improvement (Gray 2015; Rogge et al. 2017, Anastasopoulos and Whitford 2019). However, none of these studies has firmly established how key themes that appear in online written reviews, identified through topic modelling, relate to established measures of user satisfaction, such as satisfaction surveys. This knowledge gap must be filled before online written reviews can be used to reliably measure user satisfaction or support the provision of public services (Grimmer and Stewart 2013; Rogge et al. 2017). The relationship between survey outcomes and the content of written reviews can help researchers understand how reviewer narratives relate to the dimensions of public service satisfaction included in the survey.
presence of each topic in each document was estimated (Blei 2012). The review topics included thanking doctors, complaining about reception staff and commenting on the quality of GP facilities.
We calculated the topic proportions in comments by analysing the topic that each word in a comment was likely to relate to. In this, we adopted the form of topic-model description proposed by Blei et al. (2003). The probabilities of each word belonging to each topic were estimated during model training. The algorithm began model training with a random allocation of topics to every document in the corpus, a form of probability distribution. Each topic had a probability of 0–1 of occurring in a document, with the topic probabilities in the document adding up to 1. Next, for each word in every document, the algorithm picked a topic from the probability distribution of topics assigned to the document. After we had reviewed all of the documents, each word had some probability of belonging to each topic; given a particular word, there was some likelihood of a topic being chosen. The algorithm then attempted to repro-duce the original text documents by picking random words from topics, in accordance with the topic-word probabil-ity distributions, based on the probabilprobabil-ity of each topic appearing in each document. The mismatch between the chosen words and the word content of the original documents constituted model loss; this loss was minimized itera-tively during model training.
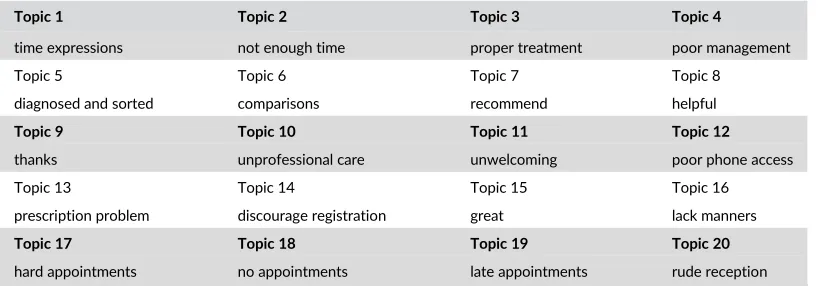
The model required a human analyst to select the number of topics to be uncovered within the dataset. We followed Roberts et al. (2015) in selecting the optimal number of topics by balancing exclusivity and semantic coher-ence in models ranging between three and 100 topics. Our analysis found that 20 topics was the optimal setting for our objective: to evaluate how well textual comments could be analysed through machine learning, for use in public policy research. Models with fewer than 20 topics suffered from lower topic exclusivity, meaning that topics were less likely to represent distinct meanings. Models with more than 20 topics showed no improvement in semantic coherence or topic exclusivity, although they contained more complex insights than the 20-topic model. However, greater complexity was not required to answer the research question. Appendix A in the supplementary materials discusses the selection process in more detail. The 20 topics in the selected model are listed in Table 1. Appendix B details the topic-labelling exercise, providing additional information on the content and frequency of topics in the data.
The map of topic correlations in Figure 1 is a convenient way of summarizing the topic-modelling results.3It enables comparisons between topics, based on the use of similar words in topic pairs. The greater the distance and the thinner the connecting line between two topics, the less likely they are to occur together within reviews. Clusters of related topics are represented by node symbols. In this case, the˅symbol represented negative experiences, symbol˄topics represented positive experiences, and symbol = topics indicated themes without a strong positive or negative sentiment. The topic clusters were calculated using a sentiment-analysis model trained to predict star ratings (for further details, see appendix D). The node size of a topic corresponded to its popularity across patient reviews. Larger nodes indicated more common topics.
T A B L E 1 Topic labels 20-topic STM model, labelled by the authors
Topic 1 Topic 2 Topic 3 Topic 4
time expressions not enough time proper treatment poor management
Topic 5 Topic 6 Topic 7 Topic 8
diagnosed and sorted comparisons recommend helpful
Topic 9 Topic 10 Topic 11 Topic 12
thanks unprofessional care unwelcoming poor phone access
Topic 13 Topic 14 Topic 15 Topic 16
prescription problem discourage registration great lack manners
Topic 17 Topic 18 Topic 19 Topic 20
In Figure 1, positive topics appear on the left side of the map. These topics are the most different from those that contain negative GP service evaluations, located in the top right-hand corner of the map. The second greatest difference is between topics that cluster words used to express personal thoughts and feelings (at the top of the map) and those that contain words used in third-person narratives or written in the passive voice (at the bottom of the map). The most common topics include expressions of gratitude and complaints about the difficulty/impossibility of accessing services.
6
|
E X P L A I N I N G U S E R S A T I S F A C T I O N W I T H F E E D B A C K
As discussed above, the GP reviews in our dataset came with Likert-scale survey responses, a common and accepted measure of user satisfaction (Hartley and Betts 2010). In the present study, they provided a well-established tem-plate measure, related to the metrics of user satisfaction derived from topic modelling. We began by estimating Ran-dom Forest (RF) models, in which the proportional presence of topic reviews constituted independent variables and six Likert-scale ratings were treated as dependent variables.
RF is a machine-learning algorithm that builds decision trees on randomly sampled data with a smaller sub-set of randomly sampled predictors. Many trees are grown, combined and averaged to create a trained RF model. RF takes advantage of both weak and strong predictor variables, with the weak variables making predictions that are only slightly better at predicting outcomes than random guesses. In addition to being easier to interpret than other popular machine-learning algorithms, this model captures non-linear relationships between predictors and predicted variables. By design, RF models also address multicollinearity between predictor variables, enabling researchers to unambiguously identify the importance of topics identified using an STM analysis when predicting Likert-scale rat-ings. RF belongs to the same family of tree-based machine-learning models as the gradient-boosted trees introduced to the public management literature by Anastasopoulos and Whitford (2019).4
F I G U R E 1 Topic map for the 20-topic STM model
Our multiclass RF model predicts outcome variables with a level of accuracy that ranges from 0.48 for‘ phone-access ease’to 0.77 for‘likely to recommend’dimensions. Precision and recall measures vary across‘star’levels and dimensions, with the F1 score ranging from close to zero to 0.85.5This variation is driven in part by sample-size
dif-ferences across different models (as shown in the confusion matrices in appendix E). Overall, the present study has captured aspects of the relationship between unstructured data (reviews summarized using topic models) and struc-tured data (Likert-scale‘star’ratings).
Figure 2 presents the results of the RF model, showing the importance ranking of the independent variables used to predict each Likert-scale outcome variable.6The RF outcomes indicate that the topics generated from online reviews were related to the Likert-scale responses provided by service users. Furthermore, user satisfaction with multiple aspects of the GP service has a clear relationship with similar themes that appeared in user reviews. This finding suggests that user satisfaction could be improved across multiple dimensions by adopting a single approach that addresses important common problems and by enhancing key positive experiences.
F I G U R E 2 Random Forest model results—the importance rankings of topics related to six dimensions of GP service quality
The topics drawn from the 20-topic STM model were labelled in accordance with the most common words they contained. Topics related to positive experiences were the strongest predictor of satisfaction, with topic 7 (‘ recom-mend’) being the most important, followed by topics 9‘thanks’and 8‘helpful’. The most common words in topic 7 included:‘thank’,‘recommend’,‘support’and‘kind’(see appendix B for details). The topic content indicated that caring staff behaviour towards patients was the most powerful positive factor influencing patient evaluations of GP services. Similarly, staff rejection of patients was the most powerful negative factor influencing patient evaluations of their experience. Topics 14‘discourage registration’and 18‘no appointments’belonged to a group of user opin-ions that expressed disappointment at being treated disrespectfully (topic 14) or being unable to access services— possibly because demand outstripped supply (topic 18). The lead topics showed that patients wanted to be treated by caring professionals.
More neutral experiences, represented by topics such as ‘proper treatment’, ‘diagnosed and sorted’ and
‘unwelcoming’ tended to be good predictors of a neutral sentiment (Figure 1). They had a weaker impact on the Likert-scale ratings. Among negative experiences, the quality of medical care was less important to patients than non-medical issues. Procedural problems with making an appointment had a strong negative impact on GP service evaluations. The number of patients who found it difficult to book appointments by telephone, online or on-site suggested that the NHS was not a fully efficient organization. Procedural problems increase the cost of providing GP services (especially administrative costs), without adding any value. They also worsen the atmosphere in GP prac-tices, as suggested by topic 20‘rude reception’, which appeared consistently among the top 10 topics predicting star ratings (Figure 2).
Overall, our analysis suggests that access to healthcare services has the highest impact on patient experience, among all issue areas that do not relate to the quality of services offered by doctors and nurses. Improvements to this GP service dimension could boost patient satisfaction and provide cost-cutting opportunities within the NHS. It is plausible to argue that, if GP staff and patients spent less time on administration, the most important predictor of patient satisfaction with GP services (positive interactions with medical and non-medical GP staff) could be enhanced, raising patient satisfaction levels. To satisfy patients, it is less important to improve waiting times for scheduled appointments than to ensure that patients can schedule appointments when they need to. On a national scale, it would be more financially feasible to improve the system for booking appointments than to shorten appoint-ment waiting times overall. Importantly, the NHS did not include topic 2‘not enough time’in its most comprehensive GP Patient Survey,7designed to gauge patient opinions of GP services. The words in topic 2 were used to comment
on appointment brevity. The fact that this topic was omitted from a national survey is problematic and worrying—it could lead to inaccurate assessments of the factors that affect patient satisfaction.
Although the insights generated by the present study reflect a similar but wider range of patient issues than those obtained from patient surveys, they must also be treated with care. For example, it is evident that topic 10‘unprofessional care’is one of the less important predictors of overall patient satisfaction. However, some issues that are less salient at a national level may have a significant impact in specific local contexts or for smaller groups of individuals with a particular concern. In addition, many issues that did not make it into the top 20 topics extracted from a dataset of over 200,000 reviews are likely to be very important to smaller groups of individuals.
Overall, the Likert-scale evaluations were firmly related to topics involving medical and administrative service experiences. The relationships between service users and GP staff, service accessibility, and the care and profession-alism shown to users by GP staff were among the most important satisfaction-related factors involving GP services. Less important were waiting times for previously scheduled appointments and instances of perceived medical mis-treatment. General opinions were less important in the patients' Likert-scale ratings, probably because mixed senti-ments were grouped into those topics. They include‘time expressions’(topic 1) and‘comparisons’(topic 6).
7
|
R O B U S T N E S S A N A L Y S I S
Fixed-effects models were used to establish whether the statistically significant correlations between topics identi-fied in the textual comments and star ratings continued to hold after other relevant variables were controlled for. For the sake of simplicity, topic proportions were grouped into negative, neutral and positive clusters, as indicated by the symbols scheme in Figure 1. The percentage of positive and negative topics in comments was used as an inde-pendent variable in fixed-effects models. Neutral topics were not used in the models to avoid any problem with multicollinearity (topic proportions in reviews always add up to 1). Patient reviews were pooled by month posted and NHS commissioning group. The grouping data made it easier to carry out calculations using fixed-effect models. Administrative data on GP practices were used to link GP comments to the Clinical Commissioning Groups (CCGs, mid-level units of NHS administration) that distribute funding to GP practices.8The regional management styles of
the NHS managers who disburse funds to GP practices and the month in which reviews are posted may affect patient satisfaction.
Two control variables were also used: GP practice size (expressed as the number of registered patients in a prac-tice) and the average level of socioeconomic deprivation of patients registered with specific GP practices. The num-ber of registered patients in each area of England (LSOA, Lower Layer Super Output Area—about 300 households per area)9was merged with data on levels of deprivation at each LSOA10to calculate the two control variables.
Dataset mergers resulted in the inclusion of 205,214 reviews. We removed 3,073 reviews with missing attributes. Reviews of new, closed down and/or less popular GP practices were more likely to be removed. On average, there were 17.7 reviews per CCG and month, during the months when GPs funded by a given CCG received feedback. The panel dataset consisted of 11,594 cells for 209 CCGs over 60 months. There were almost 10,000 patients regis-tered in a CCG, on average; the average IMD deprivation score was 5.37.
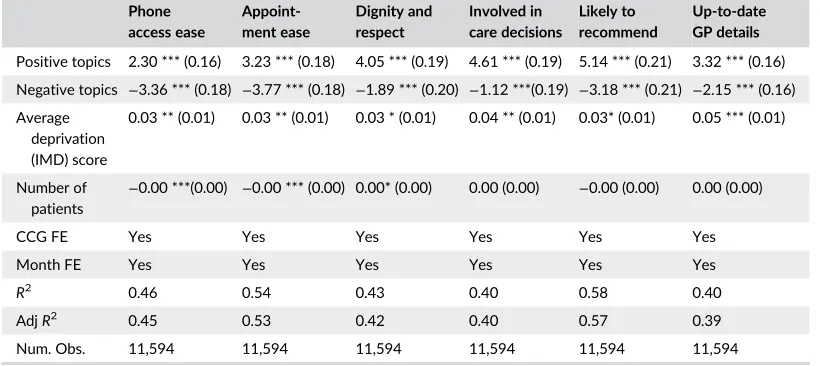
The results of the linear two-way (CCG and month) fixed-effects model are presented in Table 2.11Taking into
account the available control variables, these results suggest that what patients write is significantly correlated to how they rate their experiences. More prevalent clusters of positive topics in reviews predicted higher star ratings, while more prevalent clusters of negative topics predicted lower star ratings. While we could not access external data to validate these results, this expected direction of coefficients on positive and negative topic-cluster variables, when other covariates were controlled for, represented a weak form of validation. Another finding is that levels of deprivation in areas served by GP practices, combined with GP practice sizes, do not meaningfully change the rela-tionship between star ratings and topics.
As part of the robustness analysis, we replicated the key analysis, using an alternative number of estimated STM topics. In addition to our main 20-topic model, we also estimated 5-, 10-, 30- and 40-topic models. The results are presented in the supplementary materials in appendix C.
8
|
L I M I T A T I O N S
The limitations of the present study reflect the relatively low patient response rate. GP practices received approxi-mately 27 reviews on average over a period of almost four and a half years, making it difficult to compare individual practices. We therefore limited our comparisons to mid-level administrative areas (CCGs). Given the effectiveness of the modelling approach, feedback frequency is the prime limitation to real-time performance evaluations or evalua-tions on a more granular level. In addition, biases in the sample of patient experiences analysed using the topic model were unknown and hard to predict (e.g., Xiang et al. 2017).
unavoidable uncertainty over how many topics to generate to best represent reviews; and (3) crude assumptions made about natural language in the design of the topic model.
Given this context, we recommend combining topic-model results obtained from online reviews with a represen-tative and systematic survey of service user opinions about their service experiences. Such a comparison could establish the representativeness of topic-modelling outcomes. For the NHS, the GP Patient Survey is the most sys-tematic and regularly collected opinion survey of GP services in England (Cowling et al. 2015). It could therefore be used to validate topic-model outcomes. Validated topic models can, in turn, be used to decrease the frequency and cost of data collection through mass patient surveys by obtaining proxy survey values from textual comments. More-over, this could allow researchers to include individual-level variables such as the demographics and the attitudes of service users. This could represent an important step towards generating a comprehensive model of user satisfaction for public services.
9
|
C O N C L U S I O N
Textual comments posted by citizens and processed using machine learning can address the deficit in citizens' contri-butions to the public service innovation process (De Vries et al. 2016; O'Leary 2016). Decisions about reforming public services are increasingly backed by data (Hood and Dixon 2015). Cues can come from small-sample qualitative studies (Salt et al. 2012), citizen surveys (Van Ryzin and Charbonneau 2010) or easy-to-access quantitative measures of citizen behaviour, such as the number of visits made to public service providers (Hood and Dixon 2015). Although qualitative studies offer comprehensive insights, their small sample sizes and high data collection costs make them unfeasible for decision-making. While surveys are reliable, they cover narrow sub-samples of citizen experiences.
T A B L E 2 Two-way fixed-effects models
Phone access ease
Appoint-ment ease
Dignity and respect
Involved in care decisions
Likely to recommend
Up-to-date GP details
Positive topics 2.30 *** (0.16) 3.23 *** (0.18) 4.05 *** (0.19) 4.61 *** (0.19) 5.14 *** (0.21) 3.32 *** (0.16) Negative topics −3.36 *** (0.18) −3.77 *** (0.18) −1.89 *** (0.20) −1.12 ***(0.19) −3.18 *** (0.21) −2.15 *** (0.16) Average
deprivation (IMD) score
0.03 ** (0.01) 0.03 ** (0.01) 0.03 * (0.01) 0.04 ** (0.01) 0.03* (0.01) 0.05 *** (0.01)
Number of patients
−0.00 ***(0.00) −0.00 *** (0.00) 0.00* (0.00) 0.00 (0.00) −0.00 (0.00) 0.00 (0.00)
CCG FE Yes Yes Yes Yes Yes Yes
Month FE Yes Yes Yes Yes Yes Yes
R2 0.46 0.54 0.43 0.40 0.58 0.40
AdjR2 0.45 0.53 0.42 0.40 0.57 0.39
Num. Obs. 11,594 11,594 11,594 11,594 11,594 11,594
Notes: Outcomes of the two-way fixed-effects models take into account variance in the review data, reflecting differences between Clinical Commissioning Groups (NHS units responsible for funding allocations to GP practices) and monthly time periods when the reviews were posted. Likert-scale star ratings are the dependent variables. The topic proportions within documents are the independent variables. The topic proportions have been clustered into positive, negative and neutral categories—in line with the schema in Figure 1. The neutral cluster has been excluded to avoid perfect multicollinearity. The models include two control variables. The average index of multiple deprivation (IMD) score (1 is the best and 100 is the worst) includes patients using GP services, as well as the number of patients registered at a reviewed GP practice (a proxy value correcting for GP size). Robust standard errors for coefficients are reported in parentheses. Significance:
Any understanding of public issues derived from survey data will limit and bias insights by over-emphasizing what is known. Behavioural data provide little or no information on the reasons for certain behaviours; as a consequence, decisions based on these data are likely to produce undesirable side-effects.
The systematic and exhaustive inclusion of citizen voices, processed using machine learning, therefore repre-sents a substantial and desirable improvement over other prominent methods of incorporating citizen views into political and public policy decision-making. Large datasets can be processed to identify a full spectrum of citizens' concerns. In the healthcare domain, this approach can generate a better understanding of the narratives that drive patient behaviours, enabling providers to deliver more cost-effective healthcare (McClellan 2011; Vlaev et al. 2016; Eton et al. 2017). Half of all deaths in the United States are self-inflicted; this figure gives some idea of the propor-tion of healthcare costs that could be avoided through behavioural changes (Vlaev et al. 2016).
Insights can be obtained very quickly from large samples of patient feedback. These insights will illuminate areas that have been wholly excluded from the most comprehensive survey of the GP service experience. For example, the present study shows that GP practice management style (topic 4) and appointment availability are equally impor-tant to patients. Of these two issues, however, only the latter was included in the GP Patient Survey. Insights from surveys that omit salient issues reported by patients may cause the NHS to make sub-optimal decisions when attempting to improve the service experience of patients.
The present investigation of issues that make patients happy and unhappy, notwithstanding unknown sample biases, may help administrators in the National Health Service identify and learn from successful GP practices across England. Patient feedback can be clustered by NHS institution, providing insight into patterns of satisfaction and GP management styles across the country. These findings can also help to identify GP services with poor telephone access or other factors that require improvement. The reviews themselves can be clustered by topical structure and Likert-scale satisfaction levels to reveal prevalent user narratives about the service experience. It is essential for the NHS to better understand where, how and why such user narratives occur. It is difficult to identify and analyse large volumes of user reviews without creating a quantitative representation of their content.
The insights generated by this study also point to key challenges facing public institutions. If the NHS could overcome these challenges at a national (rather than GP or CCG) level, the service would become more efficient in meeting the needs of all patients. Many patients express frustration with struggling to make GP appointments. If such comments are sufficiently frequent, machine-learning models could generate near real-time insights into patient satisfaction on the level of individual GP practices or doctors. They could also show how specific policies affect patients over time, whether some areas of England have significant shifts in perceived GP service quality, and how the impact of NHS decisions varies in different locations.
Finally, these findings may inform public preferences regarding NHS services. In addition to accessing a limited range of hard figures produced by the NHS, citizens should be able to obtain information about current NHS chal-lenges, as seen through the lens of actual GP reviews written by patients. Quantitative summaries of written feed-back at the national or regional level offer an extra advantage to members of the public who are lobbying for improvements.
F U N D I N G I N F O R MA T I O N
Agència de Gestió d'Ajuts Universitaris i de Recerca, SGR Program, 2017-SGR-1556; Ministerio de Economía y Com-petitividad, CSO2016-80823-P.
O R C I D
Marc Esteve https://orcid.org/0000-0002-9732-8082
E N D N O T E S
1For more information on user comments about NHS services, see:
https://www.nhs.uk/about-us/manage-user-comments/.
2Further details about the R programming-languagestmsoftware library used for model implementation are available at:
https://CRAN.R-project.org/package=stm.
3The topic map was generated using Gephi, a software package for network modelling. For further information about
Gephi, please visit: http://gephi.org.
4For a more detailed explanation of RF models see, for example, Hastie et al. (2001, pp. 587–603). 5
For an overview of the performance metrics of such machine-learning algorithms, see Anastasopoulos and Whitford (2019).
6
We have highlighted only the top 10 most important predictors to simplify the plot presentation.
7More information on the GP Patient Survey is available at: https://gp-patient.co.uk/surveysandreports.
8Source: http://content.digital.nhs.uk/catalogue/PUB18468, currently available as an archived page at https://
webarchive.nationalarchives.gov.uk/20180328140206/http://digital.nhs.uk/catalogue/PUB18468.
9Source: https://data.gov.uk/dataset/numbers-of-patients-registered-at-a-gp-practice-lsoa-level. 10Source: https://www.gov.uk/government/statistics/english-indices-of-deprivation-2015. 11
All fixed-effects models were calculated using the R programming language andplmpackage.
R E F E R E N C E S
Amirkhanyan, A. A., Kim, H. J., & Lambright, K. T. (2013). The performance puzzle: Understanding the factors influencing alternative dimensions and views of performance.Journal of Public Administration Research and Theory,24(1), 1–34. Anastasopoulos, J. L., & Whitford, A. B. (2019). Machine learning for public administration research, with application to
orga-nizational reputation.Journal of Public Administration Research and Theory,29(3), 491–510.
Andersen, L. B., Heinesen, E., & Pedersen, L. H. (2016). Individual performance: From common source bias to institutional-ized assessment.Journal of Public Administration Research and Theory,26(1), 63–78.
Andersen, S. C., & Hjortskov, M. (2016). Cognitive biases in performance evaluations. Journal of Public Administration Research and Theory,26(4), 647–662.
Barrows, S., Henderson, M., Peterson, P. E., & West, M. R. (2016). Relative performance information and perceptions of pub-lic service quality: Evidence from American school districts.Journal of Public Administration Research and Theory,26(3), 571–583.
Bartenberger, M., & Szesciło, D. (2016). The benefits and risks of experimental co-production: The case of urban redesign in Vienna.Public Administration,94(2), 509–525.
Blei, D. M. (2012). Probabilistic topic models.Communications of the ACM,55(4), 77–84.
Blei, D. M., & Lafferty, J. D. (2006). Dynamic topic models.Proceedings of the 23rd International Conference on Machine Learn-ing, 113–120.
Blei, D. M., Ng, A. Y., & Jordan, M. I. (2003). Latent dirichlet allocation.Journal of Machine Learning Research,3, 993–1022. Brenninkmeijer, A. (2016). Interfaces: How to connect effectively with citizens.Public Administration Review,77(1), 10–11. Brown, T. (2007). Coercion versus choice: Citizen evaluations of public service quality across methods of consumption.
Pub-lic Administration Review,67(3), 559–572.
Brownson, R. C., Allen, P., Duggan, K., Stamatakis, K. A., & Erwin, P. C. (2012). Fostering more effective public health by identifying administrative evidence-based practices: A review of the literature.American Journal of Preventive Medicine,
43(3), 309–319.
Christensen, T., & Lægreid, P. (2005). The relative importance of service satisfaction, political factors, and demography. Pub-lic Performance and Management Review,28(4), 487–511.
Cowling, T. E., Harris, M. J., & Majeed, A. (2015). Evidence and rhetoric about access to UK primary care.British Medical Jour-nal,350, h1513.
Dai, A. M., & Storkey, A. J. (2015). The supervised hierarchical dirichlet process.IEEE Transactions on Pattern Analysis and Machine Learning,37(2), 243–255.
De Vries, H., Bekkers, V., & Tummers, L. (2016). Innovation in the public sector: A systematic review and future research agenda.Public Administration,94(1), 146–166.
Di Pietro, L., Mugion, R., & Renzi, M. F. (2013). An integrated approach between lean and customer feedback tools: An empirical study in the public sector.Total Quality Management and Business Excellence,24(7–8), 899–917.
Eton, D. T., Ridgeway, J. L., Linzer, M., Boehm, D. H., Rogers, E. A., Yost, K. J.,…& Anderson, R. T. (2017). Healthcare pro-vider relational quality is associated with better self-management and less treatment burden in people with multiple chronic conditions.Patient Preference and Adherence,11, 1635–1646.
Feldman, D. L. (2014). Public value governance or real democracy.Public Administration Review,74(4), 504–505.
Fung, A. (2015). Putting the public back into governance: The challenges of citizen participation and its future.Public Admin-istration Review,75(4), 513–522.
Gao, J. (2015). Pernicious manipulation of performance measures in China's cadre evaluation system.China Quarterly,223, 618–637.
Gray, M. (2015). The social media effects of a few on the perceptions of many.Public Administration Review,75(4), 607–608. Greer, S. L., Wilson, I., Stewart, E., & Donnelly, P. D. (2014).‘Democratizing’public services? Representation and elections in
the Scottish NHS.Public Administration,92(4), 1090–1105.
Griffiths, T. L., & Steyvers, M. (2004). Finding scientific topics.Proceedings of the National Academy of Sciences of the United States of America,101(S1), 5228–5235.
Grimmer, J., & Stewart, B. M. (2013). Text as data: The promise and pitfalls of automatic content analysis methods for politi-cal texts.Political Analysis,21(3), 267–297.
Harding, J. (2012). Choice and information in the public sector: A higher education case study.Social Policy and Society,11
(2), 171–182.
Hartley, J., & Betts, L. R. (2010). Four layouts and a finding: The effects of changes in the order of the verbal labels and numerical values on Likert-type scales.International Journal of Social Research Methodology,13(1), 17–27.
Hastie, T., Tibshirani, R., & Friedman, J. (2001).The elements of statistical learning. New York: Springer.
Hogenboom, F., Frasincar, F., Kaymak, U., de Jong, F., & Caron, E. (2016). A survey of event extraction methods from text for decision support systems.Decision Support Systems,85, 12–22.
Hong, S. (2015). Citizen participation in budgeting: A trade-off between knowledge and inclusiveness?Public Administration Review,75(4), 572–582.
Hood, C., & Dixon, R. (2015). What we have to show for 30 years of New Public Management: Higher costs, more com-plaints.Governance,28(3), 265–267.
Im, T., Cho, W., Porumbescu, G., & Park, J. (2012). Internet, trust in government, and citizen compliance.Journal of Public Administration Research and Theory,24(3), 741–763.
James, O., & Moseley, A. (2014). Does performance information about public services affect citizens' perceptions, satisfac-tion and voice behaviour? Field experiments with absolute and relative performance informasatisfac-tion.Public Administration,
92(2), 493–511.
Jensen, U. T., & Andersen, L. B. (2015). Public service motivation, user orientation, and prescription behaviour: Doing good for society or for the individual user?Public Administration,93(3), 753–768.
Jlike, S., Meuleman, B., & Van de Walle, S. (2014). We need to compare, but how? Measurement equivalence in comparative public administration.Public Administration Review,75(1), 36–48.
Kong, H.-S., & Song, E.-J. (2016). A study on customer feedback of tourism service using social big data.Information,19, 49–54.
Kroll, A. (2017). Can performance management foster social equity? Stakeholder power, protective institutions, and minority representation.Public Administration,95(1), 22–38.
Ladhari, R., & Rigaux-Bricmont, B. (2013). Determinants of patient satisfaction with public hospital services.Health Market-ing Quarterly,30(4), 299–318.
Lavertu, S. (2014). We all need help:‘Big data’and the mismeasure of public administration.Public Administration Review,76
(6), 864–872.
Lawton, A., & Macaulay, M. (2013). Localism in practice: Investigating citizen participation and good governance in local gov-ernment standards of conduct.Public Administration Review,74(1), 75–83.
Loeffler, E. (2016). Coproduction of public outcomes: Where do citizens fit in?Public Administration Review,76(3), 436–437. Luciana, A. (2013). Organizational learning and performance. A conceptual model.Proceedings of the 7th International
Man-agement Conference, 547–556.
Ma, L. (2017). Performance management and citizen satisfaction with the government: Evidence from Chinese municipali-ties.Public Administration,95(1), 39–59.
Mahmoud, M. A., & Hinson, R. E. (2012). Market orientation in a developing economy public institution: Revisiting the Kohli and Jaworski framework.International Journal of Public Sector Management,25(2), 88–102.
Marvel, J. D. (2016). Unconscious bias in citizens' evaluations of public sector performance.Journal of Public Administration Research and Theory,26(1), 143–158.
McClellan, M. (2011). Reforming payments to healthcare providers: The key to slowing healthcare cost growth while improving quality?Journal of Economic Perspectives,25(2), 69–92.
Mergel, I., Rethemeyer, K. R., & Isett, K. (2016). Big data in public affairs.Public Administration Review,76(6), 928–937. Moon, S. J. (2015). Commentary: Citizen empowerment: New hope for democratic local governance.Public Administration
Review,75(4), 584.
Moynihan, D. P., Herd, P., & Harvey, H. (2014). Administrative burden: Learning, psychological, and compliance costs in citizen–state interactions.Journal of Public Administration Research and Theory,25(1), 43–69.
Müssener, U., Bendtsen, M., McCambridge, J., & Bendtsen, P. (2016). User satisfaction with the structure and content of the NEXit intervention, a text messaging-based smoking cessation programme.BMC Public Health,16, 1179.
O'Leary, I. (2016). Big data in public affairs.Public Administration Review,76(6), 928–937.
Olsen, A. L. (2015). Citizen (dis)satisfaction: An experimental equivalence framing study.Public Administration Review,75(3), 469–478.
Pierre, J., & Røiseland, A. (2016). Exit and voice in local government reconsidered: A‘choice revolution’?Public Administra-tion,94(3), 738–753.
Qi, J., Zhang, Z., Jeon, S., & Zhou, Y. (2016). Mining customer requirements from online reviews: A product improvement perspective.Information and Management,53(8), 951–963.
Roberts, M. E., Steward, B. M., & Tingley, D. (2015). Navigating the local modes of big data: The case of topic models. In M. R. Alvarez (Ed.),Computational social science(pp. 51–97). New York: Cambridge University Press.
Roberts, M. E., Steward, B. M., Tingley, D., Lucas, C., Leder-Luis, J., Kushner-Gadarian, S.,…& Rand, D. G. (2014). Structural topic models for open-ended survey responses.American Journal of Political Science,58(4), 1064–1082.
Rogge, N., Agasisti, T., & De Witte, K. (2017). Big data and the measurement of public organizations' performance and effi-ciency: The state-of-the-art.Public Policy and Administration,32(4), 263–281.
Salt, E., Rowles, G. D., & Reed, D. B. (2012). Patient's perception of quality patient–provider communication.Orthopaedic Nursing,31(3), 169–176.
Sanders, K., & Canel, M. J. (2015). Mind the gap: Local government communication strategies and Spanish citizens' percep-tions of their cities.Public Relations Review,41(5), 777–784.
Scott, D., & Vitartas, P. (2008). The role of involvement and attachment in satisfaction with local government services. Inter-national Journal of Public Sector Management,21(1), 45–57.
Song, M., & Meier, K. J. (2018). Citizen satisfaction and the kaleidoscope of government performance: How multiple stake-holders see government performance.Journal of Public Administration Research and Theory,28(4), 489–505.
Taylor, C. D. (2015). Property tax caps and citizen perceptions of local government service quality: Evidence from the Hoo-sier Survey.American Review of Public Administration,45(5), 525–541.
Van de Walle, S., & Van Ryzin, G. G. (2011). The order of questions in a survey on citizen satisfaction with public services: Lessons from a split-ballot experiment.Public Administration,89(4), 1436–1450.
Van Ryzin, G. G., & Charbonneau, E. (2010). Public service use and perceived performance: An empirical note on the nature of the relationship.Public Administration,88(2), 551–563.
Villegas, J. A. (2017). Perception and performance in effective policing.Public Administration Review,77(2), 240–241. Vlaev, I., King, D., Dolan, P., & Darzi, A. (2016). The theory and practice of‘nudging’: Changing health behaviors.Public
Administration Review,76(4), 550–561.
Voutilainen, A., Pitkaaho, T., Kvist, T., & Vehvilainen-Julkunen, K. (2015). How to ask about patient satisfaction? The visual analogue scale is less vulnerable to confounding factors and ceiling effect than a symmetric Likert scale.Journal of Advanced Nursing,72(4), 946–957.
Walker, R. M., & Boyne, G. A. (2009). Introduction: Determinants of performance in public organizations.Public Administra-tion,87(3), 433–439.
Xiang, Z., Du, Q., Ma, Y., & Fan, W. (2017). A comparative analysis of major online review platforms: Implications for social media analytics in hospitality and tourism.Tourism Management,58, 51–65.
Yang, Y. (2010). Adjusting for perception bias in citizens' subjective evaluations.Public Performance and Management Review,
S U P P O R T I N G I N F O R M A T I O N
Additional supporting information may be found online in the Supporting Information section at the end of this article.