A STUDY TO EXPLORE THE IMPACT OF EMOTIONAL INTELLIGENCE AMONG THE DOCTORS WORKING IN COIMBATORE CITY
Geetha M ,PhD Scholar Nehru College of Management Nehru Gardens, ThirumalayamPaalayam
Coimbatore, Tamil Nadu-641105
Dr.S. Franklin John,Research Supervisor Principal and Professor
Nehru College of Management Nehru Gardens, Thirumalayam Paalayam
Coimbatore, Tamil Nadu-641105
ABSTRACT
Emotional Intelligence has been associated with positive outcome process in various professions. In the field of management, Emotional Intelligence has been a popular topic of debate in recent years. Emotional intelligence (EI) is the capacity for understanding one’s own feelings and the feelings of others, for motivating self, and for managing the emotions of self effectively to sustain relationships. Rather than being a single characteristic, emotional intelligence can be thought of as a wide set of competencies that are organized into a few major clusters. The most widely accepted view of emotional intelligence identifies 20 competencies, which are in turn organized into four clusters: Self-Awareness, Self-Management, Social Awareness and Social Skills. Emotional Intelligence plays a role in this matter by managing their emotions and other member’s emotions to keep an appropriate performance and to increase the ability to cope with psychological stresses in implementing job. Working area seek to optimize the performance of their human resources in order to achieve high levels of productivity, efficiency and effectiveness. As a result, it may lead to a higher job performance and Job Satisfaction. The research design of the study reveals that the study is a descriptive type of study in which the unit of analysis is the health care professionals working in various disciplines of hospitals, the measures used are: demographic profile and Emotional Intelligence items. The questionnaires contain the standard tool from the author. Emotional Intelligence tools had various factors involved in them and they also had few items which were to be reverse coded. The research populations were both male and female doctors, the sample size was 448 with which the convenient sampling technique was followed. Both the primary and secondary data collection was used during the period of study and it was during January 2016 to October 2016. The tools used in this study are: Cross tabulation, Chi-Square test, ANOVA, Correlation and Regression analysis.
Key words:
Doctors, Disciplines, Emotional Intelligence, Experience.
Introduction to HRM
motivation, as well as maintenance of human resources. Human Resource Management is responsible for maintaining good human relations in the organization. It is also concerned with development of individuals and achieving integration of goals of the organization and those of the individuals.
Hospital industry in India
Modern society has developed formal institutions for patient care. The hospital, a major social institution, offers considerable advantages to both the patient and the society. A number of health problems require intensive medical treatment and personal care, which is possible only in a hospital where a large number of professionally and technically skilled people apply their knowledge and skill with the help of world class expertise, advanced sophisticated equipment and appliances. The excellence of hospital services depends on how well the human and material resources are utilized for patient care. The first and the foremost function of a hospital is to give proper care to the sick and injured without any social, economic and racial discrimination.
Profession and Emotional Intelligence
Emotional intelligence is increasingly being discussed as having a potential role in medicine, nursing and other health care disciplines, both for personal mental health and professional practice. Doctors and nurses suffer from stress and health problem owing to the characteristics of their work and their contact with patients and death. Emotional intelligence may explain the individual difference in dealing with different professions. There are many studies, which reveal that emotional intelligence is an important factor to handle the problems related to different occupations. Doctors are termed as the human capital of hospitals. So without proper compensation management, they cannot be properly managed and retained. And we all know that hiring cost is much higher than retaining cost. We all know about the famous phrase, "health is wealth". So without a proper health protecting structure (hospitals), we cannot assure about a country's prosperity. And it is necessary that doctors in hospitals are well compensated to achieve their goals effectively and efficiently. Doctors are the corner stone of hospitals or so called in an organization.
Review of Literature
Astudy by Abhishek Shukla and Rajeev Srivastava (2016) shows the purpose to analyze the relationship between five distinct variables: Emotional Intelligence, Demographic Characteristics, Job Stress, Job Satisfaction and Intention to leave the organization. This study presents the results obtained from various literature reviews of scientific articles related to Emotional Intelligence, Demographic Characteristics, Job Stress, Job Satisfaction and Intention to leave variables, published between the years 1950 and 2012. The main findings of various research studies indicated that emotional Intelligence is playing a significant role in controlling job stress , increasing job satisfaction and suppressing the feeling of not to quit from the organization where they were working according to the demographic characteristics.
Dr. Rekha Tomar (2016) in her study sheexamined the effect of types of hospitals and length of service on emotional intelligence among the doctors. Types of hospitals and length of service are independent variables and emotional intelligence is dependent variable in this study. Data were collected by random sample of 150 doctors both private and public hospitals, from different hospitals of Meerut and J.P. Nagar districts. The data were analyzed through Mean and ANOVA. The result indicates that types of hospitals and length of service positively and significantly affect the emotional intelligence. The doctors of private hospitals have better emotional intelligence than the doctors of government hospitals. The length of service of the doctors has also found an influencing factor of emotional intelligence. To sum up it can be said that due to increasing years in the service it makes the senior doctors more compatible and emotionally intelligence than the junior doctors.
Bhaskaran Unnikrishnan1, Darshan bb1, Vaman Kulkarni, et al., (2015) conducted a study and they investigated that a total of 532 participants were assessed for Emotional Intelligence. Around 1.9% had low Emotional Intelligence, 61.8% had moderate Emotional Intelligence and 36.3% had high Emotional Intelligence. Gender, academic performance and satisfaction with the career choice were found to be statistically significant with Emotional Intelligence. They concluded that significant association was found between that of Emotional Intelligence and academic performance and efforts must be made to include the concept of Emotional Intelligence into the medical curriculum.
The study by Anna Burkiewicz (2015) had a primary aim to compare the structure of emotional intelligence among first-year students of selected fields of medicine. 110 first year students of Medical University of Gdansk, including Faculty of Medicine, Physiotherapy and Emergency Medicine completed the Two-Dimensional Inventory of Emotional Intelligence (DINEMO). The observed differences in the structure of the Emotional Intelligence in the group of students proved to be statistically insignificant. Due to considerable implications of Emotional Intelligence related to managing both own (self) emotions and the emotions of patients (others), he suggested that the future study should cover larger group of students.
M.A. Torppa, L. Kuikka, M. Nevalainen and K.H. Pitk ala (2015) their research narrates to study the prevalence of emotional exhaustion among General practitioners and to evaluate how their characteristics and work experiences are associated with emotional exhaustion. Emotional exhaustion among General practitioners was common and associated with longer working history, having committed a medical error, and feelings of isolation at work. General practitioners should receive more support throughout their careers for achieving their heights.
Seyed Reza Seyed Javadein and Mahsa Soltani Neshan (2015) their study contends the relationship between spiritual intelligence and emotional intelligence and their impact on job stress of nurses. The relationship between nurses’ job stress and patient satisfaction then will be measured. The current research studies 310 nurses from private hospitals of Tehran in 2014. The result indicates significant relationship between spiritual intelligence and emotional intelligence. The spiritual intelligence have a greater impact on reducing occupational stress compared to emotional intelligence and the relationship between job stress and patient satisfaction were also significant.
their views such as: further research is required to investigate this concern, so that appropriate intervention can be taken to alleviate the concern.
Yea-Wen Lin and Wei-Pin Chang (2015) researchexplored the relationship between emotional labour and job performance and they examined the mediation effects of emotional exhaustion on the relationship between the emotional labour and job performance of physicians. Data were collected from a sample of 530 physicians in Taiwanese hospitals. They confirmed that surface acting for physicians has a direct impact on job performance and affected job performance through the mediating effect of emotional exhaustion. The influences of surface acting on physicians providing medical services are evident. The results deserved the attention of hospital management to better assist physicians to maintain the correct mindset, take appropriate emotional control and patient communication strategies, rather than simply setting rules that require physicians to suppress displays of emotion.
Research Methodology
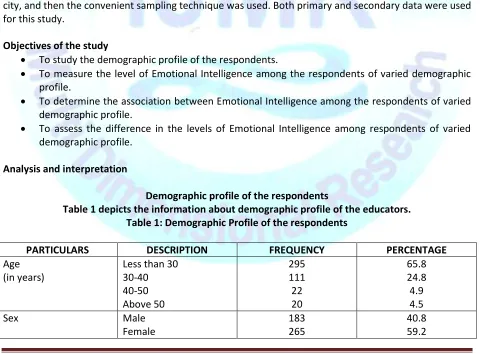
The study is a descriptive type in which the unit of analysis is the health care professionals and then the approach adopted is the quantitative one. The measures used are like: demographic profile and Emotional Intelligence items. The demographic profile includes age, gender, marital status, etc. of the professionals. The study has used the Emotional Intelligence construct tool by Petrides and Furnham which was enhancing in the year 2006 and it has 30 items as in whole. The 30 items were converted into 4 factors and they are such as: Well-being factor, Self-control, Emotionality factor, Sociability factor and then the Global trait. The tool has used the 5 point Likert scaling technique. The reliability of this tool was .6 on Cronbach’s alpha. The respondents were doctors working in various hospitals in Coimbatore city, and then the convenient sampling technique was used. Both primary and secondary data were used for this study.
Objectives of the study
To study the demographic profile of the respondents.
To measure the level of Emotional Intelligence among the respondents of varied demographic profile.
To determine the association between Emotional Intelligence among the respondents of varied demographic profile.
To assess the difference in the levels of Emotional Intelligence among respondents of varied demographic profile.
Analysis and interpretation
Demographic profile of the respondents
Table 1 depicts the information about demographic profile of the educators. Table 1: Demographic Profile of the respondents
PARTICULARS DESCRIPTION FREQUENCY PERCENTAGE
Age (in years)
Less than 30 30-40 40-50 Above 50
295 111 22 20
65.8 24.8 4.9 4.5
Sex Male
Female
183 265
Marital status Single Married
262 186
58.5 41.5 Educational
qualification
BDS MBBS MD MS MDS DM MCH
154 122 88 33 15 12 24
34.4 27.2 19.6 7.4 3.3 2.7 5.4
Designation Professor
Associate professor Assistant professor Senior resident Junior resident
25 19 33 72 299
5.6 4.2 7.4 16.1 66.7 Working experience
(in years)
Less than 5 6-10 11-15 16-20 Above 20
301 100 19
6 22
67.2 22.3 4.2 1.3 4.9 Location of residence Rural
Urban Semi-urban
64 338
46
14.3 75.4 10.3 Annual income
(in lakhs)
2-5 5-8 8-10
More than10
308 92 23 25
68.8 20.5 5.1 5.6
Discipline General physician
Dental ENT Cardiology Pediatric Anesthesia Gynecology General medicine Orthopedics Dermatology
130 169 24 12 24 35 9 26
9 10
29.0 37.7 5.4 2.7 5.4 7.8 2.0 5.8 2.0 2.2
Among 448 respondents 65.8% of respondents are less than 30 years of age, 24.8% of respondents are between 30-40 years of age, 4.9% of respondents are between the age40-50 years of age and remaining 4.5% of the respondents are above 50 years of age.
Among 448 respondents 40.8% of the respondents are male in gender and the remaining 59.2% of the respondents are female in gender.
Among 448 respondents 58.5% of the respondents are not married and the remaining 41.5% of the respondents are married.
have MDS as their qualification, 2.7% of the respondents have DM as their qualification and remaining 5.4% of the respondents have MCH as their qualification as in whole.
Among 448 respondents 5.6% of the respondents are professors in designation, 4.2% of the respondents are associate professors by designation, 7.4% of the respondents are assistant professors by designation, 16.1% of the respondents are senior residents by designation and the remaining 66.7% of the respondents are junior residents by designation.
Among 448 respondents 67.2% of the respondents are are having less than 5 years of working experience, 22.3% of the respondents are having 6-10 years of working experience, 4.2% of the respondents are having 11-15 years of work experience, 1.3% of respondents are having 16-20 years of work experience and then the remaining 4.9% of the respondents are having more than 20 years of the work experience.
Among 448 respondents 14.3% of the respondents are living in the rural areas, 75.4% of the respondents are having the urban locality and the remaining 10.3% of the respondents are having semi-urban as their living locality.
Among 448 respondents 68.8% of the respondents are having 2-5 lakhs of annual income, 20.5% of the respondents are having 5-8 lakhs of the annual income, 5.1% of the respondents are having 8-10 lakhs of annual income and then the 5.6% of the respondents are having more than 10 lakhs of the annual income.
Among 448 respondents 29% of the respondents are having General Physician as their discipline, 37.7% of the respondents are having Dentistry as their discipline, 5.4% of the respondents are having ENT as their discipline, 2.7% of the respondents are having Cardiology as their discipline, 5.4% of the respondents are having Pediatric as their discipline, 7.8% of the respondents are having Anesthesia as their discipline, 2.0% of the respondents are having Gynecology as their discipline, 5.8% of the respondents are having General Medicine as their discipline, 2% of the respondents are having Orthopedics as their discipline and 2.2% of the respondents are having Dermatology as their discipline as in whole.
Levels of Emotional Intelligence
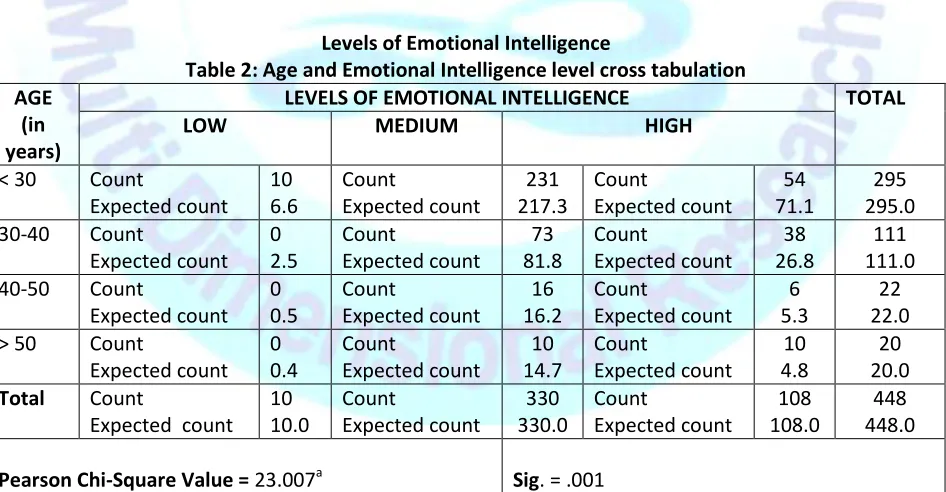
Table 2: Age and Emotional Intelligence level cross tabulation AGE
(in years)
LEVELS OF EMOTIONAL INTELLIGENCE TOTAL
LOW MEDIUM HIGH
< 30 Count
Expected count 10 6.6
Count
Expected count
231 217.3
Count
Expected count
54 71.1
295 295.0 30-40 Count
Expected count 0 2.5
Count
Expected count
73 81.8
Count
Expected count
38 26.8
111 111.0 40-50 Count
Expected count 0 0.5
Count
Expected count
16 16.2
Count
Expected count
6 5.3
22 22.0 > 50 Count
Expected count 0 0.4
Count
Expected count
10 14.7
Count
Expected count
10 4.8
20 20.0
Total Count
Expected count 10 10.0
Count
Expected count
330 330.0
Count
Expected count
108 108.0
448 448.0
Pearson Chi-Square Value = 23.007a Sig. = .001
Intelligence and 54 respondents have the high level of Emotional Intelligence. 111 respondents fall between the age group 30-40 years in which 73 respondents have medium level of Emotional Intelligence and 38 respondents have high level of Emotional Intelligence. 22 respondents fall between the age group 40-50 years in which 16 respondents have the medium level of Emotional Intelligence and 6 respondents have the high level of Emotional Intelligence. 20 respondents come under the age more than 50 years of which 10 respondents have the medium level of Emotional Intelligence and 10 respondents have the high level of Emotional Intelligence.
To test whether there is significant association between the levels of Emotional Intelligence and age of the respondents, chi-square analysis was carried out. The significance value is 0.001 which indicate the significant level to be lesser than 0.05 and it is inferred that there is association between the age of respondents and the levels of Emotional Intelligence.
Table 4.3: Gender and Emotional Intelligence level cross tabulation
GENDER LEVELS OF EMOTIONAL INTELLIGENCE TOTAL
LOW MEDIUM HIGH
Male Count
Expected count 6 4.1
Count
Expected count
116 134.8
Count
Expected count
61 44.1
183 183.0 Female Count
Expected count 4 5.9
Count
Expected count
214 195.2
Count
Expected count
47 63.9
265 265.0
Total Count
Expected count 10 10.0
Count
Expected count
330 330.0
Count
Expected count
108 108.0
448 448.0
Pearson Chi-Square Value = 16.874a Sig. = .000
It is interpreted that out of 448 respondents 183 respondents are male in which 6 respondents have low level of Emotional Intelligence, 116 respondents have medium level of Emotional Intelligence and 61 respondents have high level of Emotional Intelligence. 265 respondents are female and in which4 respondents have low level of Emotional Intelligence, 214 respondents have medium level of Emotional Intelligence and 47 respondents have high level of Emotional Intelligence.
To test whether there is significant association between the levels of Emotional Intelligence and gender of the respondents, chi-square analysis was carried out. The significance value is 0.000 which indicate the significant level to be lesser than 0.05 and it is inferred that there is association between the gender of respondents and the levels of Emotional Intelligence.
Table 4.4: Marital status and Emotional Intelligence level cross tabulation MARITAL
STATUS
LEVELS OF EMOTIONAL INTELLIGENCE TOTAL
LOW MEDIUM HIGH
Single Count
Expected count 10 5.8
Count
Expected count
208 193.0
Count
Expected count
44 63.2
262 262.0 Married Count
Expected count 0 4.2
Count
Expected count
122 137.0
Count
Expected count
64 44.8
186 186.0
Total Count
Expected count 10 10.0
Count
Expected count
330 330.0
Count
Expected count
108 108.0
448 448.0
It is interpreted that out of 448 respondents 262 respondents are single in which 10 respondents have low level of Emotional Intelligence, 208 respondents have medium level of Emotional Intelligence and 44 respondents have high level of Emotional Intelligence. 186 respondents are married and in which 122 respondents have medium level of Emotional Intelligence and 64 respondents have high level of Emotional Intelligence.
To test whether there is significant association between the levels of Emotional Intelligence and marital status of the respondents, chi-square analysis was carried out. The significance value is 0.000 which indicate the significant level to be lesser than 0.05 and it is inferred that there is association between the marital status of respondents and the levels of Emotional Intelligence.
Table 4.5: Educational qualification and Emotional Intelligence level cross tabulation EDUCATION
QUALIFICATION
LEVELS OF EMOTIONAL INTELLIGENCE
TOTAL
LOW MEDIUM HIGH
BDS Count
Expected count 8 3.4 Count Expected count 123 113.4 Count Expected count 23 37.1 154 154.0
MBBS Count
Expected count 2 2.7 Count Expected count 84 89.9 Count Expected count 36 29.4 122 122.0
MD Count
Expected count 0 2.0 Count Expected count 70 64.8 Count Expected count 18 21.2 88 88.0
MS Count
Expected count 0 0.7 Count Expected count 17 24.3 Count Expected count 16 8.0 33 33.0
MDS Count
Expected count 0 0.3 Count Expected count 10 11.0 Count Expected count 5 3.6 15 15.0
DM Count
Expected count 0 0.3 Count Expected count 3 8.8 Count Expected count 9 2.9 12 12.0
MCH Count
Expected count 0 0.5 Count Expected count 23 17.7 Count Expected count 1 5.8 24 24.0
Total Count
Expected count 10 10.0 Count Expected count 330 330.0 Count Expected count 108 108.0 448 448.0
Pearson Chi-Square Value = 52.299a Sig. = .000
in which 10 respondents have medium level of Emotional Intelligence and 5 respondents have high level of Emotional Intelligence. 12 respondents have DM as qualification and in which 3 respondents have medium level of Emotional Intelligence and 9 respondents have high level of Emotional Intelligence. 24 respondents have MCH as qualification and in which 23 respondents have medium level of Emotional Intelligence and 1 respondent have high level of Emotional Intelligence.
To test whether there is significant association between the levels of Emotional Intelligence and educational qualification of the respondents, chi-square analysis was carried out. The significance value is 0.000 which indicate the significant level to be lesser than 0.05 and it is inferred that there is association between the educational qualification of respondents and the levels of Emotional Intelligence.
Table 4.6: Designation and Emotional Intelligence level cross tabulation
DESIGNATION LEVELS OF EMOTIONAL INTELLIGENCE TOTAL
LOW MEDIUM HIGH
Professor Count
Expected count 0 0.6
Count
Expected count 13 18.4
Count
Expected count
12 6.0
25 25.0 Associate
Professor
Count
Expected count 0 0.4
Count
Expected count 14 14.0
Count
Expected count
5 4.6
19 19.0 Assistant
Professor
Count
Expected count 0 0.7
Count
Expected count 21 24.3
Count
Expected count
12 8.0
33 33.0 Senior
Resident
Count
Expected count 5 1.6
Count
Expected count 58 53.0
Count
Expected count
9 17.4
72 72.0 Junior
Resident
Count
Expected count 5 6.7
Count
Expected count
224 220.2
Count
Expected count
70 72.1
299 299.0
Total Count
Expected count 10 10.0
Count
Expected count
330 330.0
Count
Expected count
108 108.0
448 448.0
Pearson Chi-Square Value = 23.971a Sig. = .002
It is interpreted that out of 448 respondents 25 respondents come under professor designation and in which 13 respondents have medium level of Emotional Intelligence and 12 respondents have high level of Emotional Intelligence.19 respondents come under associate professor designation and in which 14 respondents have medium level of Emotional Intelligence and 5 respondents have high level of Emotional Intelligence. 33 respondents come under assistant professor designation and in which 21 respondents have medium level of Emotional Intelligence and 12 respondents have high level of Emotional Intelligence. 72 respondents come under senior resident designation and in which 5 respondents have low level of Emotional Intelligence, 58 respondents have the medium level of Emotional Intelligence and 9 respondents have high level of Emotional Intelligence. 299 respondents come under junior resident designation and in which 5 respondents have low level of Emotional Intelligence, 224 respondents have the medium level of Emotional Intelligence and 70 respondents have high level of Emotional Intelligence.
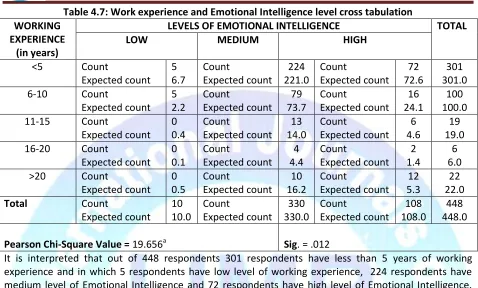
Table 4.7: Work experience and Emotional Intelligence level cross tabulation WORKING
EXPERIENCE (in years)
LEVELS OF EMOTIONAL INTELLIGENCE TOTAL
LOW MEDIUM HIGH
<5 Count
Expected count 5 6.7 Count Expected count 224 221.0 Count Expected count 72 72.6 301 301.0
6-10 Count
Expected count 5 2.2 Count Expected count 79 73.7 Count Expected count 16 24.1 100 100.0
11-15 Count
Expected count 0 0.4 Count Expected count 13 14.0 Count Expected count 6 4.6 19 19.0
16-20 Count
Expected count 0 0.1 Count Expected count 4 4.4 Count Expected count 2 1.4 6 6.0 >20 Count
Expected count 0 0.5 Count Expected count 10 16.2 Count Expected count 12 5.3 22 22.0
Total Count
Expected count 10 10.0 Count Expected count 330 330.0 Count Expected count 108 108.0 448 448.0
Pearson Chi-Square Value = 19.656a Sig. = .012
It is interpreted that out of 448 respondents 301 respondents have less than 5 years of working experience and in which 5 respondents have low level of working experience, 224 respondents have medium level of Emotional Intelligence and 72 respondents have high level of Emotional Intelligence. 100 respondents fall between 6-10 years of working experience and in which 5 respondents have low level of Emotional Intelligence, 79 respondents have medium level of Emotional Intelligence and 16 respondents have high level of Emotional Intelligence. 19 respondents fall between 11-15 years of teaching experience and in which 13 respondents have medium level of Emotional Intelligence and 6 respondents have high level of Emotional Intelligence. 6 respondents come between 16-20 years of working experience and in which 4 respondents have medium level of Emotional Intelligence and 2 respondents have high level of Emotional Intelligence. 22 respondents come under more than 20 years of working experience and in which 10 respondents have medium level of Emotional Intelligence and 12 respondents have high level of Emotional Intelligence.
To test whether there is significant association between the levels of Emotional Intelligence and working experience of the respondents, chi-square analysis was carried out. The significance value is 0.012 which indicate the significant level to be lesser than 0.05 and it is inferred that there is association between the working experience of respondents and the levels of Emotional Intelligence.
Table 4.8: Location and Emotional Intelligence level cross tabulation
LOCATION LEVELS OF EMOTIONAL INTELLIGENCE TOTAL
LOW MEDIUM HIGH
Rural Count
Expected count 4 1.4 Count Expected count 54 47.1 Count Expected count 6 15.4 64 64.0
Urban Count
Expected count 6 7.5 Count Expected count 240 249.0 Count Expected count 92 81.5 338 338.0 Semi urban Count
Expected count 0 1.0 Count Expected count 36 33.9 Count Expected count 10 11.1 46 46.0
Total Count
Expected count 10 10.0 Count Expected count 330 330.0 Count Expected count 108 108.0 448 448.0
It is inferred that out of 448 respondents 64 respondents are from rural locality and in which 4 respondents are having low level of Emotional Intelligence, 54 respondents are having medium level of Emotional Intelligence and 6 respondents are having high level of Emotional Intelligence. 338 respondents are from the urban locality and in which 6 respondents are having low level of Emotional Intelligence, 240 respondents are having medium level of Emotional Intelligence and 92 respondents are having high level of Emotional Intelligence. 46 respondents are from semi urban locality and in which 36 respondents are having medium level of Emotional Intelligence and 10 respondents are having high level of Emotional Intelligence.
To test whether there is significant association between the levels of Emotional Intelligence and locality of the respondents, chi-square analysis was carried out. The significance value is 0.005 which indicate the significant level to be lesser than 0.05 and it is inferred that there is association between the locality of respondents and the levels of Emotional Intelligence.
Table 4.9: Annual income and Emotional Intelligence level cross tabulation ANNUAL
INCOME
LEVELS OF EMOTIONAL INTELLIGENCE TOTAL
LOW MEDIUM HIGH
2-5 lakhs Count
Expected count 6 6.9
Count
Expected count
231 226.9
Count
Expected count 71 74.3
308 308.0 5-8 lakhs Count
Expected count 4 2.1
Count
Expected count
71 67.8
Count
Expected count 17 22.2
92 92.0 8-10 lakhs Count
Expected count 0 0.5
Count
Expected count
15 16.9
Count
Expected count 8 5.5
23 23.0 >10 lakhs Count
Expected count 0 0.6
Count
Expected count
13 18.4
Count
Expected count 12 6.0
25 25.0
Total Count
Expected count 10 10.0
Count
Expected count
330 330.0
Count
Expected count
108 108.0
448 448.0
Pearson Chi-Square Value = 13.431a Sig. = .037
It is inferred that out of 448 respondents 308 respondents have their annual income between 2-5 lakhs and in which 6 respondents have low level of Emotional Intelligence, 231 respondents have medium level of Emotional Intelligence and 71 respondents have high level of Emotional Intelligence. 92 respondents have their annual income between 5-8 lakhs and in which 4 respondents have low level of Emotional Intelligence, 71 respondents have medium level of Emotional Intelligence and 17 respondents have high level of Emotional Intelligence. 23 respondents have their annual income between 8-10 lakhs and in which 15 respondents have medium level of Emotional Intelligence and 8 respondents have high level of Emotional Intelligence. 25 respondents have their annual income more than 10 lakhs and in which 13 respondents have medium level of Emotional Intelligence and 12 respondents have high level of Emotional Intelligence.
ANOVA
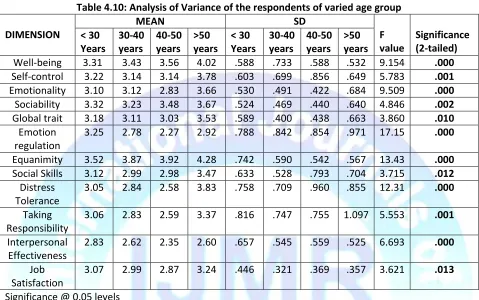
Table 4.10: Analysis of Variance of the respondents of varied age group
DIMENSION
MEAN SD
F value
Significance (2-tailed) < 30
Years
30-40 years
40-50 years
>50 years
< 30 Years
30-40 years
40-50 years
>50 years
Well-being 3.31 3.43 3.56 4.02 .588 .733 .588 .532 9.154 .000
Self-control 3.22 3.14 3.14 3.78 .603 .699 .856 .649 5.783 .001
Emotionality 3.10 3.12 2.83 3.66 .530 .491 .422 .684 9.509 .000
Sociability 3.32 3.23 3.48 3.67 .524 .469 .440 .640 4.846 .002
Global trait 3.18 3.11 3.03 3.53 .589 .400 .438 .663 3.860 .010
Emotion regulation
3.25 2.78 2.27 2.92 .788 .842 .854 .971 17.15 .000
Equanimity 3.52 3.87 3.92 4.28 .742 .590 .542 .567 13.43 .000
Social Skills 3.12 2.99 2.98 3.47 .633 .528 .793 .704 3.715 .012
Distress Tolerance
3.05 2.84 2.58 3.83 .758 .709 .960 .855 12.31 .000
Taking Responsibility
3.06 2.83 2.59 3.37 .816 .747 .755 1.097 5.553 .001
Interpersonal Effectiveness
2.83 2.62 2.35 2.60 .657 .545 .559 .525 6.693 .000
Job Satisfaction
3.07 2.99 2.87 3.24 .446 .321 .369 .357 3.621 .013
Significance @ 0.05 levels
Inference: There is significant difference in well-being factor (F=9.154, P<.05), self-control factor (F=5.793, P<.05), emotionality factor (F=9.509, P<.05), sociability factor (F=4.846, P<.05), global trait factor (F=3.860, P<.05), emotion regulation factor (F=17.154, P<.05), equanimity factor (F=13.432, P<.05), social skills factor (F=3.715, P<.05), distress tolerance factor (F=12.311, P<.05), taking responsibility factor (F=5.553, P<.05), interpersonal effectiveness factor (F=6.693, P<.05) and the job satisfaction factor (F=3.621, P<.05) among the respondents of different age.
Table 4.11: Analysis of Variance of the respondents of varied gender
DIMENSION Mean SD F value Significance
(2-tailed)
Male Female Male Female
Well-being 3.46 3.33 .640 .638 5.101 .024
Self-control 3.28 3.18 .641 .661 2.262 .133
Emotionality 3.17 3.09 .557 .524 2.529 .112
Sociability 3.36 3.29 .494 .535 2.227 .136
Global trait 3.18 3.17 .559 .545 .077 .781
Emotion regulation
2.94 3.17 .862 .842 7.762 .006
Equanimity 3.77 3.59 .754 .688 7.138 .008
Social Skills 3.19 3.03 .658 .596 7.656 .006
Distress Tolerance
3.01 3.02 .901 .705 .021 .886
Taking Responsibility
Interpersonal Effectiveness
2.73 2.76 .627 .639 .129 .719
Job Satisfaction
3.06 3.04 .394 .428 .223 .637
Significance @ 0.05 levels
Inference: There is significant difference in well-being factor (F=5.101, P<.05), emotion regulation factor (F=7.762, P<.05), equanimity factor (F=7.138, P<.05), social skills factor (F=7.656, P<.05) and taking responsibility factor (F=6.796, P<.05) among the respondents of varied gender. There is no significant difference in self-control factor (F=2.262, P>.05), emotionality factor (F=2.529, P>.05), sociability factor (F=2.227, P>.05), global trait factor (F=.077, P>.05), distress tolerance factor (F=.021, P>.05), interpersonal effectiveness factor (F=.129, P>.05) and the job satisfaction factor (F=.223, P>.05) among the respondents of different gender .
Table 4.12: Analysis of Variance of the respondents of varied marital status
DIMENSION Mean SD F value Significance
(2-tailed) Single Married Single Married
Well-being 3.30 3.49 .616 .663 9.431 .002
Self-control 3.20 3.26 .604 .719 1.069 .302
Emotionality 3.11 3.13 .534 .546 .131 .717
Sociability 3.30 3.35 .520 .519 .886 .347
Global trait 3.13 3.23 .588 .487 3.915 .048
Emotion regulation
3.26 2.18 .761 .914 32.692 .000
Equanimity 3.47 3.93 .742 .593 49.941 .000
Social Skills 3.11 3.08 .640 .609 .217 .641
Distress Tolerance
2.98 3.05 .726 .873 .892 .345
Taking Responsibility
3.05 2.91 .832 .805 3.137 .077
Interpersonal Effectiveness
2.81 2.66 .633 .626 6.143 .014
Job Satisfaction
3.05 3.04 .453 .354 .138 .710
Significance @ 0.05 levels
Table 4.13: Analysis of Variance of the respondents of varied annual income
DIMENSION
MEAN SD
F value
Significance (2-tailed) 2-5
lakhs 5-8 lakhs
8-10 lakhs
>10 lakhs
2-5 lakhs
5-8 lakhs
8-10 lakhs
>10 lakhs
Well-being 3.39 3.24 3.23 3.97 .530 .843 .843 .520 9.495 .000
Self-control 3.24 3.11 2.86 3.73 .550 .801 .959 .612 8.774 .000
Emotionality 3.07 3.24 2.93 3.45 .497 .583 .391 .759 6.683 .000
Sociability 3.29 3.34 3.23 3.67 .487 .595 .417 .586 4.582 .004
Global trait 3.13 3.29 3.02 3.43 .498 .673 .470 .623 4.491 .004
Emotion regulation
3.11 3.18 2.48 2.75 .794 .947 .858 1.01 5.733 .001
Equanimity 3.66 3.45 4.03 4.09 .702 .769 .454 .645 8.109 .000
Social Skills 3.11 3.00 3.01 3.31 .623 .582 .582 .816 1.810 .144 Distress
Tolerance
3.01 2.96 2.52 3.72 .740 .769 1.02 .809 10.37 .000
Taking Responsibility
2.98 3.11 2.25 3.25 .812 .765 .751 1.05 4.031 .008
Interpersonal Effectiveness
2.78 2.78 2.43 2.53 .599 .748 .382 .687 3.184 .024
Job Satisfaction
3.038 3.112 2.797 3.208 .344 .598 .359 .333 4.973 .002
Significance @ 0.05 levels
Inference: There is significant difference in well-being factor (F=9.495, P<.05), self-control factor (F=8.774, P<.05), emotionality factor (F=6.683, P<.05), sociability factor (F=4.582, P<.05), global trait factor (F=4.491, P<.05), emotion regulation factor (F=5.733, P<.05), equanimity factor (F=8.109, P<.05), distress tolerance factor (F=10.379, P<.05), taking responsibility factor (F=4.031, P<.05), interpersonal effectiveness factor (F=3.184, P<.05) and the job satisfaction factor (F=4.973, P<.05) among the respondents of different annual income.There is no significant difference in social skills factor (F=1.810, P>.05) among the respondents of different annual income.
Table 4.14: Analysis of Variance of the respondents of varied locality
DIMENSION Mean SD F value Significance
(2-tailed) Rural Urban
Semi-urban
Rural Urban Semi-
urban
Well-being 3.36 3.37 3.50 .428 .685 .553 .864 .422
Self-control 3.39 3.19 3.26 .528 .699 .378 2.745 .065
Emotionality 3.13 3.13 3.03 .439 .563 .480 .666 .514
Sociability 3.18 3.35 3.29 .472 .526 .512 2.738 .066
Global trait 3.25 3.17 3.12 .510 .557 .557 .872 .419
Emotion regulation
3.25 3.06 2.90 .852 .870 .733 2.309 .101
Equanimity 3.44 3.70 3.71 .729 .729 .595 3.539 .030
Social Skills 3.05 3.11 3.07 .572 .643 .579 .285 .752
Distress Tolerance
2.92 3.01 3.19 .715 .807 .749 1.627 .198
Responsibility Interpersonal Effectiveness
2.82 2.75 2.59 .531 .672 .421 1.822 .163
Job Satisfaction 3.04 3.05 3.03 .505 .401 .378 .066 .936
Significance @ 0.05 levels
Inference: There is significant difference in equanimity factor (F=3.539, P<.05) among the respondents of different locality. There is no significant difference in well-being factor (F=.864, P>.05), self-control factor (F=2.745, P>.05), emotionality factor (F=.666, P>.05), sociability factor (F=2.738, P>.05), global trait factor (F=.872, P>.05), emotion regulation factor (F=2.309, P>.05), social skills factor (F=.285, P>.05), distress tolerance factor (F=1.627, P<.05), taking responsibility factor (F=.614, P<.05), interpersonal effectiveness factor (F=1.822, P<.05) and the job satisfaction factor (F=.66, P<.05) among the respondents of different locality.
Conclusion
Emotional intelligence is the life blood of every organization, and is a vital element in human relationships and success at work and in life. Understanding the feelings and emotions, being able to manage them effectively and in turn understanding other’s emotions and responding to their concerns is what emotional intelligence is all about. Emotional intelligence can be beneficial in many areas of life; it calls for the acquisition of certain emotional skills. The Emotional intelligence is assumed to be important in many field of life, achievement in studies, performance at work, and physical and mental health. However, the application of its usefulness has been most frequently documented in the professional workplace.
References
1. Abhishek Shukla and Rajeev Srivastava (2016), examine the relationship between emotional intelligence with demographic profile, job stress, job satisfaction and turnover intention, I J A B E R , Vol. 14, No. 6, (2016): 4887-4900.
2. Dr. Rekha Tomar, 2016, a study on emotional intelligence among nurses, international journal of scientific research and education , Volume 4 Issue 4 April 2016
3. Dr. Agnes Mathew and Dr. Mathew, T. V. 2016. Emotional intelligence of medical students and need for training: International Journal of Development Research Vol. 6, Issue, 03, pp. 7168-7171, March, 2016.
4. Anna Burkiewicz (2015), Structure of emotional intelligence among first year students of selected directions of medicine, Procedia - Social and Behavioral Sciences 190 (2015) 129 – 134. 5. Bhaskaran Unnikrishnan1, Darshan bb1, Vaman Kulkarni, et al., association of emotional
intelligence with academic performance among medical students in south India. Asian J Pharm Clin Res, Vol 8, Issue 2, 2015, 300-302.
6. M.A. Torppa, L. Kuikka, M. Nevalainen & K.H. pitk ala (2015), emotionally exhausting factors in general practitioner’s work, Scandinavian Journal of Primary Health Care, 2015; 33: 178–183. 7. Seyed Reza Seyed Javadein , Mahsa Soltani Neshan , Mohsen Moradi-Moghaddam (2015),
investigating the effects of spiritual and emotional intelligence on nurse job stress and its impact on patient satisfaction,Global Journal of Management Studies and Researches, 2(1) 2015, Pages: 1-8
9. Yea-Wen Lin and Wei-Pin Chang, Physician Emotional Labour and Job Performance: The Mediating Effects of Emotional Exhaustion, journal of health management, 17(4) 446–457, 2015 Indian Institute of Health Management Research, SAGE Publications.
WEB SITES
1. https://en.wikipedia.org/wiki/Emotional_intelligence
2. https://www.psychologytoday.com/basics/emotional-intelligence 3. www.danielgoleman.info/topics/emotional-intelligence/
4. https://www.mindtools.com › Career Skills
5. www.ihhp.com/meaning-of-emotional-intelligence
6. https://www.helpguide.org/articles/emotional-health/emotional-intelligence-eq.htm