Gene expression profiling in acute
leukemias: New insights into biology
and a global approach to the
diagnosis of leukemia using
microarray technology
Dissertation
an der Fakultät für Biologie
der Ludwig-Maximilians-Universität
München
vorgelegt von
Alexander Kohlmann
aus Neumarkt i.d. OPf.
Diese Arbeit wurde im Labor für spezielle Leukämie-Diagnostik im Klinikum der Ludwig-Maximilians-Universität München – Großhadern unter Anleitung von Herrn Professor Dr. Dr. T. Haferlach durchgeführt.
Erstgutachter: Professor Dr. Thomas Cremer Zweitgutachter: Professor Dr. Heinrich Leonhardt Sondervotum: Professor Dr. Dr. Torsten Haferlach
Contents
Contents...IV List of figures...VI List of tables...VII Abbreviations ...VIII
1. Summary... 1
2. Introduction ... 3
2.1 Microarrays and the era of functional genomics... 3
2.2 Leukemia ... 7
2.3 Gene expression profiling in the field of hematology... 12
2.4 Questions addressed in this work ... 14
3. Methods and Protocols ... 15
3.1 Description of patient samples ... 15
3.2 Diagnostic procedures ... 15
3.3 Microarray target preparation... 18
3.3.1 Isolation of total RNA ... 19
3.3.2 Synthesis of ds cDNA ... 21
3.3.3 Cleanup of ds cDNA ... 23
3.3.4 Synthesis of biotin-labeled cRNA ... 25
3.3.5 Cleanup of biotin-labeled cRNA... 26
3.3.6 Fragmenting the cRNA ... 28
3.3.7 Target hybridization ... 29
3.3.8 Microarrays ... 31
3.3.9 Microarray washing and staining ... 33
3.3.10 Microarray scanning and image analysis... 35
3.3.11 Quality assessment... 36
3.3.12 Data sets and scaling procedure ... 38
3.4 Microarray data analysis ... 39
3.4.2 Estimation of prediction performance ... 43
3.4.3 Hierarchical clustering... 44
3.4.4 Principal component analysis ... 45
3.4.5 Classification of samples based on gene expression patterns... 46
3.4.6 Functional gene annotation... 48
3.4.7 Network analysis... 49
3.4.8 Software ... 50
4. Results ... 51
4.1 Gene expression profiling in AML ... 51
4.2 Gene expression profiling in ALL ... 67
4.3 Gene expression profiling in t(11q23)/MLL leukemias ... 73
5. Discussion... 107
5.1 Specific patterns in AML with reciprocal rearrangements ... 107
5.2 Molecular characterization of ALL using microarrays... 113
5.3 Novel insights into the biology of t(11q23)/MLL leukemias ... 116
5.4 Microarray technology as a potential diagnostic platform... 121
5.5 Concluding remarks ... 129
6. References... 131
7. Appendix... 146
7.1 Chemicals, enzymes, and reagents ... 146
7.2 Instrumentation and technical equipment... 148
7.3 Buffers and solutions... 149
Publications... 153
Patent applications... 155
Danksagung... 157
List of figures
Figure 1. Different types of microarray platforms...4
Figure 2. Fluorescence image of a microarray (Affymetrix U133A) ...6
Figure 3. Affymetrix chip design ...6
Figure 4. Interlaboratory tests in cytomorphology...11
Figure 5. Gene expression analysis overview ...18
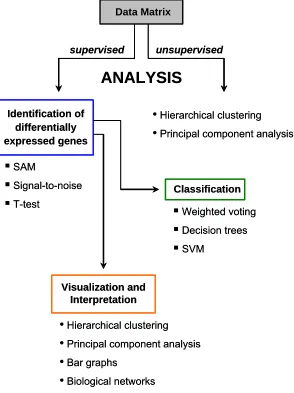
Figure 6. Overview about the data analysis workflow...39
Figure 7. Hierarchical cluster analysis workflow ...44
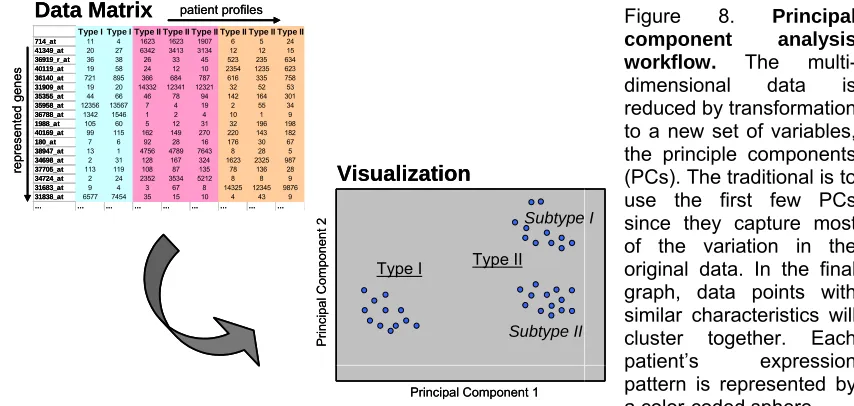
Figure 8. Principal component analysis workflow ...45
Figure 9. Multiple-tree model computation ...46
Figure 10. Concept of SVM-based classification ...47
Figure 11. Classification task...47
Figure 12. Network details on node shapes, edge labels, and types...49
Figure 13. Unsupervised hierarchical clustering of AML with t(15;17), t(8;21), and inv(16)...51
Figure 14. Unsupervised PCA of AML with t(15;17), t(8;21), and inv(16) ...52
Figure 15. Supervised analysis of AML with t(15;17), t(8;21), and inv(16) ...53
Figure 16. PCA of three AML subtypes based on 13 genes ...54
Figure 17. Multiple-tree classifier for AML with t(15;17), t(8;21), and inv(16)...55
Figure 18. Hierarchical clustering using 36 genes from both classifiers ...57
Figure 19. Transition from U95Av2 arrays to the U133 array design...58
Figure 20. Morphology of APL samples...59
Figure 21. Class discovery: APL vs. other AML subclasses ...60
Figure 22. Network visualizing differences when comparing APL to other AML subclasses ...61
Figure 23. PCA based on genes from the GO category blood coagulation ...62
Figure 24. Supervised analysis to discriminate APL subtypes...63
Figure 25. Differences in expression of genes with function in granulation or maturation in APL...66
Figure 26. Analysis of adult ALL samples using U95Av2 microarrays...67
Figure 27. Analysis of adult ALL samples using U133A microarrays...68
Figure 28. PCA including heterogeneous precursor B-ALL cases...69
Figure 29. Hierarchical clustering including heterogeneous precursor B-ALL cases ...70
Figure 30. Zoomed image of subtree 5 out of Figure 29...71
Figure 31. Heterogeneous precursor B-ALL in the context of pediatric markers ...72
Figure 32. PCA including various acute leukemia subtypes ...73
Figure 33. Hierarchical clustering of 363 ALL and AML samples ...74
Figure 34. Network distinguishing t(11q23)/MLL leukemias from other acute leukemia subtypes...75
Figure 35. Unsupervised PCA of adult ALL and AML with t(11q23)/MLL ...76
Figure 36. Unsupervised hierarchical clustering of adult ALL and AML with t(11q23)/MLL ...76
Figure 37. Differentially expressed genes between ALL and AML with t(11q23)/MLL...78
Figure 38. Supervised identification of differentially expressed genes in t(11q23)/MLL leukemias ...79
Figure 39. Unsupervised analysis of t(11q23)/MLL samples with various partner genes ...80
Figure 40. Pattern robustness in AML with recurrent chromosomal aberrations ...83
Figure 41. Analysis of varying sample handling and operator parameters ...85
Figure 42. Concordance between cytochemistry and gene expression...87
Figure 43. Protein expression and mRNA abundance in a subset of diagnostic antigens...89
Figure 44. Pediatric markers according to Yeoh et al. can classify adult patients ...95
Figure 45. Pediatric markers according to Armstrong et al. can classify adult patients ...96
Figure 46. Overlapping t(11q23)/MLL markers from two pediatric cohorts classify adult patients ...97
Figure 47. Overall survival in cytogenetically defined AML subgroups ...99
Figure 48. Hierarchical cluster analysis of 937 samples representing 13 classes ...103
Figure 49. Three-dimensional PCA visualizing distinctions of leukemia subtypes...104
Figure 50. Identification of c-ALL/Pre-B-ALL samples with or without t(9;22)...105
Figure 51. Distinction between immature and cortical T-ALL samples ...106
List of tables
Table 1. Minimal set of 13 genes sufficient for accurate class prediction ...54
Table 2. Identified genes for the classification of AML with t(15;17), t(8;21), and inv(16)...56
Table 3. Morphological and genetic differences in the APL cohort...64
Table 4. Linear regression analyses for top 20 discriminative genes (M3 vs. M3v)...65
Table 5. MLL partner gene confusion matrix determined by 10-fold CV...81
Table 6. MLL partner gene confusion matrix determined by resampling ...81
Table 7. Classification accuracies for various parameters...83
Table 8. Patients for comparison of flow cytometry and microarray analyses ...88
Table 9. Comparisons of protein expression and mRNA abundance in acute leukemia ...90
Table 10. Comparisons of protein expression and mRNA abundance in AML...91
Table 11. Comparisons of protein expression and mRNA abundance in precursor B-ALL ...92
Table 12. Comparisons of protein expression and mRNA abundance in precursor T-ALL ...93
Table 13. Classification of three adult ALL subtypes based on pediatric markers...94
Table 14. Prediction of t(11q23)/MLL aberrations in adult ALL using pediatric markers...96
Table 15. Prediction of MLL aberrations using overlapping t(11q23)/MLL-specific genes...97
Table 16. Number of samples and patient characteristics...98
Table 17. Confusion matrix for prediction of 13 groups as determined by 10-fold CV...100
Table 18. Confusion matrix for prediction of 13 groups as determined by resampling ...101
Table 19. Sensitivities and specificities for leukemia classification in 13 subgroups ...102
Abbreviations
µ micro µm micrometer
ALL acute lymphoblastic leukemia
AML acute myeloid leukemia
APL acute promyelocytic leukemia
ATP adenosine triphosphate
ATRA all-trans retinoic acid
bp base pair
BSA bovine serum albumin
cDNA complementary DNA
CLL chronic lymphatic leukemia
CML chronic myeloid leukemia
CV cross-validation
DEPC diethyl pyrocarbonate
DNA deoxyribonucleic acid
dNTP deoxynucleotide triphosphate
ds double-stranded dT deoxythymidine DTT dithiothreitol
E. coli Escherichia coli
EDTA ethylenediaminetetraacetic acid
EGIL European Group on Immunological Classification of Leukemia
FAB French-American-British
FDR false discovery rate
FISH fluorescence in situ hybridization
FITC fluorescein-isothiocyanate
FLT3-LM FLT3 gene length mutation
g gram
g acceleration (9.80665 m/s²)
G giga
G-band Giemsa dark chromosome band
GO gene ontology
h hour
Ig immunoglobulin
IVT in vitro transcription
k kilo l liter
LOOCV leave-one-out cross-validation
M molar
MES 2-morpholinoethanesulfonic acid
min minute ml milliliter mM millimolar
MRD minimal residual disease
mRNA messenger RNA
nm nanometer
OH hydroxyl group
PBS phosphate buffered saline
PCA principal component analysis
PCR polymerase chain reaction
PE phycoerythrin
RNA ribonucleic acid
RNase ribonuclease
rpm rotations per minute
RPMI cell culture medium (Roswell Park Memorial Institute)
RT-PCR reverse transcriptase-polymerase chain reaction
s second
SAM significance analysis of microarrays
SAPE streptavidin, R-phycoerythrin conjugate
SSPE sodium chloride-sodium phosphate-EDTA buffer
SVM support vector machine
Tris Tris(hydroxymethyl)aminomethane
Tween-20 polyoxyethylenesorbitan monolaurate
U unit
w/v percentage weight per volume
WBC white blood cell
1. Summary
The application of global gene expression profiling allows to obtain detailed molecular fingerprints of underlying gene expression in any cell of interest. In this work gene expression profiles were generated from a comprehensive cohort of leukemia patients and healthy donors referred to and diagnosed in the Laboratory for Leukemia Diagnostics, Munich, Germany, which is a nation-wide reference center for the diagnosis of hematologic malignancies. Thoroughly characterized clinical samples were analyzed by high-density microarrays interrogating the expression status of more than 33,000 transcripts.
In one specific aspect of this work the potential application of gene expression signatures for the prediction and classification of specific leukemia subtypes was assessed. Today the diagnosis and subclassification of leukemias is based on a controlled application of various techniques including cytomorphology, cytogenetics, fluorescence in situ hybridization, multiparameter flow cytometry, and PCR-based methods. The diagnostic procedure is performed according to a specific algorithm, but is time-consuming, cost-intensive, and requires expert knowledge. Based on a very low number of candidate genes it is demonstrated in this work that prognostically relevant acute leukemia subtypes can be classified using microarray technology. Moreover, in an expanded analysis including 937 patient samples representing 12 distinct clinically relevant acute and chronic leukemia subtypes and healthy, non-leukemia bone marrow specimens a diagnostic prediction accuracy of ~95% was achieved. Thus, given these results it can be postulated that the occurring patterns in gene expression would be so robust that they would allow to predict the leukemia subtype using global gene expression profiling technology. This finding is further substantiated through the demonstration that reported differentially expressed genes from the literature, namely pediatric gene expression signatures representing various acute lymphoblastic leukemia (ALL) subtypes, can be used to independently predict the corresponding adult ALL subtypes. Furthermore, it could be demonstrated that microarrays both confirm and reproduce data from standard diagnostic procedures, but also provide very robust results. Parameters such as partial RNA degradation, shipment time of the samples, varying periods of storage of the samples, or target preparations at different time points from either bone marrow or peripheral blood specimens by different operators did not dramatically influence the diagnostic gene expression signatures.
In another major aspect of this work gene expression signatures were examined in detail to obtain new insights into the underlying biology of acute promyelocytic leukemia (APL) and t(11q23)/MLL leukemias. In APL,
respect to 11q23 leukemias it could be demonstrated that leukemias with rearrangements of the MLL gene are characterized by a common specific gene
expression signature. Additionally, in unsupervised and supervised data analysis algorithms ALL and AML cases with t(11q23)/MLL segregated
according to the lineage, i.e., myeloid or lymphoid, respectively. This segregation could be explained by a highly differing transcriptional program. Through the use of biological network analyses essential regulators of early B cell development, PAX5 and EBF, were shown to be associated with a clear
B-lineage commitment in lymphoblastic t(11q23)/MLL leukemias. Also, the
influence of the different MLL translocation partners on the transcriptional
program was directly assessed. But interestingly, gene expression profiles did not reveal a clear distinct pattern associated with one of the analyzed partner genes. Taken together, the identified molecular expression pattern of MLL
fusion gene samples and biological networks revealed new insights into the aberrant transcriptional program in t(11q23)/MLL leukemias. In addition, a
series of analyses was targeted to obtain new insights into the underlying biology in heterogeneous B-lineage leukemias not positive for BCR/ABL or MLL
gene rearrangements. It could be demonstrated that the genetically more heterogeneous precursor B-ALL samples intercalate with BCR/ABL-positive
cases, but their profiles were clearly distinct from T-ALL and t(11q23)/MLL
cases.
2. Introduction
2.1 Microarrays and the era of functional genomics
Both biology and medicine are undergoing a revolution that is based on the accelerating determination of DNA sequences, including the completion of whole genomes of a growing number of organisms (Wheeler et al., 2004). In parallel to the sequencing efforts, a wide range of technologies with tremendous potential has grown that can take advantage of the vast quantity of genetic information that is now available. The field of functional genomics seeks to devise and apply these technologies, such as microarrays, to analyze the full complement of genes and proteins encoded by an organism in order to understand the functions of genes and proteins (Fields et al., 1999).
Microarrays for gene expression monitoring
The interval between the first draft assembly (Lander et al., 2001; Venter et al., 2001) and the closure of the human genome announced in April 2003 has seen big increases in human mRNA coverage, expressed sequence tags (EST) production, and continual refinement of automated genome annotation. The available data today are converging to a basal number of well below 30,000 protein-coding genes, which could even be as low as 25,000 (Southan, 2004). However, still with the sequence information alone it will not be possible to fully understand gene function, expression and regulation. Cellular processes are governed by the repertoire of expressed genes, and the levels and timing of their expression. Microarrays are a suitable tool to measure the expression of a large number of mRNAs in parallel (Young, 2000).
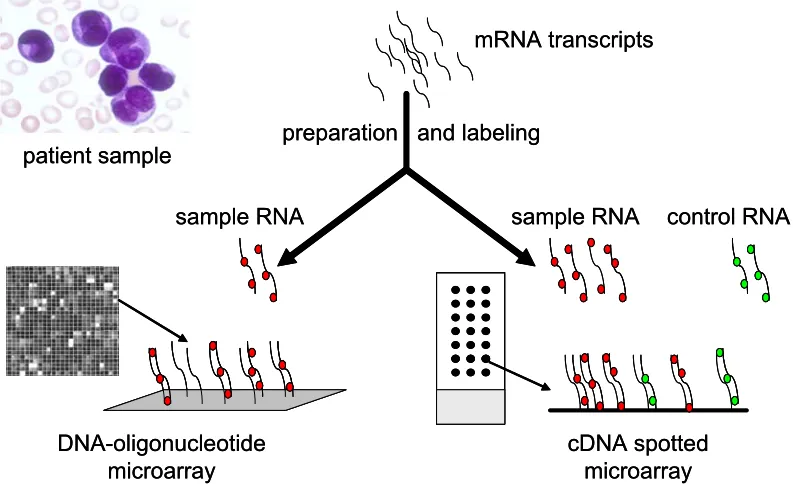
The basic concept behind microarrays is the precise positioning of DNA-probes that are designed to specifically monitor the mRNA abundance of genes of interest in a highly parallel manner on a solid support so that they can act as molecular detectors (Holloway et al., 2002). This determination of the relative concentration of mRNAs is based on hybridization of entire mRNA populations to high-density arrays of oligonucleotides and results in the generation of specific gene expression signatures, i.e., groups of genes with similar patterns of expression across a set of samples (Staudt, 2003). Common to all gene expression profiling approaches is the heteroduplex formation: Structural features of nucleic acids enable every nucleic acid strand to recognize complementary sequences through base pairing (Southern et al., 1999). After the process of hybridization, complementary and fluorescently tagged nucleotides can be detected. As such, microarrays allow the reproducible and quantitative monitoring of the expression levels of very large numbers of genes and provide a molecular fingerprint of the transcriptome (Lockhart and Winzeler, 2000).
microscopic glass slides on which cDNAs or long oligonucleotides (typically 60-mers) have been deposited (spotted) (Duggan et al., 1999). The second is based on photolithographic techniques to synthesize 25-mer oligonucleotides on a silicon wafer and constitutes the patented technology of Affymetrix, Inc. (Lockhart et al., 1996). These differences can impact experimental design and interpretation, but it is becoming clear that robust and reproducible gene expression data can be generated on multiple platforms (Wright et al., 2003). During the past few years powerful algorithms have been developed and adapted to mine microarray data. More recently, also applications to interpret gene expression signatures in terms of pathways and networks have evolved (Slonim, 2002).
patient sample
mRNA transcripts
DNA-oligonucleotide microarray
sample RNA
cDNA spotted microarray preparation and labeling
sample RNA control RNA
patient sample
mRNA transcripts
DNA-oligonucleotide microarray
sample RNA
cDNA spotted microarray preparation and labeling
sample RNA control RNA
Figure 1. Different types of microarray platforms. Microarray platforms vary according to: (A) the solid support used (such as glass slides or silicon wafers), (B) the surface modifications with various substrates, (C) the type and length of DNA fragments on the array (such as cDNA or oligonucleotides), (D) whether the gene fragments are presynthesized and deposited or synthesized in situ, (E) the machinery used to place the fragments on the array (such as ink-jet printing, spotting, mask or micromirror-based in situ synthesis), and (F) the method of sample preparation. Currently, combinations of these variables are used to generate two main types of microarrays: in situ synthesized DNA-oligonucleotide arrays (left), and spotted glass slide arrays (right).
Glass slide microarrays
are based on the reverse transcription of mRNA, either from highly purified poly(A) mRNA, or total RNA extracts and often include amplification steps (Van Gelder et al., 1990). In most protocols, one sample is labeled with the Cy3 (green) fluorochrome, the other with Cy5 (red). The labeled cRNA molecules hybridize to the corresponding cDNA or long oligonucleotides, of which the exact position on the array is known. The binding of the target to the probe is detected by scanning the array, typically using either a scanning confocal laser, or a charge coupled device (CCD) camera-based reader. After scanning, software calculations provide the ratios between green and red fluorescence for each spot, corresponding to the relative abundance of mRNA from a particular gene in the target sample vs. the reference sample (Duggan et al., 1999).
However, the technical difficulties in the reproducible production of glass slide microarrays should not be underestimated (Holloway et al., 2002). Much of this variation is introduced systematically during the spotting of the DNA onto the slide surface (Rickman et al., 2003) and many of the initial cDNA clone sets were compromised by contamination with T1 phage, by multiple clones in individual wells, and by incorrect sequence assignment (Halgren et al., 2001). Thus, given the lack of a gold standard for the production of glass slide microarrays using current technologies, there is a high degree of variation in the quality of data derived from glass slide microarray experiments. This poor reproducibility not only adds to the cost of a given study, but also leads to data sets that are difficult to interpret (Holloway et al., 2002).
DNA-oligonucleotide microarrays
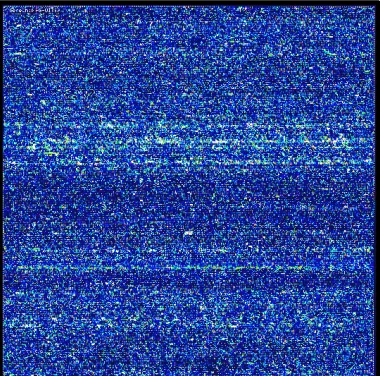
Microarrays manufactured by Affymetrix, Inc., also known as the so-called GeneChips, use only one color and generate a gene expression profile of one sample in each analysis (Figure 2). The results obtained from these absolute expression analyses are conductive to building large databases.
Figure 2. Fluorescence image of a microarray (Affymetrix U133A). The microarray contains more than 500,000 different 25-mer oligonucleotide probes in an area of 1.28 x 1.28 cm. The represented probe sets interrogate more than 22,000 human transcripts. The image of the global expression profile was obtained after overnight hybridization of an amplified and labeled human mRNA. After the washing and staining procedures, the microarray was scanned with a laser. The amount of light emitted at 570 nm is proportional to the bound target at each location on the probe array.
The mRNA abundance of a gene of interest is interrogated by a combination of a pair of 25-mer probes that span specific parts of the gene, mostly located at the 3´ end (Figure 3). A first group of 25-mer oligonucleotides are called perfect match oligonucleotides (PM). In addition to these perfect match oligonucleotides, each 25-mer comes with a negative control oligonucleotide that contains a mismatch at central position (MM). This single base mismatch is sufficient to destabilize the hybridization. The MM probes are effective internal controls. They will hybridize to non-specific sequences as effectively as their counterpart PM probes. As a result, unpredictable background signal variations associated with samples from different sources as well as from cross-hybridization can be quantified and subtracted (Hubbell et al., 2002). This probe strategy addresses the issue to discern between specific and non-specific binding and offers the balance of high sensitivity and specificity in the presence of a complex background (Liu et al., 2002). The integration of the expression intensities for each of the PM-MM sets generates a value for the expression of a particular gene (Hubbell et al., 2002). Various types for probe level analyses exist. Both simple statistics as well as more sophisticated model-based approaches have successfully been applied to extract signals from the raw data (Schadt et al., 2000; Li and Wong, 2001; Irizarry et al., 2003).
Figure 3. Affymetrix chip design. (A) Typical U133 chip design probe sets contain 11 probe pairs designed to detect a specific target sequence. Probe pairs comprise two probe cells, designed as perfect match (PM) and its corresponding mismatch control (MM). (B) Intensity bar graphs for the calculated signals for each probe cell. Using statistical algorithms a signal intensity and detection call for each probe set is provided.
MM PM
probe set probe pair
probe cell
target sequence
5’ 3’
A
B
Signal: 780.6
Call: P(present)
x x x x x x x x x x x x MM PM
probe set probe pair
probe cell
target sequence
5’ 3’
A
B
Signal: 780.6
Call: P(present)
Comparable to the glass slide microarrays, mRNA from a given sample is reverse transcribed into cDNA, which is subsequently used as a template in an in vitro transcription reaction which incorporates biotinylated ribonucleotides into the cRNA. The cRNA, referred to as the target, is hybridized to the 25-mer oligonucleotides on the GeneChip and is subsequently stained with streptavidin-phycoerythrin (SAPE). Thus, the major difference between the two types of DNA microarrays lies in the method to assess the transcript levels: quantitation via pairwise comparisons (ratios) for glass slides, or quantitations in arbitrary (but well-defined) expression units in the case of Affymetrix microarrays (Lockhart and Winzeler, 2000). Besides its high technical reproducibility, the in situ synthesized oligonucleotide technology offers several advantages over glass slide technology. It is well suited for comparisons of multiple samples because no ratios are used, making it a suitable platform for large series of clinical samples without the need of pairwise analyses. In addition, for most applications glass slides require more input RNA than Affymetrix microarrays, which can be problematic, particularly for clinical research with patient samples.
2.2 Leukemia
Malignant diseases that arise in cells of the hematopoietic system are as varied as the individual lineages that comprise this tissue, and can be broadly categorized into leukemias, myelodysplastic and myeloproliferative syndromes, Hodgkin’s disease, and the non-Hodgkin's lymphomas (Downing and Shannon, 2002). Leukemias are generally classified into four different groups or types: acute myeloid (AML), acute lymphoblastic (ALL), chronic myeloid (CML) and chronic lymphatic leukemia (CLL). Acute leukemias are a heterogeneous group of malignant diseases of hematopoietic progenitor cells with different molecular genetic abnormalities, clinical characteristics, and variable outcomes with currently available treatments. As a result of recent advances in understanding of both normal hematopoietic development and the molecular pathology of hematopoietic malignancies, significant improvements have occurred in the ability to accurately diagnose, subclassify, and treat these cancers (Gilliland and Tallman, 2002). Especially cloning of recurring chromosomal translocation breakpoints has provided valuable insights into disease mechanisms, as well as identification of therapeutic targets (Rowley et al., 1977; Rowley, 1990; Rowley, 2001). These genetic alterations contribute to the leukemic transformation of hematopoietic stem cells or their committed progenitors by changing cellular functions (Gilliland, 1998; Ferrando and Look, 2000). They alter key regulatory processes by maintaining or enhancing an unlimited capacity for self-renewal, subverting the controls of normal proliferation, blocking differentiation, and promoting resistance to death signals (Pui et al., 2004).
Diagnosis and classification
Initially, the diagnosis of acute leukemias requires the preparation and interpretation of peripheral blood smears, accompanied by bone marrow cytology (Löffler et al., 2004; Theml et al., 2004). The morphologic evaluation is based on the FAB classification, which was proposed by the French-American-British co-operative group in 1976 (Bennett et al., 1976). The FAB classification is based on cytomorphology and cytochemistry to separate leukemia subgroups (e.g., M0 – M7 in AML) according to the morphological appearance of blasts. In certain instances, leukemia subtypes can be diagnosed by cytomorphology alone, but this typically requires that an expert reviews the smears. Often, cytomorphology is combined with cytochemistry and multiparameter flow cytometry in order to ascertain the correct entity (Bennett et al., 1985). The latter is particularly important in the subclassification of patients with ALL and to separate very undifferentiated AML from ALL (Bene et al., 1995; Campana and Behm, 2000). Using these techniques in combination, leukemias can be stratified in a first approach into CML, CLL, ALL, and AML. Within the latter three disease entities, several prognostically relevant subtypes have been identified (Lowenberg et al., 1999; Dohner et al., 2000; Pui et al., 2004). This further subclassification is based mainly on genetic abnormalities of the leukemic cells. Especially in AML, cytogenetic aberrations are the most important independent prognostic factors regarding response to therapy, as well as survival (Grimwade et al., 1998).
As a consequence, the new World Health Organization (WHO) classification of hematological malignancies, established in 2001, incorporated cytogenetics, molecular genetics, as well as morphologic and immunophenotypic findings not previously described (Jaffe et al., 2001). The diagnosis of AML is now established when at least 20% of the cells identified in the blood or bone marrow are a clonal expansion of blasts of myeloid origin (Smith et al., 2004). With respect to the classification of AML, the current WHO proposal encompasses four major categories in order to define biologically homogeneous entities which have clinical relevance. The first category is described as AML with recurring genetic abnormalities, including the following subcategories: i) AML with t(8;21)(q22;q22); fusion transcript AML1/ETO, ii)
AML with abnormal bone marrow eosinophils inv(16)(p13q22) or t(16;16)(p13;q22); fusion transcript CBFB/MYH11, iii) AML with
t(15;17)(q22;q12); fusion transcript PML/RARA and variants, so-called acute
promyelocytic leukemia (APL) and iv) AML with t(11q23)/MLL abnormalities;
various fusion transcripts. The other three categories are described as AML with multilineage dysplasia, therapy-related AML, and AML not otherwise categorized, respectively.
encoding active kinases and altered transcription factors (BCR/ABL, TEL/AML1, E2A/PBX1, and MLL gene fusions), and hyperdiploidy involving more than 50
chromosomes (Pui et al., 2004).
Given the various types of leukemia-specific fusion genes, RT-PCR is the method of choice in detecting the aberrant transcripts. RT-PCR not only confirms the diagnosis, but is also used for therapy stratification. Moreover, minimal residual disease (MRD) monitoring using sensitive RT-PCR-based amplification and real time quantification of specific fusion gene transcripts has led to the development of a new powerful prognostic score predicting relapse (Schnittger et al., 2003). Recently, new techniques have begun to enter the field of diagnosis and classification of leukemias (Mathew and Raimondi, 2003): Fluorescence in situ hybridization (FISH) allows for rapid testing for specific chromosomal translocations in both metaphase and interphase cells. Spectral karyotyping (SKY) and multiplex-FISH (M-FISH) both are using 24 different fluorescently labeled chromosome painting probes to generate an automated color display of all chromosomes, enhancing accuracy and sensitivity of cytogenetic analysis, especially with complex karyotypes in myeloid leukemias (Schrock et al., 1996; Speicher et al., 1996). Comparative genomic hybridization (CGH) provides a sensitive method for identification of regions of genomic deletion or amplification and may identify new disease genes at these loci (Gilliland and Tallman, 2002). However, a drawback of many of the methods that are used today is the requirement of viable cells. For example, the cells used for genetic analyses need to divide in vitro in order to obtain metaphases. Another problem is the long lag period (>72 hours) that typically occurs between the receipt of the specimens to be analyzed in the laboratory and the generation of results. Also, a great experience in preparing chromosomes and analyzing karyotypes is needed to obtain correct results.
Therapeutic consequences
This complex workflow for subclassification of leukemias is not only necessary to correctly diagnose and stratify leukemia samples, but also results in major clinically relevant treatment decisions (Grimwade et al., 2001; Haferlach et al., 2004). The importance of this highly specific disease classification may be illustrated for AML as a very heterogeneous group of malignancies. Patients with AML whose leukemic cells have translocations t(15;17), t(8;21), or inv(16) have a favorable outcome with induction chemotherapy and intensive postremission consolidation chemotherapy (Schoch et al., 2003; Smith et al., 2004). In contrast, patients with abnormalities of chromosomes 5, 7, 11q23 or complex karyotypes have a very poor outcome with currently available induction and postremission chemotherapy (Schoch et al., 2003). Patients with a normal karyotype or with trisomy 8 have an intermediate prognosis (Schoch et al., 1997).
The prime example for this strong link between a comprehensive diagnostic algorithm and a consequential disease-specific treatment approach has been the use of all-trans retinoic acid (ATRA) in patients with acute promyelocytic leukemia (APL). APL represents one subtype with specific morphology and with a characteristic cytogenetic aberration, namely the translocation t(15;17)(q22;q12), which fuses the PML gene to the retinoic acid
classification, APL can be separated into two distinct subtypes based solely on morphology (Bennett et al., 1976; Bennett et al., 1980a; Bennett et al., 1980b): AML M3 and AML M3 variant (M3v). The latter is also called microgranular APL in the new WHO classification (Jaffe et al., 2001). Both the correct diagnosis and the efficacy of the specific anti-leukemia treatment are based on the presence of the translocation t(15;17) and of the corresponding PML/RARA
fusion gene (Warrell, Jr. et al., 1991; Warrell, Jr. et al., 1993; Tallman et al., 1997). The introduction of all-trans retinoic acid (ATRA) has improved the outcome in this subgroup of patient from about 50% to 85% long-term survivors (Lengfelder et al., 2000; Degos and Wang, 2001). In both APL subtypes the fusion protein PML/RARA induces an arrest on different stages of granulocytic differentiation. In the presence of high concentrations of all-trans retinoic acid the differentiation stop is overcome leading to maturation of the abnormal promyelocytic blasts to polymorphonuclear cells and finally inducing apoptosis (Tallman, 2004a).
Although it did not yet result in the development of a targeted drug therapy the assured diagnosis of AML with a complex aberrant karyotype is highly relevant for the management of the patient. Depending on the age of the patient, this very dismal diagnosis is the basis for the decision to apply allogeneic stem cell transplantation very early or to even withhold any anti-leukemic therapy (Grimwade et al., 1998; Lowenberg et al., 1999; Schoch et al., 2001; Grimwade et al., 2001).
Similarly, the recent introduction of the therapeutic drug Imatinib (Glivec) into the therapeutic management of patients with CML has revolutionized the treatment strategies in this disease and may change therapeutic concepts also for BCR/ABL-positive ALL in the near future (Druker et al., 2001; Kantarjian et
al., 2002; Goldman and Melo, 2003; Hughes et al., 2003; O'Brien et al., 2003; Pui et al., 2004). Repeatedly, the basis for both the correct diagnosis and the specifically targeted therapy is the presence of a specific genetic alteration, translocation t(9;22). In patients treated with this new drug, the therapy response is dramatically higher as compared to all other drugs that had been previously used. In addition, quantification of the BCR/ABL fusion gene
transcripts at diagnosis and during treatment is increasingly used to sensitively assess response to therapy (Scheuring et al., 2003).
Reproducibility of methods for the diagnosis of leukemias
0 10 20 30 40 50 60 70
1 2 3 4 5 6 7 8 9 10 11 12 13 Percentage of blasts
AML M2 bone marrow smear
0 10 20 30 40 50 60 70
1 2 3 4 5 6 7 8 9 10 11 12 13 Percentage of blasts
AML M2 bone marrow smear
Figure 4. Interlaboratory tests in cytomorphology. In the German network “Akute und chronische Leukämien“ 13 experts evaluated the percentage of blasts on given video prints (left). As represented by bar graphs for each individual reviewing hematologist, the percentage of designated leukemic blast cells differ significantly between the experts (right). More information can be found online (http://leukaemie.krebsinfo.de/).
Also in flow cytometry variations between results from different laboratories are observed. As demonstrated for the assessment of CD34+ stem cells absolute counts, the European Working Group on Clinical Cell Analysis has attempted to standardize the flow cytometry protocol across 24 clinical sites. However, despite a reduction of the interlaboratory variation from 23.3% in trial 1 to 10.8% in trial 3, after the use of a common standardized protocol and targeted training, still large variations CD34+ cell count enumeration exist (Barnett et al., 2000). In another study including 35 laboratories performing CD4 or CD8 counts, it was shown that laboratories which do not use standardized gating strategies (CD45+ leukocytes) are more likely to return an unacceptable result. After laboratories had switched from a non-CD45 gating technique to the use of CD45 gating, their results significantly improved (Gelman and Wilkening, 2000).
With respect to cytogenetics, one has to consider that the percentages of evaluable cases in clinical studies are varying drastically. Often, up to 20% of all entered cases can not be evaluated and large discrepancies can be observed in the detection of cases with a normal karyotype (Grimwade et al., 1998; Slovak et al., 2000; Grimwade et al., 2001). Mainly, karyotypes are not available becausecytogenetic analyses were either not performed, failed, were yielding no analyzable mitoses, or were deemed inadequate because the quality of banded chromosomeswas poor (Byrd et al., 2002). However, the performance of cytogenetic analyses in a centralized laboratory accounted for reference protocols, such as the Laboratory for Leukemia Diagnostics, Munich, Germany, can help in increasing the percentage of evaluable cases up to 98.2% (Schoch et al., 2003).
For the detection of the BCR/ABL fusion gene, detailed interlaboratory
tests have been performed. A first series of analyses addressed the quality and sensitivity of RT-PCR reactions in 27 different laboratories from Germany, mainly departments of hematology of university hospitals (Burmeister et al., 2000). The three most prevalent BCR/ABL transcripts were cloned from patient
and false positive (n=11) results were observed. Also, in 11 cases wrong transcripts were detected. In summary, 14.8% of the participants had false negative results, 29.6% had false positive results, 18.5% had detected wrong transcripts (Burmeister et al., 2000). In a second series of analyses a defined amount of BCR/ABL-positive cells from cell lines were diluted in leukocytes from
healthy donors and samples with four defined cell counts as well as negative controls were shipped to the participants on dry ice. Again, a large number of false negative results (14.2%) and false positive results (6.3%) were obtained. The discrepancies in these interlaboratory tests can be explained by contaminations of the PCR reaction mix, the use of inappropriate primers, or lack of efficiency in RNA isolation protocols (Burmeister et al., 2000). In Spain, an interlaboratory program was performed to compare the results in detecting the PML/RARA fusion gene transcript in patients with APL (Bolufer et al., 1998).
Here, cDNA samples obtained by reverse transcription of RNA from bone marrow samples from patients with APL were sent to 12 participating laboratories. Only in 83% of the analyses concordance between laboratories was obtained. The discrepancies in 17% of the analyses were attributable to low sensitivity or inadequacy of the procedures that were used (Bolufer et al., 1998). Thus, despite the widespread use of RT-PCR in molecular laboratories most methods are not yet standardized. The implementation of an external quality assessment scheme with regular participation would ensure the accuracy of results. Taken together, given the properties of the oligonucleotide microarray technology like the high reproducibility and quality of the manufacturing process, the existing standardization of laboratory protocols, and the objectiveness of the results, it may very well be applicable for usage in clinical diagnostic procedures.
2.3 Gene expression profiling in the field of hematology
Global gene expression analyses have become an important part of biomedical basic and clinical-orientated research. The joint collaboration of biologists, physicians, and statisticians has created a fertile intellectual environment for the development of genomic approaches to questions of biological and clinical relevance. Over the past years especially hematologic malignancies have been an attractive field for a genomic approach to a heterogeneous disease (Ebert and Golub, 2004).
29 cases. These analyses represented the first and major step towards a molecular classification of acute leukemias.
Many studies followed the pivotal work of Golub and colleagues. These analyses provided not only a “class prediction“, i.e., the prediction of a tumor entity based on specific gene expression patterns, but demonstrated also the feasibility of “class discovery“, i.e., the discovery of new subentities within groups formerly regarded as homogeneous entities. This discovery often is not limited to the pure identification of new biological tumor entities, but also includes the definition of prognostically different groups which is anticipated to influence future therapeutic strategies.
Consequently, gene expression signatures were evaluated for the correlation with cytogenetics. Virtaneva and colleagues had compared the expression status of 6,606 genes of AML blasts with normal cytogenetics and trisomy 8 as the sole abnormality (Virtaneva et al., 2001). In their study normal CD34+ cells clustered into a distinct group, whereas AML with trisomy 8 and AML with normal karyotype intercalated with each other. The microarray analyses further showed an overall increased expression of genes located on chromosome 8, suggesting a gene-dosage effect. In pediatric ALL, samples with MLL gene translocations were demonstrated to be distinct from other
precursor B-ALL cases or AML (Armstrong et al., 2002).
The feasibility of class discovery has been impressively demonstrated for diffuse large B cell lymphoma (DLBCL). Based on distinct gene expression signatures Alizadeh and colleagues had subdivided an entity previously considered homogeneous by various pathological methods into two, not only new, but also prognostically highly relevant subgroups (Alizadeh et al., 2000). The distinctive gene expression signatures were further postulated to be able to formulate a molecular predictor of survival after chemotherapy for DLBCL (Rosenwald et al., 2002).
In a cohort of 360 pediatric ALL patients the ground-breaking study from the St. Jude Children’s Research Hospital, Memphis, TN, USA identified each of the prognostically important ALL subtypes, including precursor T-ALL, t(1;19)(q23;p13.3) (E2A/PBX1), t(12;21)(p13;q22) (TEL/AML1), rearrangements
in the MLL gene on chromosome 11, band q23, t(9;22)(q34;q11) (BCR/ABL),
2.4 Questions addressed in this work
In the present work gene expression profiles were generated from a comprehensive cohort of leukemia patients and healthy donors referred to and diagnosed in the Laboratory for Leukemia Diagnostics, Munich, Germany. Thoroughly characterized clinical samples were analyzed by high-density microarrays interrogating the expression status of more than 33,000 transcripts. The application of global gene expression profiling allows to obtain molecular fingerprints of underlying gene expression in distinct leukemia types and gives new insights into the biology of this heterogeneous disease. Moreover, this technology possibly leads to the identification of novel diagnostic markers.
Gene expression profiling in AML
Initial experiments were related to distinct prognostical and therapeutical relevant AML subtypes with the specific genetic alterations t(15;17), t(8;21), and inv(16). Further analyses were performed to elucidating the underlying biology in the two APL subtypes FAB M3 and its variant FAB M3v.
Gene expression profiling in ALL
In ALL, a cohort of patients was analyzed to further obtain new insights into four distinct subtypes frequently occurring in adults, namely t(9;22), t(8;14), t(11q23)/MLL, and T-ALL. Furthermore, as a previous study reported difficulties
in separating precursor B-ALL with t(9;22) from precursor B-ALL without t(9;22), a series of detailed analyses addressed the discovery of similarities or differences in these precursor B-ALL subtypes.
Gene expression profiling in t(11q23)/MLL leukemias
Four types of analyses may help in obtaining new insights into the underlying biology of acute leukemias with MLL gene rearrangements: (1) Identification of
t(11q23)/MLL leukemia signatures compared to numerous specific subtypes of
other acute leukemias, (2) discrimination of t(11q23)/MLL-positive AML from
t(11q23)/MLL-positive ALL, (3) investigation of signatures correlated with MLL/AF9 and other MLL partner genes, and (4) deciphering common biological
networks. It is of specific interest to address the question how the differing MLL
partner genes influence the gene expression signatures and whether pathways could be identified to explain the molecular determination of MLL leukemias.
Gene expression profiling as a potential diagnostic platform
3. Methods and Protocols
3.1 Description of patient samples
All leukemia patient samples included in this study were referred to the Laboratory for Leukemia Diagnostics, Munich, Germany, between December 1998 and February 2004. As a nation-wide reference center for the diagnosis of hematologic malignancies, the laboratory received patient samples from all over Germany, either from local hospitals or via express mail. At the time point of diagnosis the patients provided bone marrow aspirates or peripheral blood samples. In addition, bone marrow aspirates provided from healthy control subjects were included. Prior to therapy, all patients gave their informed consent for participation in the current evaluation after having been advised about the purpose and investigational nature of the study as well as of potential risks. The studies were conducted according to the rules of the local internal review board and the tenets of the revised Helsinki protocol. All samples underwent a standardized diagnostic processing (Haferlach and Schoch, 2002). All relevant clinical parameters, as well as detailed diagnostic reports, were entered in a specific leukemia database (Dugas et al., 2001). During the process of diagnosis mononuclear cells from the biopsy were purified by Ficoll-Hypaque density centrifugation. Aliquots of 5 x 10⁶ cells were subsequently lysed using a guanidine isothiocyanate buffer (Qiagen, Hilden, Germany). The stabilized lysates were stored at -80°C until preparation for microarray analyses.
3.2 Diagnostic
procedures
Following a strict algorithm (Haferlach and Schoch, 2002), the routine diagnostic procedure was performed using an individual combination of cytomorphology, cytogenetics, fluorescence in situ hybridization (FISH), immunophenotyping and molecular genetics:
Cytomorphology
The routine diagnostic cytomorphology procedure included May-Grünwald-Giemsa (MGG) staining, myeloperoxidase reaction, and non-specific esterase reaction using alpha-naphthyl-acetate. The staining was routinely performed according to standard procedures (Löffler et al., 2004). The cytomorphologic diagnosis followed the criteria of the FAB classification and the new World Health Organization classification (Bennett et al., 1976; Bennett et al., 1985; Jaffe et al., 2001).
Cytogenetics
preparation. The other two cultures were cultivated for 24 h without colcemid and then another 24 h after the addition of colcemid (R24 HMF 24, R24+CC HMF 24) followed by standard slide preparation (Schoch et al., 2002b). Metaphases were analyzed for G-bands using a modified GAG-banding technique as described elsewhere (Fonatsch et al., 1980). A median of twenty metaphases were analyzed. The procedure was judged as not evaluable if less than 10 metaphases without clonal karyotype abnormalities were available for analysis. The chromosomes were interpreted according to the International System for Human Cytogenetic Nomenclature (ISCN) (Mitelman, 1995).
Fluorescence in situ hybridization (FISH)
FISH was performed on interphase nuclei and/or metaphases depending on the diagnostic algorithm. For interphase-FISH bone marrow and/or peripheral blood smears were processed. Metaphase-FISH was carried out on slides prepared for chromosome analysis. For interphase-FISH at least 100 interphase nuclei were evaluated (Schoch et al., 2002b). For metaphase-FISH an area of 18 x 18 mm was hybridized. FISH was performed using commercially available loci-specific probes (Vysis, Downers Grove, IL, USA) and whole chromosome painting probes (MetaSystems, Altlussheim, Germany). The signals were viewed with a Zeiss Axioskop microscope (Zeiss, Jena, Germany). The results were documented using the ISIS analyzing software (MetaSystems).
Multiparameter-immunophenotyping
Flow cytometry analyses were performed on cells isolated from bone marrow by Ficoll-Hypaque density gradient centrifugation as described (Kern et al., 2003b; Kern et al., 2004). Triple stainings, isotype controls, and monoclonal antibodies against 39 antigens were used in the following combinations as designed for diagnostic purposes and monitoring of MRD.
Antibody combinations for diagnostic antigens (triple stainings)
CD34/CD2/CD33 CD7/CD33/CD34 CD34/CD56/CD33 CD11b/CD117/CD34 CD64/CD4/CD45 CD15/CD13/CD33 HLA-DR/CD33/CD34 CD65/CD87/CD34 CD34/CD135/CD33 CD34/CD116/CD33 CD34/NG2/CD33 CD38/CD133/CD34 CD90/CD117/CD34 CD61/CD14/CD41 CD36/CD235a/CD45 CD9/CD33/CD34 CD97/CD33/CD34 CD34/CD10/CD19 CD5/CD19/CD20 CD2/CD1a/CD3 CD3/CD4/CD8 MPO/LF/cyCD15 † TdT/cyCD22/cyCD3 † TdT/cyCD79a/cyCD3 †
† cy: cytoplasmic antigen
All antibodies conjugated with the fluorochromes fluorescein isothiocyanate (FITC), phycoerythrin (PE), and phycoerythrin cyanine 5 (PC-5), respectively, were purchased from Immunotech (Marseilles, France), except for CD64 and CD15 (Medarex, Annandale, NJ, USA), CD133 (Milteny Biotech, Bergisch Gladbach, Germany), and MPO and LF (Caltag, Burlingame, CA, USA). The respective combinations of antibodies were added to 1 x 10⁶ cells (volume, 100
Dickinson, San Jose, CA, USA). List-mode data files were analyzed using the CellQuest Pro software, Version (Becton Dickinson).
In order to acquire data on the same cells for both flow cytometry and microarray analysis, i.e., all nucleated cells of each sample, the analysis gate was set in a forward-scatter/side-scatter plot and included lymphocyte, blast, monocyte, and granulocyte populations. Antigen expression was rated positive at a cut-off level of 20% of the cells within the mononuclear gate for membrane proteins and at a cut-off level of 10% for cytoplasmic antigens, as compared to isotype controls (in patients with analysis of isotype controls). Mean fluorescence intensity values were calculated for all events with fluorescence values higher than isotype controls. In 117 samples, a total of 39 genes/antigens were analyzed in parallel. The congruence of positivity and negativity of the expression of the respective genes as determined by flow cytometry and microarray analysis was analyzed for each gene in each individual patient. Comparisons of microarray hybridization signals with flow cytometry intensities were performed by Mann-Whitney U-test. Analyses for bivariate correlations of mRNA and protein expression levels were performed by Pearson’s correlation using SPSS, Version 10.0.7 (Chicago, IL, USA).
Reverse transcriptase-polymerase chain reaction (RT-PCR)
In the years 1998 – 2000 total RNA was extracted from 1 x 10⁷ mononuclear cells, purified by Ficoll-Hypaque density gradient centrifugation, using the RNeasy Mini kit protocol (Qiagen, Hilden, Germany). Since January 2001, mRNA was extracted from 5 x 10⁶ mononuclear cells with the MagnaPureLC mRNA kit I (Roche Applied Science, Mannheim, Germany). The cDNA synthesis of 1-2 µg total RNA or mRNA from an equivalent of 5 x 10⁵ cells was performed in a 50 µl reaction using 300 U Superscript II enzyme (Invitrogen, Karlsruhe, Germany) and random hexamer oligonucleotide primers (Pharmacia, Freiburg, Germany). In all cases with balanced translocations the corresponding fusion transcript was verified as described, i.e., PML/RARA for t(15;17), AML1/ETO for t(8;21), CBFB/MYH11 for inv(16)/t(16;16) (Schnittger et al.,
2003). MLL fusion transcripts were amplified and further verified by sequencing
as previously described (Schoch et al., 2003). Detection of specific BCR/ABL fusion genes was performed as described (Maurer et al., 1991). For each sample a cABL-specific RT-PCR was performed to control the integrity of RNA (Schoch et al., 2002a). Strict precautions were taken to prevent contamination. Water instead of cDNA was included as a blank sample in each experiment. Amplification products were analyzed on 1.5% agarose gels stained with ethidium bromide according to standard protocols (Sambrook et al., 1989).
Quantification of fusion gene transcripts by quantitative RT-PCR
Each quantitative RT-PCR was carried out in a 20 µl reaction volume with 0.5 µM of forward and reverse primer, 0.25 µM Hyb-Probes, 4 mM MgCl2, and 2 µl
3.3 Microarray target preparation
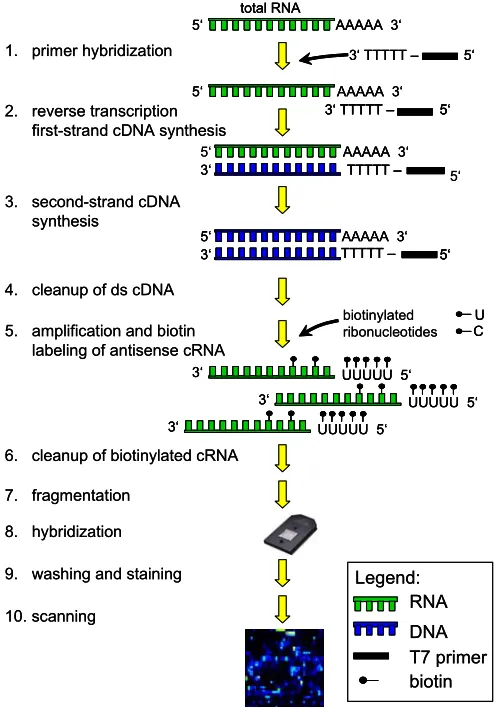
Between June 2001 and February 2004 gene expression analyses using microarrays were successfully performed in patients with newly diagnosed leukemia and normal bone marrow. Figure 5 outlines the major steps of the procedure for gene expression profiling analyses as performed in this work.
Figure 5. Gene expression analysis overview. The gene expression profiling analysis starts with the sample target preparation. The target is the labeled nucleic acid that is being interrogated. It is hybridized to the probes on the array. For the respective samples, double-stranded (ds) cDNA is synthesized from total RNA isolated from mononuclear cells. An in vitro transcription (IVT) reaction is then done to produce biotin-labeled cRNA from the cDNA. After fragmentation a hybridization cocktail is prepared, including the fragmented target, probe array controls, bovine serum albumin, and herring sperm DNA. The cocktail is hybridized to the probe array during a 16-hour incubation. Immediately following hybridization, the probe array undergoes an automated washing and staining protocol on the fluidics station. After scanning the array the raw data is analyzed for probe signal intensities and all results are reported in tabular and graphical formats. Then the data set is prepared for detailed statistical analyses.
Notes:
• Throughout all steps powder-free gloves were worn. All steps to minimize the introduction of exogenous nucleases were taken. Water used in the protocols is molecular biology-grade. Proper storage and handling of all reagents was done according to the manufacturer’s recommendations. All steps were performed in nuclease-free 1.5 ml reaction tubes.
• The whole sample target preparation procedure was performed in two working days taking the assay’s safe stopping points into account. Day 1 included isolation of total RNA, synthesis of ds cDNA, cleanup of ds cDNA, and ethanol precipitation over night. The IVT reaction, cRNA cleanup, quantification, and fragmentation were performed on the second day. After a hybridization cocktail had been prepared, it was either subsequently hybridized to a probe array, or stored at -20°C for later use.
3‘ TTTTT – 5‘
1. primer hybridization
AAAAA 3‘ total RNA
5‘
2. reverse transcription first-strand cDNA synthesis
AAAAA 3‘ 5‘
AAAAA 3‘ 5‘
AAAAA 3‘ 5‘
3‘ TTTTT – 5‘
3‘ TTTTT – 5‘
3‘ TTTTT – 5‘
3. second-strand cDNA synthesis
4. cleanup of ds cDNA
5. amplification and biotin labeling of antisense cRNA
U C biotinylated ribonucleotides
UUUUU 5‘ 3‘
UUUUU 5‘ 3‘
UUUUU 5‘ 3‘
6. cleanup of biotinylated cRNA
7. fragmentation
8. hybridization
9. washing and staining
10. scanning RNA
DNA T7 primer biotin Legend:
3‘ TTTTT – 5‘ 3‘ TTTTT – 5‘
1. primer hybridization
AAAAA 3‘ total RNA
5‘ AAAAA 3‘
total RNA 5‘
2. reverse transcription first-strand cDNA synthesis
AAAAA 3‘ AAAAA 3‘ 5‘
AAAAA 3‘
5‘ AAAAA 3‘
5‘
AAAAA 3‘ 5‘
3‘ TTTTT – 5‘ AAAAA 3‘ 5‘
3‘ TTTTT – 5‘ 3‘ TTTTT – 5‘
3‘ TTTTT –
3‘ TTTTT –TTTTT – 5‘
3‘ TTTTT – 5‘
3‘ TTTTT –TTTTT – 5‘5‘
3. second-strand cDNA synthesis
4. cleanup of ds cDNA
5. amplification and biotin labeling of antisense cRNA
U U C C biotinylated ribonucleotides
UUUUU 5‘
3‘ UUUUU 5‘
3‘
UUUUU 5‘
3‘ UUUUU 5‘
3‘
UUUUU 5‘
3‘ UUUUU 5‘
3‘
6. cleanup of biotinylated cRNA
7. fragmentation
8. hybridization
9. washing and staining
10. scanning RNA
3.3.1 Isolation of total RNA
Isolation of total RNA from frozen lysates of mononuclear cells was performed according to the RNeasy Mini Kit protocol (Qiagen, Hilden, Germany) including an initial homogenization step. In this protocol, a specialized high-salt buffer system allows up to 100 µg of RNA longer than 200 bases to bind to the RNeasy silica-gel membrane. The biological samples were first lysed and homogenized in the presence of a highly denaturing guanidine isothiocyanate (GITC)-containing buffer, which immediately inactivates RNases to ensure isolation of intact RNA. Then ethanol was added to provide appropriate binding conditions and the sample was applied to a RNeasy mini column where the total RNA binds to the membrane and contaminants are efficiently washed away. The RNA is subsequently eluted in 40 µl of nuclease-free water. Normally, eight individual samples were processed in parallel. All steps of the protocol were quickly performed at room temperature. All centrifugation steps were performed in a standard microcentrifuge (Eppendorf, Hamburg, Germany). Wash buffer RPE is supplied as a concentrate. Before using it for the first time, four volumes of absolute ethanol (Roth, Karlsruhe, Germany) were added to obtain a working solution. A 70% ethanol solution was prepared in 2.0 ml caps using absolute ethanol and nuclease-free water.
Equipment and solutions:
• RNeasy Mini Kit (Qiagen)
• QIAshredder columns (Qiagen)
• Nuclease-free water (Ambion)
• Ethanol (Roth)
• Heat block, 45°C
Method:
1. Thaw frozen cell lysates of individual patient samples (stored at -80°C) on ice. Then incubate samples for 4 min at 45°C.
2. To homogenize the sample, pipet the lysate directly onto a QIAshredder spin column, placed in a 2 ml collection tube, and centrifuge for 2 min at maximum speed.
3. Add 1 volume (usually 350 µl) of 70% ethanol to the homogenized lysate in the collection tube and mix well by pipetting. Do not centrifuge. Apply the sample, including any precipitate that may have formed, to a RNeasy mini column placed in a 2 ml collection tube. Close the tube gently and centrifuge for 15 s at 8000 x g (10,000 rpm). Discard the flow-through. Transfer the
column into a new 2 ml collection tube.
4. Add 700 µl washing buffer RW1 to the column. Close the tube gently, and centrifuge for 15 s at 8000 x g (10,000 rpm). Discard the flow-through and
5. Pipet 500 µl washing buffer RPE onto the column. Close the tube gently, and centrifuge for 15 s at ≥ 8000 x g (≥ 10,000 rpm). Discard the
flow-through. Transfer the column into a new 2 ml collection tube.
6. Add another 500 µl washing buffer RPE to the column. Close the tube gently, and centrifuge for 2 min at ≥ 8000 x g (≥ 10,000 rpm) to dry the
membrane. Subsequently, to eliminate any chance of possible washing buffer RPE carryover, place the column in a new 2 ml collection tube, and discard the old collection tube with the flow-through. Centrifuge in a microcentrifuge at full speed for 1 min.
7. Remove the column from the collection tube carefully so the column does not contact the flow-through as this will result in carryover of ethanol. Transfer the column to a new 1.5 ml collection tube and proceed with elution of total RNA.
8. Pipet 40 µl nuclease-free water directly onto the membrane. Close the tube gently, incubate for 1 min and centrifuge for 1 min at 8000 x g (10,000 rpm)
to elute.
Store the isolated total RNA on ice while aliquots are pipetted for quantification and the subsequent cDNA synthesis protocol. The concentration of RNA was determined by measuring the absorbance at 260 nm (A260) in a Ultrospec 3000
spectrophotometer (Amersham Biosciences, Freiburg, Germany) using UVette cuvettes (Eppendorf, Hamburg, Germany). In general, to ensure significance, readings should be between 0.10 and 1.0. An absorbance of 1 unit at 260 nm corresponds to 40 µg of RNA per ml. For the measurement the isolated total RNA was diluted 1:50 in nuclease-free water (2 µl total RNA, 98 µl water).
Notes:
• The initial sample homogenization is necessary to reduce the viscosity of the cell lysates. Homogenization shears the high-molecular-weight genomic DNA and other high-molecular-weight cellular components to create a homogeneous lysate. Incomplete homogenization results in inefficient binding of RNA to the silica-gel membrane, and therefore significantly reduced yields.
3.3.2 Synthesis of ds cDNA
For the synthesis of ds cDNA the one-tube double-stranded cDNA Synthesis System (Roche Applied Science, Mannheim, Germany) has been used. This system has been designed according to the method of Gubler and Hoffmann ( 1983) and is optimized to reduce manipulation steps allowing the rapid and reliable synthesis of full length cDNAs, especially from total RNA. During the strand reaction AMV reverse transcriptase is used. The initiation of the first-strand synthesis depends upon hybridization of an oligo [(dT)24 T7promotor]65
primer to the mRNA, usually at the poly(A) tail. This primer also contains a promotor for the T7 RNA polymerase, which enables a subsequent in vitro transcription reaction. The first and second-strand syntheses are performed in the same tube which speeds the synthesis procedure and maximizes recovery of cDNA. Synthesis for the second-strand takes place using the DNA/RNA hybrid as substrate. Mild treatment with RNase H inserts nicks into the RNA, providing 3‘ OH-primers for DNA polymerase I present in the second-strand enzyme cocktail. The 5‘ - 3‘ exonuclease activity of DNA polymerase I removes the primer stretches in the direction of synthesis, which are then replaced with new nucleotides by the polymerase activity. E. coli ligase links the gaps to a
complete ds cDNA strand. The last step in the cDNA synthesis is to ensure that the termini of the cDNA are blunt. This is done by adding T4 DNA polymerase which does remove any remaining overhanging 3‘ ends on the ds cDNAs.
Equipment and solutions:
• cDNA Synthesis System Kit (Roche Applied Science)
• Nuclease-free water (Ambion)
• EDTA, 0.5 M (Sigma)
• Heat block, various temperatures (Eppendorf)
Method:
1. Thaw all necessary components and place them on ice. Pipet the following components in a sterile 1.5 ml reaction tube (40 µl total RT reaction volume):
First-strand cDNA synthesis initiation
Component Volume Final concentration
total RNA variable 1 – 10 µg
oligo[(dT)24 T7 promotor]65 primer 2 µl 200 pmol
water add to 21 µl
final volume 21 µl
First-strand cDNA synthesis reaction
Component Volume Final concentration
RT-buffer, 5X concentrated 8 µl 1X
DTT, 0.1 M 4 µl 10 mM
AMV, 25 U/µl 2 µl 50 U
RNase inhibitor, 25 U/µl 1 µl 25 U dNTP-mix, 10 mM each 4 µl 1 mM each total final volume 40 µl
3. After 60 minutes place the tube 5 min on ice to terminate the reaction. Continue immediately with the second-strand reaction. Pipet directly into the first-strand reaction tube the following components, mix gently, and incubate 2 h at 16°C.
Second-strand cDNA synthesis reaction
Component Volume Final concentration
2nd strand buffer, 5X concentrated 30 µl 1X
dNTP-mix, 10 mM each 1.5 µl 1 mM each 2nd strand enzyme blend 6.5 µl
water 72 µl
total final volume 150 µl
4. After 2 hours incubation, add 20 µl (20 U) T4 DNA polymerase and incubate 5 min at 16°C. Then stop the reaction by adding 6.8 µl EDTA (0.5 M, pH 8.0).
5. Subsequently, digest residual total RNA. Add 1.5 µl (15 U) RNase I and incubate 30 minutes at 37°C. Add 5 µl (3 U) proteinase K to the reaction and incubate another 30 minutes at 37°C.
6. Add 153.5 µl water to the cDNA. The final volume now is 330 µl and the cDNA is ready for the subsequent cleanup step.
Note:
3.3.3 Cleanup of ds cDNA
The cDNA cleanup step was performed using 1.5 ml Phase Lock Gel (PLG) technology caps (Eppendorf). PLG is a product which eliminates interface-protein contamination during the phenol extraction. Upon centrifugation, the gel migrates to form a tight seal between the phases of an aqueous/organic extraction. The organic phase and the interface material are effectively trapped in or below the barrier. This allows the complete and easy transfer of the entire aqueous phase containing the cDNA species by simply pipetting. The risk of contaminating the sample with interface material is eliminated.
Equipment and solutions:
• Phase Lock Gel light (Eppendorf)
• Nuclease-free water (Ambion)
• Ammonium Acetate, 7.5 M (Sigma)
• Glycogen (20 mg/ml) (Roche Applied Science)
• Ethanol, absolute (stored at -20°C) (Roth)
• Ethanol, 80% solution (stored at -20°C)
• Phenol/Chloroform/Isoamylalcohol (25:24:1) (Ambion)
Method:
1. Add 330 µl phenol/chloroform/isoamylalcohol (25:24:1) to the cDNA solution, vortex 10 s and transfer the supernatant to a 1.5 ml PLG tube. Centrifuge 2 min at maximum speed. Transfer supernatant to a new tube.
2. Repeat cleanup but now add 310 µl phenol/chloroform/isoamylalcohol (25:24:1), vortex 10 s and transfer supernatant to a 1.5 ml PLG tube. Centrifuge 2 min at maximum speed. Transfer supernatant to a new tube.
3. Repeat cleanup but now add 290 µl phenol/chloroform/isoamylalcohol (25:24:1), vortex 10 s and transfer supernatant to a 1.5 ml PLG tube. Centrifuge 2 min at maximum speed. Transfer supernatant to a new tube.
4. In this new tube, now containing the purified cDNA, precipitate the ds cDNA by adding 175 µl ammonium acetate (7.5 M), 0.5 µl glycogen (20 mg/ml) and 1000 µl of absolute ethanol. Store over night or longer at -20°C.
5. Pellet the ds cDNA by centrifugation at maximum speed for 30 min, discard the supernatant carefully. Wash the pellet by overlaying with 500 µl 80% ethanol. Centrifuge at maximum speed for 15 min. Then discard the supernatant carefully.
6. Wash the ds cDNA pellet by overlaying with 500 µl 80% ethanol. Centrifuge at maximum speed for 15 min. Then discard the supernatant carefully.
8. Air dry the pellet by evaporating residual ethanol. This takes approximately 5 – 10 min.
9. Dissolve the cDNA pellet in 22 µl nuclease-free water and vortex 10 s. Continue immediately with the in vitro transcription procedure.
Notes:
• It is important to use phenol for the cleaning procedure, i.e., to safely eliminate the RNase I and proteinase K used in the cDNA synthesis method.
3.3.4 Synthesis of biotin-labeled cRNA
After the ds cDNA has been purified, it is transcribed in vitro to generate more than 400 biotinylated cRNA molecules for each ds cDNA molecule. Adequately intact input RNA should result in an expected yield of biotinylated cRNA of between 4- and 10-fold greater than the total RNA input (Hoffmann, 2004).
Equipment and solutions:
• Enzo BioArray HighYield RNA Transcript Labeling Kit (Affymetrix)
• Nuclease-free water (Ambion)
• 1.5 ml Safe-Lock tubes (Eppendorf)
• Heat block, 37°C (Eppendorf)
Method:
1. Pipette the template cDNA and reaction components from the RNA transcript labeling kit to RNase-free microcentrifuge tubes. Perform all steps at room temperature to avoid precipitation of DTT.
In vitro transcription reaction
Component Volume reaction buffer, 10X concentrated 4 µl
DTT, 10X concentrated 4 µl RNase inhibitor mix, 10X concentrated 4 µl biotin-labeled ribonucleotides, 10X concentrated 4 µl T7 RNA polymerase, 20X concentrated 2 µl
template ds cDNA variable
water variable (to give a final volume of 40 µl)
final volume 40 µl
2. Carefully mix the reagents and collect the mixture in the bottom of the tube by brief centrifugation (5 seconds). Then place the reaction tube in a 37°C incubator and incubate for 5 hours. After the IVT immediately proceed with the purification of the biotin-labeled cRNA.
Notes:
• Depending on the input total RNA used for cDNA synthesis, the amount of template cDNA used for each IVT reaction was determined as follows:
Template cDNA used for each IVT reaction
µg total RNA Volume cDNA Volume H2O
5 µg or less 22 µl -
6 µg 20 µl 2 µl
7 µg 18 µl 4 µl
8 µg 16 µl 6 µl
9 µg 13 µl 9 µl
10 µg 11 µl 11 µl