ABSTRACT
BUUR, JENNIFER LEEANN. Applications of Physiologically Based Pharmacokinetic Models in Veterinary Medicine. (Under the direction of Drs. Ronald E. Baynes and Jim E. Riviere.)
Classical approaches to pharmacokinetics, such as compartmental and non-compartmental analysis, provide the basis for most dosing regimens and meat and milk withholding intervals. These models are limited by their descriptive nature to dose, route of
administration, and species. In addition, current pharmacokinetic modeling approaches are unable to predict possible adverse drug reactions due to drug interactions. As combination drug therapy is rapidly increasing, so too does the chance for an adverse drug reaction due to drug interactions. There is a need within veterinary medicine for more predictive and flexible pharmacokinetic modeling approaches that can also be used to explore the possibilities and consequences of adverse drug reactions.
Physiologically based pharmacokinetic (PBPK) models predict drug disposition based on mass balance. This mechanistic approach is predictive and flexible in terms of dose, route of administration, and species. Current uses of PBPK models include human health risk assessment, design of rational dosing regimens, and mechanistic studies of drug interactions. In veterinary medicine, there are only a few validated models.
swine. This model had tissue blocks for all edible tissues. Correlation coefficients for each tissue ranged from 0.86 to 0.99. The model accurately predicted withdrawal intervals after intravenous extralabel drug use. This model was expanded to include population variability and oral route of administration. The model was subjected to Monte Carlo analysis where parameter values were defined by log normal distributions. After validation, this probabilistic PBPK model approach was used to establish the meat withdrawal time for the upper limit of the 95% confidence interval for the 99th percentile of the population for the labeled oral dose.
The model predicted a withdrawal time of 21 days.
Sulfamethazine has also been implicated in adverse drug reactions. It was postulated that the altered drug disposition in horses was due to protein binding interactions between sulfamethazine and flunixin meglumine. Flunixin meglumine has recently been approved for use in swine. Thus there is an increased likelihood that a drug interaction could be seen in swine. To explore this possibility, a PBPK model for sulfamethazine was designed that included linear plasma protein binding and competitive inhibition of plasma protein binding due to flunixin meglumine. The validated PBPK model accurately predicted both free and total sulfamethazine concentrations alone and in the presence of flunixin meglumine. The interaction predicted and identified in vivo was transient and would not contribute to a clinically relevant adverse drug reaction. However, this was the first time a validated PBPK model was used to predict drug interactions due to alterations in protein binding.
APPLICATIONS OF PHYSIOLOGICALLY BASED
PHARMACOKINETIC MODELS IN VETERINARY
MEDICINE
by
JENNIFER LEEANN BUUR
A dissertation submitted to the Graduate Faculty of North Carolina State University
In partial fulfillment of the Requirements for the degree of
Doctor of Philosophy
COMPARATIVE BIOMEDICAL SCIENCES
Raleigh, NC 2007
Approved by:
Ronald Baynes, DVM, PhD Jim Riviere, DVM PhD
Arthur Craigmill, PhD Mark Papich, DVM, MS
DEDICATION
“And I will try to find a higher purpose and meaning to life.” Richard Bach
Jonathan Livingston Seagull
To Erik N. Nielsen.
We both know what you have and haven’t done to deserve this. You truly are my golden one.
BIOGRAPHY
Jennifer Leeann Buur was born and raised in the greater Los Angeles area of California. She completed her pre-veterinary course work at Washington State University in Pullman, Washington and received her Doctor of Veterinary Medicine in 1999 from the University of Wisconsin-Madison. After graduation, she joined private practice in Southern
ACKNOWLEDGEMENTS
TABLE OF CONTENTS
LIST OF TABLES ...viii
LIST OF FIGURES ...x
LIST OF ABBREVIATIONS ...xiii
1. INTRODUCTION ...1
References
...5
2. LITERATURE REVIEW ...6
Pharmacokinetic Models
...7
Quantifying Uncertainty in Pharmacokinetic Models
...17
PBPK Applications
...19
Model Compounds
...26
Analytical Techniques
...30
Summary
...32
References
...34
3. DEVELOPMENT OF A PHYSIOLOGICALLY BASED
PHARMACOKINETIC MODEL FOR ESTIMATING
SULFAMETHAZINE CONCENTRATIONS IN SWINE AND
APPLICATION TO PREDICTION OF VIOLATIVE RESIDUES
IN EDIBLE TISSUES ...45
Abstract
...46
Introduction
...47
Materials and Methods
...48
Results
...54
Discussion
...59
Acknowledgements
...63
4. USE OF PROBABILISTIC MODELING WITHIN A
PHYSIOLOGICALLY BASED PHARMACOKINETIC MODEL
TO PREDICT SULFAMETHAZINE RESIDUE WITHDRAWAL
TIMES IN EDIBLE TISSUES IN SWINE ...67
Abstract
...68
Introduction
...69
Methods
...72
Results
...79
Discussion
...82
Acknowledgments
...86
References
...87
5. PHARMACOKINETICS OF FLUNIXIN MEGLUMINE IN SWINE
AFTER INTRAVENOUS DOSING ...92
Introduction
...93
Methods
...93
Results
...96
Discussion
...97
Acknowledgements
...99
References
...100
6. A PHYSIOLOGICALLY BASED PHARMACOKINETIC
MODEL OF PROTEIN BINDING INTERACTION BETWEEN
SULFAMETHAZINE AND FLUNIXIN MEGLUMINE IN
SWINE ...103
Abstract
...104
Introduction
...105
Materials and Methods
...106
Results
... 116
Discussion
... 118
7. CONCLUSIONS AND FUTURE DIRECTIONS ...128
Conclusions
...129
Future Directions
...131
References
...133
APPENDICES ...134
PBPK Sulfamethazine Meat Withdrawal Time Model Code
...135
Table 2.1 Published pharmacokinetic values for Sulfamethazine in swine after intravenous and oral dosing ...28
Table 3.1 Organ weights and blood flow distributions for market-weight swine determined from published studies ...50
Table 3.2 Differential equations used to describe the rate of change of sulfamethazine in each tissue compartment ...52
Table 3.3 Starting and final values and upper and lower limits for constants of a model used to determine concentrations after IV administration of Sulfamethazine to pigs ...55
Table 3.4 Results for model validation accomplished by comparison of predicted concentrations to observed concentrations by use of an external data set ...55
Table 4.1 Final values for insensitive parameters used in model simulations ...74
Table 4.2 Final distributions for sensitive parameters used in the Monte Carlo analysis ...75
Table 4.4 Tissue concentrations from IV injection of 35 mg/kg Sulfamethazine ...79
Table 4.3 Plasma concentrations after IV injection of 35 mg/kg Sulfamethazine ...79
Table 4.5 Withdrawal time predictions and 95% confidence intervals in days for the 99th percentile of the population for each edible tissue after 100 Monte Carlo runs
of 1000 simulations ...81
Table 5.1 Pharmacokinetic parameters for Flunixin Meglumine after 2.0 mg/kg IV dose in swine ...96
Table 5.2 Percent plasma protein binding at physiological concentrations of Flunixin Meglumine in swine ...97
Table 6.1 Final values for parameters used within the Sulfamethazine PBPK model and Sulfamethazine-Flunixin protein binding interaction model ...113
Table 6.2 Differential equations used to describe the rate of change of Sulfamethazine in each tissue compartment ...114
Figure 2.1 Schematic representation of a generic physiologically based
pharmacokinetic model ...10
Figure 2.2 Schematic representation of a complex tissue block ...10
Figure 2.3 Theoretical schematic illustration of the consequences of protein binding alterations in an open system for a low ER drug (A) or high ER drug (B) during steady state conditions ...26
Figure 3.1 Schematic representation of a physiologically based pharmacokinetic model for use in determining concentrations after IV injection of Sulfamethazine in swine ...49
Figure 3.2 Results for the final fitted model simulation (solid line), compared with results for an external data set (circles), for plasma (A), liver (B), kidney (C),
adipose (D), and muscle (E) tissue compartments ...56
Figure 3.3 Standardized residual plots for fit of the results of the model for plasma (A), liver (B), kidney (C), adipose (D), and muscle (E) tissue
compartments ...57
Figure 3.4 Graphs of predicted and observed data for validation of the model for plasma (A), liver (B), kidney (C), adipose (D), and muscle (E) tissue
compartments ...58
Figure 3.5 Predicted depletion curves for tissue concentrations of drug in tissue compartments after IV administration of Sulfamethazine at a dosage of 50 mg/kg in swine ...59
Figure 4.1 Schematic diagram of the PBPK model for Sulfamethazine in pigs ...72
Figure 4.2 Schematic diagram of the oral dosing route of administration ...73
Figure 4.3 Monte Carlo simulations for Sulfamethazine concentrations in edible tissues after intravenous administration ...80
Figure 4.4 Monte Carlo simulations for Sulfamethazine concentration in edible tissues after oral administration ...80
Figure 4.5 Representative distribution of the time it takes for Sulfamethazine concentrations to fall below the tolerance of 0.1 ppm in kidney tissue from a
Monte Carlo run of 1000 simulations ...81
Figure 5.1 Chromatographs for swine plasma spiked with Flunixin Meglumine at a level of 0.1 µg/mL (A) and blank (B) ...95
Figure 5.2 Mean plasma concentration +/- SD of Flunixin Meglumine after a 2.0 IV dose in swine ...97
Figure 6.1 Schematic diagram of the PBPK model for Sulfamethazine in
swine ...112
Figure 6.2 Protein binding saturation curve for Sulfamethazine in frozen (squares) and fresh (triangles) porcine plasma ...117
Figure 6.4 Results of validation of sulfamethazine PBPK model in swine for
total drug ...119
Figure 6.5 Comparison between observed (squares with dashed line) and predicted (solid line) values of total drug concentration for individual pigs using the
Sulfamethazine-Flunixin protein binding interaction model ...120
Figure 6.6 Comparison between observed (squares with dashed line) and predicted (solid line) values of total drug concentration for a representative
pig at the time of interaction ...118
Figure 6.7 Comparison between observed (squares) and predicted (solid line) values of free drug concentration for individual pigs using the Sulfamethazine-Flunixin protein binding interaction model ...121
Figure 6.8 Residual plot for fit of the results of the Sulfamethazine-Flunixin
protein binding model for total Sulfamethazine concentration ...122
Figure 6.9 Residual plot for fit of the results of the Sulfamethazine-Flunixin
LIST OF ABBREVIATIONS
AMDUCA - Animal Medicinal Drug Use Clarification Act
FARAD - Food Animal Residue Avoidance Databank
FLU - Flunixin Meglumine
NSAID - Non-Steroidal Anti-Inflammatory
PBPK - Physiologically Based Pharmacokinetic
SMZ - Sulfamethazine
US-EPA - United States Environmental Protection Agency
US-FDA - United States Food and Drug Administration
“All models are wrong, some models are useful.” George E. P.. Box
Pharmacokinetic models provide the basis for rational drug use. This includes the design of dosing regimens that are both safe and effective. In veterinary medicine, the large numbers of species and ability to prescribe drugs in extralabel manners contribute to the complexity of rational drug use. Indeed, in food animal medicine, a veterinarian must also take into account the safety of the food supply by providing meat withdrawal intervals for every drug used in both label and extralabel manners (“Federal Food, Drug, and Cosmetic Act,” 2004). In addition, veterinarians are also faced with the challenges of combination drug therapy. As more drugs have become available, combination drug therapy has become the standard of practice for treating many diseases. This has led to an increase in the probability of adverse drug reactions due to drug-drug interactions (Saltvedt et al., 2005). Thus there is a need in veterinary medicine for a pharmacokinetic modeling technique that is able to accommodate the large numbers of species, doses, and routes of administration, as well as to predict and evaluate the consequences of drug-drug interactions.
1999). Physiologically based pharmacokinetic (PBPK) models, on the other hand, are based on mass-balance equations defined by physiological mechanisms. They are predictive in nature and allow for the use of in vitro mechanistic data and population variability data to be applied to in vivo modeling techniques (Grass et al., 2002). Subsequently, there is an opportunity to increase specification and accuracy within a model. This allows more confident application of the models in such areas as dosing regimens, tissue residues, allometric scaling, disease state pharmacokinetic alterations, and drug-drug interactions.
Current standards of practice rely on formularies for dosing regimens as well as government approval for meat and milk withholdinf times. These recommendations are based on
classical compartmental pharmacokinetic analysis that use healthy animals. Theoretically, PBPK modeling can make dosing and withholding time calculations after extralabel drug use more accurate and in accordance with the Animal Medicinal Drug Use Clarification Act (AMDUCA) (“Animal Medicinal Drug Use Clarification Act,” 1994). These regimens could be modified to include individual animal parameters or population variability. Indeed, the stringent requirement of the time for the upper limit of the 95% confidence interval for the 99th percentile of the population to be below tolerance limit, as required by the United
States Food and Drug Administration (US-FDA) for regulatory approval, can be derived by PBPK as well as the currently accepted Tolerance Limit Method (US-FDA-CVM, June 21, 2005). However, there is a paucity of related PBPK models in the literature and the uses and limitations of PBPK modeling have not been explored with regards to veterinary medicine.
References
Animal Medicinal Drug Use Clarification Act (1994). United States Food and Drug Administration. Title 21 Code of Federal Regulations, part 530.
Federal Food, Drug, and Cosmetic Act (2004). Title 21, Code of Federal Regulations, 21-CFR-500.80.
Grass, G. M. & Sinko, P. J. (2002) Physiologically-based pharmacokinetic simulation modelling. Advanced drug delivery reviews, 54, 433-451.
Riviere, J. E. (1999). Comparative Pharmacokinetics: Principles, Techniques, and Applications. Blackwell Publishing, Inc., Ames, Iowa.
Saltvedt, I., Spigset, O., Ruths, S., Fayers, P., Kaasa, S. & Sletvold, O. (2005) Patterns of drug prescription in a geriatric evaluation and management unit as compared with the general medical wards: a randomized study. Eur J Clin Pharmacol, 61, 921-928.
US-FDA-CVM (June 21, 2005). Guidance for Industry #3: General principles for
Pharmacokinetic Models
Classical Compartmental and Non-Compartmental Models
Classical pharmacokinetic modeling can be compartmental or non-compartmental in nature. Both methods generate a series of parameters that describe the course of the drug throughout a system including absorption, distribution, metabolism, and elimination. These phases are incorporated through the generation of rate constants that are based on passive diffusion across membranes. The rate of diffusion across a membrane is described by
C ffusion
Rate of Di = • • •∆
h A P D
[1] where D is the diffusivity coefficient of the drug, P is the partition coefficient of the drug, A is the surface area of the membrane, h is the thickness of the membrane, and ∆C represents the concentration gradient. The diffusivity coefficient represents the inherent properties of the drug itself including hydrogen bonding, stereochemistry and solubility. The partition coefficient represents the relative lipophilicity of the drug. These parameters, combined with the thickness and surface area of the membrane, are all combined into a constant, Kp, that represents the permeability coefficient of the drug. Inserting Kp into Equation 1, you get
C Kp ffusion
Rate of Diffusion = •∆ C
Rate of Di = • • •∆
h A P D
[2] This equation is linear in nature. Thus the assumption of linear or first order kinetics is inherent in classical pharmacokinetic modeling (Riviere, 1999).
combination with dose and plasma concentration values to calculate the kinetic parameters of half life (T1/2), volume of distribution (Vd), and clearance (CL). Using these parameters, dosing regimens and withdrawal times can be calculated (Rowland et al., 1995).
Non-compartmental analysis, in contrast, makes no assumptions about how many
compartments are within the system. Instead non-compartmental analysis uses stochastic methods to describe drug disposition. This is based on calculations including areas under the plasma concentration-time curve (AUC) as well as the first moment (concentration-time-time) curve (AUMC). These models allow for the calculation of a Mean Residence Time (MRT), or the average time a molecule of drug remains in the plasma. Using MRT as well as AUC and AUMC, you can calculate the pharmacokinetic parameters of T1/2, Vd, and CL (Brown, 2001). Noncompartmental models assume first order elimination. Like compartmental analysis, non-compartmental approaches also make no claims as to physiological relevance.
Alternative Pharmacokinetic Models
Beyond classical pharmacokinetic modeling, there are a wide variety of alternative modeling approaches. Population or mixed effect modeling, non-linear modeling, and physiologically based pharmacokinetic approaches have all been applied to pharmacokinetics (Riviere, 1999).
Non-linear modeling is very similar to classical modeling techniques. The main difference is due to the assumption that not all rates are first order in nature. This allows for zero order processes such as metabolism, active transport, and protein binding to be included within the model (Riviere, 1999). Like classical models, this approach is descriptive and focuses on a individual within the population.
Population based pharmacokinetic modeling, on the other hand, uses a pharmacostatistical approach to characterize both a structural pharmacokinetic model (fixed effects) and a statistical model (random effects). This technique can be used to predict the disposition of a drug within a population not directly studied. Unlike classical modeling which heavily samples a small number of subjects, population modeling requires the incorporation of multiple subjects that are sporadically and sparsely sampled. Thus the focus of population modeling is the population rather than the individual (Martin-Jimenez Tomas, 2000).
Physiologically based pharmacokinetic (PBPK) models incorporate physiological and mechanistic descriptions into the mathematical representation of drug disposition. These models, like population based modeling, can be predictive in nature. They can also be easily changed to incorporate alterations in physiological state, age, dose, route of administration, and species (Krishnan et al., 2001).
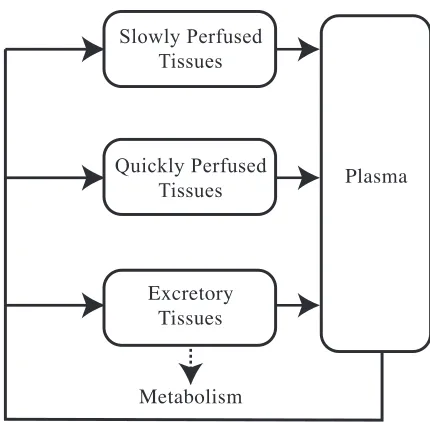
be combined into fewer blocks or separated into more blocks depending on the need of the researcher. For example, the simplest model includes a single high flow tissue block, a single low flow tissue block, and a single excretory tissue block (Figure 2.1). The number and characteristics of the tissue blocks is dependent upon the sensitivity and specificity needed in the model itself. Each tissue block is subdivided into subcompartments that represent the vascular space of blood flow through the tissue, extracellular space, and finally the intracellular space. These subcompartments, like the blocks themselves, can be combined and simplified if needed (Figure 2.2).
Tissue blocks are then further categorized into either flow limited or membrane limited depending on the rate limiting characteristic of that specific tissue. Flow limited tissues are based on the assumptions of a well mixed model. That is, all partitioning of the drug from the blood into the tissue takes place instantaneously and in a homogenous manner. Thus the rate limiting step is the blood flow. This is normally the case for
Slowly Perfused Tissues Quickly Perfused Tissues Excretory Tissues Metabolism Plasma
Figure 2.1 Schematic representation of a generic physiologically based pharmacokinetic model
Solid lines represent blood flow; dotted line represents elimination through metabolism or excretion. Vascular Space Arterial Venous Extracellular Space Intracellular Space Blood Blood Elimination
Figure 2.2 Schematic representation of a complex tissue block
compounds that have a small molecular weight and are lipophilic. Organ systems that are relatively small in volume are also treated in this manner. Membrane limited tissues, on the other hand, are described when it is the diffusion across membranes that is the rate limiting step in partitioning. This occurs with higher molecular weight compounds that are polar in nature as well in large volume organs or in “protected” spaces such as the brain or testes (Ritschel et al., 1986).
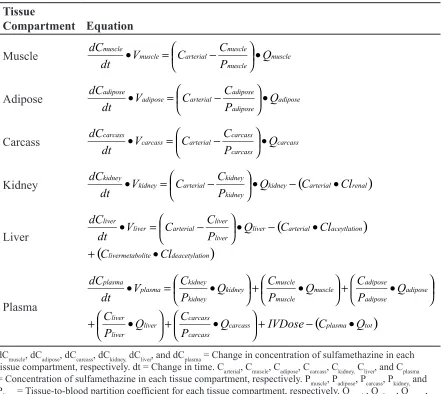
Once the number of tissue blocks and their rate limiting features have been defined, the model is constructed by writing a series of mass balance differential equations. Mass balance is the mathematical concept that the total mass of a drug in a system is constant and can be accounted for. The differential equations describe the rate of change of concentration in the tissue block per unit time. For a flow limited tissue block, the simple form of this equation is
[3]
(
Ca Cv)
Qt dt dCt
Vt• = • −
where Qt, Vt, and Ct are the blood flow, anatomic volume, and concentration of the drug in tissue t and Ca and Cv are the concentration of the drug in the arterial and venous circulations perfusing tissue t respectively. If you assume that Cv is in equilibrium with the vascular space, Cv can be further defined as
[4]
Pt Ct Cv =
where Pt is the tissue-to-blood partition coefficient for tissue t. Combining equations 3 and 4 yields:
[5]
−
• = •
The basic equation for a membrane limited tissue block, where the vascular space is assumed to be instantaneously in equilibrium with the extracellular space, is defined by the rate of change in the extracellular space per unit of time.
[6]
(
Ca Ce)
Kt(
Ce Ci)
Qt dt dCe
Ve• = • − − • −
[7] − • = • Pt Ct Ce Kt dt dCi Vi
where Ve and Ce are the anatomic volume and drug concentration of the extracellular space in tissue t; Vi and Ci are the volume of the intracellular space and the concentration of drug in the intracellular space respectively; Kt is the membrane permeability coefficient for tissue t.
Tissue blocks that metabolize or excrete the drug require further modification of Equations 5 and 6. The addition of a mass removal term, Rex, is then added to account for the loss of drug. Rex can be defined by any set of parameters ranging from a simple first order equation to detailed Michalis-Menten equations for multiple enzymes. The resulting equation for a flow limited tissue block is
Rex − − • = • Pt Ct Ca Qt dt dCt Vt [8] If Rex is a first order process, it could be described as
Ct Kel • =
Rex [9]
where Kel is the first order elimination rate. Thus making the final equation
[10] Ct Kel Pt Ct Ca Qt dt dCt
Vt − •
− • = •
The final step in writing the mathematical model is to write the equation that describe the plasma block. This block is again defined by mass balance where the inputs are the mass from each tissue block’s venous return and the output is the arterial blood concentration. The rate of change in the plasma space per unit of time is then
[11]
(
) (
)
∑
• − •=
• Qt Cv Qp Cp
dt dCp Vp
where Vp, Qp, and Cp are the anatomic volume, the total blood flow, and the concentration of the drug in the plasma compartment respectively. Cv represents the venous concentration of the drug from tissue t that has blood flow Qt (Colburn, 1988; Gerlowski et al., 1983; Krishnan et al., 2001).
curve fitting process. The purpose of curve fitting is to estimate a uniquely identifiable value for each parameter. Uniquely identifiable parameters are ones in which there is a single and unique solution for its value. Statistical limitations, including the degrees of freedom and number of data points available for each tissue block, limit the number of parameters that can be uniquely identified for any given curve fitting technique. Limitation of the curve fitting data set can result in either non-uniquely identifiable parameters (more than one, but still a finite number of values for the parameter) or unidentifiable parameters (infinite number of values) (Williams, 1990). Models that incorporate non-uniquely identifiable or unidentifiable parameters have little predictive value or biological relevance.
The accuracy of a PBPK model is directly related to the accuracy of the parameters used within the mass balance equations. If the parameters are not accurate or are not identifiable, the final model will not reflect true in vivo concentrations of the drug. Thus one major weakness of PBPK modeling is its dependence upon the source literature. However, PBPK models also allow for the inclusion of improved parameters as more information and mechanisms are elucidated.
Simulations are achieved by the simultaneous solving of the differential equations. Currently there are many software packages that are equipped to handle these types of computations. They can range from simple spreadsheet programs to more complex computer programming packages including Simusolv, ACSL, Cmatrix, MatLab and other fortran based programs (Ball et al., 1994; Johanson et al., 1988; Krishnan et al., 2001).
in the evaluation of goodness of fit in PBPK modeling. However, the visual evaluation of these graphs do provide substantial information. The United States Environmental Protection Agency (US-EPA) recently published a guidance on the use of PBPK models in human health risk assessment that acknowledges the lack of stringent statistical evaluation for the validation of PBPK models. They suggest that visual inspection of simulation graphs is adequate in most instances (US-EPA, August, 2006).
Currently, the use of PBPK models is constrained mainly to toxicological applications including human health risk assessment (Bailer et al., 1997; Clewell H. J., 3rd et al., 1997; el-Masri et al., 1995; Gentry et al., 2002). This is mainly due to the time and data intensive nature of the models and the lack of acceptance of these models within industry and
regulatory agencies responsible for drug approvals. The US-EPA allows for the inclusion of PBPK models within the risk assessment section for new pesticides (Anonymous, August, 2006). Beyond the myriad of examples of PBPK models describing disposition of individual toxicants, PBPK models have also been applied to the generation of reference doses and in the prediction of the disposition of chemical mixtures (Gentry et al., 2003; Haddad et al., 2001; Leavens et al., 1996). PBPK approaches allow for the inclusion of allometric scaling into the modeling of xenobiotic disposition (Clewell et al, 2004; Riviere et al, 1997). As is appropriate to human health risk assessment, the focus is on the scaling from rodents to humans (Young et al., 2001). However, these same techniques could be used to evaluate scaling between other types of mammals (ie. ruminants, horses) or non-mammals (i.e. reptiles, birds).
dose regimens, while touted as a strength of this modeling approach, has not been specifically published in the literature. In veterinary medicine, there is a paucity of PBPK models. Currently models have been validated for oxytetracycline in fish and sheep and sulfathiazole in swine (Brocklebank et al., 1997; Craigmill, 2003; Duddy et al., 1984). Like in human medicine, specific applications of these PBPK models have been mentioned but not published.
PBPK has also been applied to areas of theoretical research. PBPK models have been used to elucidate the underlying mechanisms and consequences of enzyme kinetic interactions, permeability alterations, absorption through the skin, and protein or tissue binding (Isaacs et al., 2004; Liu X. et al., 2005; Simmons, 1996; Teeguarden et al., 2005; van der Merwe et al., 2006). The PBPK approach has also been applied to drug development (Blesch et al., 2003; Charnick et al., 1995).
Summary
Quantifying Uncertainty in Pharmacokinetic Models
All models incorporate some amount of uncertainty. Uncertainty can come from random variability, lack of knowledge, or error (Frederick, 1993; Jang et al., 1999). There are a wide variety of ways that uncertainty can be incorporated into pharmacokinetic models. Within population based pharmacokinetic modeling, uncertainty is modeled within the statistical model and covariates are incorporated that reduce the calculated error (Martin-Jimenez Tomas, 2000). Within other types of models, uncertainty is often incorporated by defining parameters in terms of distributions rather than single point estimates. Simple Monte Carlo sampling techniques are used to incorporate distributions and randomness into parameter values. Markov Chain Monte Carlo analysis allows for the incorporation of population variability into parameter estimation (Wakefield, 1996). And finally, bootstrap resampling approaches are used to assess uncertainty and derive confidence intervals around simulations (Hunt et al., 1998). The end result of each of these techniques is a more transparent method of including stochastic methodology into the modeling system.
Simple Monte Carlo sampling is a stochastic approach that, unlike the point estimates used in deterministic approaches, uses a combination of random numbers and probability to determine the value of a parameter. In this simplistic form, it allows for the estimation of uncertainty and the evaluation of the consequences of that uncertainty within a given mathematical model. In the case of pharmacokinetics, this allows for the incorporation of population variability. The end result is that simulations represent not just a single, average member of the population, but the diversity of the population itself.
These steps are repeated for N number of times (ranging from 500 to over 10,000 depending on the situation). The entire set of simulations are then analyzed and conclusions are drawn regarding the population. This process relies on several major assumptions. The first is that the pdf used to describe the parameters is true. The second is that parameters are distributed independently (Wittwer, 2004). Within a PBPK model, the independence assumption is often invalid. This results in overestimation of the consequences of variability (Thomas et al., 1996).
Simple Monte Carlo sampling techniques have been used in a variety of ways since they explore the consequences of uncertainty within a system. Simple Monte Carlo sampling has been incorporated into PBPK models and used in human health risk assessment (Clewell H. J., 3rd et al., 1996; Clewell H. J. et al., 1999; Gearhart et al., 1993; Sweeney L. M. et al., 2001). It is considered to be a useful tool in industry and is an accepted method of incorporating uncertainty into simulations required by US-EPA (US-EPA, March 1997). Its use in the estimation of meat withdrawal times has been theorized (Lathers, 2002). In veterinary medicine, the use of simple Monte Carlo sampling techniques centers around epidemiological studies in disease risk factors, prevention of disease, and prevalence of disease within the population (Hopp et al., 2003; Karsten et al., 2005).
Bootstrap approaches use a similar iterative process as what was described for simple Monte Carlo sampling. In bootstrap techniques, however, the data set used to derive parameter values is an actual data set of observed values and not a pdf. This allows for the generation of confidence intervals around simulations (Iwi et al., 1999; Parke et al., 1999).
probable a population is to produce a particular set of data. Parameter distributions are then updated based on each iteration and its likelihood ratio. Eventually, parameter distributions converge into a stable pdf that is now termed a posteriori distribution. In this way, the pdf of the population are included within the parameter estimation process (Jonsson et al., 2003, Krishnan K. et al., 2005). Markov chain Monte Carlo techniques are used in toxicology to assess risk due to environmental exposures and in veterinary medicine to identify risk factors associated with disease (Green et al., 2004; Jonsson et al., 2002).
No matter how uncertainty is incorporated into PBPK models, it provides an added
dimension to the usefulness of PBPK as a tool. Indeed, it allows PBPK models to be used as a tool for both individual applications (ie. dosing regimens or estimated meat withdrawal time intervals after extralabel drug use) and population based applications (herd health management or public health).
PBPK Applications
Regulatory Applications
The ability to accurately incorporate population variability creates an opportunity for PBPK models to be used in regulatory applications that ensure food safety. Beyond the use of PBPK in US-EPA assessments, appropriate pharmacokinetic analysis is essential to protection of our meat supply. To ensure public health, the United States Food and Drug Administration (US-FDA) requires that all animal products that enter the food supply are free from harmful levels of drugs. To ensure this, for all approved drugs used in food animals, a meat withdrawal time (time between the last dose of drug given and when animal products can be placed in the human food chain) is derived that guarantees drug residues will fall below stated tolerance levels. This must hold true for the upper limit of the 95% confidence interval for the 99th
Currently, meat withdrawal times are calculated using the Tolerance Limit Method. This method calculates a regression line for the linear portion of the depletion curve of the drug of interest in the tissue of interest. Data taken from individual animals serially slaughtered is used to estimate the variance associated with this regression curve. Using the variance, a new line is plotted that represents the 99th percentile of the population. A 95% confidence interval
is then calculated around the 2nd regression line. The meat withdrawal time is then derived by
plotting the depletion curve for the upper limit of the 95% confidence interval and determining the time for that curve to be below the stated tolerance limit (US-FDA-CVM, June 21, 2005).
The US-FDA has responded to these concerns (Martinez et al., 2000). They address the concern of linearity by simply stating that proper study design will ensure that the assumption of linearity is met and the withdrawal time will fall within the inference space. If all samples are truly independent, then, they contend, the assumptions of a log normal distribution and of homoscedasticity would be true. They also state that since variance is required to be calculated at every time point and then statistically evaluated for discrepancies, instances where the assumption is not valid would be detected. Finally, they agree that statistical independence of sampling would not be the case in situations such as multiple biopsies. Again, they defend the method by stating that these concerns are addressed by proper study design (Martinez et al., 2000).
dependence upon approximations. Similarly, simple Monte Carlo analysis has been used to evaluate the assumptions of various withdrawal time estimation methods (Concordet et al., 1997b; Fisch, 2000).
Beyond the determination of withdrawal times for labeled uses, veterinarians must also estimate withdrawal intervals when drugs are used in an extralabel manner. Risk assessment strategies, most notably the Animal Medicinal Drug Use Clarification Act (AMDUCA), have been put in place to help preserve the safety of the food supply and still allow for appropriate treatment of food producing animals (Gehring et al., 2006). Under AMDUCA, veterinarians are allowed to use drugs in an extralabel manner when there is a valid veterinary-client-patient relationship, the drug is being used for therapeutic purposes, no other drug is approved for use in that condition in that species, the drug is a US-FDA approved therapeutic that is not specifically prohibited from extralabel drug use, and no violative residues in food will result. However, extralabel use of feed additives is specifically prohibited except when used in minor species (“Animal Medicinal Drug Use Clarification Act,” 1994). Withdrawal intervals, in this instance, must be based on scientific information and substantially extended to ensure food safety. Currently, the Food Animal Residue Avoidance Databank (FARAD) provides estimated withdrawal intervals to veterinarians by applying the principles of pharmacokinetics to situations of altered dose, route of administration, or species. FARAD uses a combination of methods to produce these withdrawal intervals including classical and population based pharmacokinetic analysis of published and proprietary data, the Extrapolated Withdrawal-Interval Estimator (EWE) Algorithm, foreign drug approval recommendations, and half-life multipliers (Gehring et al., 2004; Martin-Jimenez T. et al., 2002; Payne et al., 1999).
Method. Indeed, PBPK models are already used as tools within the US-EPA in other areas of human health risk assessment (US-EPA, August, 2006). In addition, PBPK models have been postulated to be useful tools in the prediction of meat withdrawal intervals in situations of extralabel drug use (Craigmill, 2003).
Drug-Drug Interactions
Beyond the practical application of PBPK modeling to regulatory concerns, PBPK
approaches can be used to elucidate the underlying mechanisms and clinical consequences of drug-drug interactions. Combination drug therapy is quickly becoming the standard of practice in both human and veterinary medicine. As the number of drugs concurrently prescribed increases, so too does the chance for drug interactions (Saltvedt et al., 2005). Possible areas of interaction relate to altered metabolism (ie. enzyme kinetics), distribution (ie. protein binding), or efficacy (ie. pharmacodynamic).
Among the known routes for drug interactions, alteration of enzyme kinetics has been the most studied using a PBPK approach. Mechanisms of induction and inhibition have been successfully modeled using PBPK models due to the unique ability to incorporate in vitro data such as enzyme kinetics into the model itself (Kanamitsu et al., 2000; Reitz et al., 1988). Validated models have been published that not only predict alterations in drug disposition due to enzyme alterations, but also that explore the underlying mechanisms of the interactions themselves (Isaacs et al., 2004; Leavens et al., 1996; Simmons, 1996). Models that incorporate enzyme kinetics have been validated for fetal, neonatal, and adult exposures of single compounds as well as simple mixtures (Bjorkman, 2004; Haddad et al., 2001). These models have then been applied to human health risk assessment.
Tsuji et al., 1983; Yassen et al., 2005). However, there have not been any published PBPK models that look at interactions within or between these characteristics. Indeed, aside from the modeling of enzyme interactions, there is a paucity of PBPK models for other areas of possible drug interactions.
Protein binding interaction is an area where the physiological nature of PBPK models would be useful to explore both mechanism and clinical impacts of possible drug interactions. Albumin is the most common binding protein found in plasma and thus the site for potential interactions. There is evidence that albumin is highly flexible and contains multiple sites for drug binding, both specific and non-specific in nature (Kragh-Hansen, 1988). However, there are significant species differences in binding characteristics of drugs to plasma
albumin (Kosa et al., 1997). In humans, both antimicrobial agents and non-steroidal anti-inflammatory agents have been found to bind to albumin (Honore et al., 1984; Zeitlinger et al., 2004).
Within PBPK modeling, there are a large number of models that incorporate plasma protein binding to albumin. In fact, these models have been used to explore the effects of binding parameters on tissue distribution and alterations in efficacy and toxicity (Liu X. et al., 2005; Teeguarden et al., 2005). However, there are no published models showing potential interactions at the level of plasma protein binding.
Plasma protein binding is important in determining the safety and efficacy of
chemotherapeutics. Both are determined by the concentration of free drug since only
capacity (Bmax) of the individual drug and the equilibrium dissociation constant (Kd), which is the concentration of drug at half of Bmax. For linear binding,
[12]
Kd B
Kd C Cfree tot
+ • =
max
where Cfree and Ctot are the concentrations of free and total drugs respectively (Toutain et al., 2002). Both Kd and Bmax can be altered in the presence of other substances (Ascenzi et al., 2006). Based on Equation 12, the result would be an alteration in the free drug concentration.
The clinical relevance of these interactions in an open system is a topic of confusion (Benet et al., 2002; Toutain et al., 2002). There are several mathematical proofs for why these interactions may not be clinically relevant. However, these theoretical models have not been validated by in vivo experiments. The most common proof is summarized as follows. Free fraction of a drug is defined as
[13]
tot free
C C fu =
where fu is the free fraction of the drug. For low extraction ratio drugs (ER<0.3),
int
CL fu
CLtot = • [14]
[15]
int CL
CLfree=
[16]
CL ER C =
CLint, CLfree, and CLtot are intrinsic, free, and total drug clearance respectively; C is
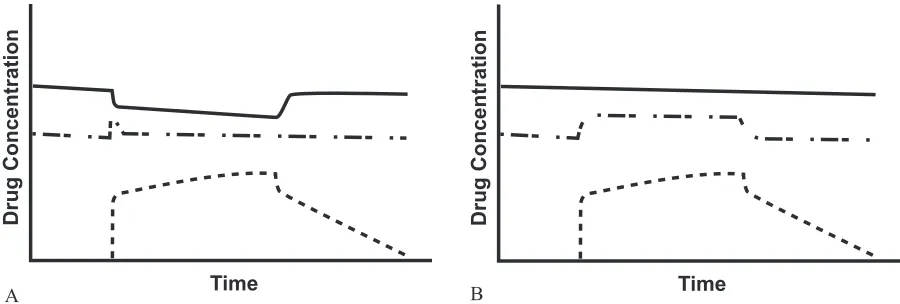
2.3). The corollary to this argument is that high ER drugs could have a sustained increase in fu since CLfree is now dependent upon fu while CLtot would remain the same (Figure 2.3) (Rowland et al., 1995). However, there are very few high ER drugs used in veterinary and human medicine that are also highly protein bound. Clinically relevant drug interactions due to protein binding would be uncommon (Benet et al., 2002; Toutain et al., 2002).
While protein binding interactions may not be relevant to alterations in clinical effect, they can be relevant to therapeutic drug monitoring. Most techniques measure total drug concentration. As can be seen in Figure 2.3, the Ctot decreases in the presence of a competitive inhibitor. This could lead to erroneous increases in dose that could lead to toxicity or other adverse drug reactions (Benet et al., 2002).
Model Compounds
Sulfamethazine
Sulfamethazine (SMZ), also known as sulfadimidine, is a sulfonamide antimicrobial labeled for use in pigs as a feed additive to prevent and treat cervical abscesses, colibacillosis, swine
Figure 2.3 Theoretical schematic illustration of the consequences of protein binding alterations in an open system for a low ER drug (A) or high ER drug (B) during steady state conditions
Solid line represents total drug; dot-dashed line represents free drug; dotted line represents binding inhibitor Time
Drug Concentration
A Time
Drug Concentration
dysentery, and bacterial pneumonia, as well as for increasing feed efficiency in the presence of other disease such as atrophic rhinitis (Anonymous, 2006). Sulfamethazine is a zwitter ion (has both acidic and basic functional groups) with pKa’s of 2.65 and 7.4. It has a molecular weight of 278.33 g/mol. Sulfamethazine’s polar nature is reflected in the octanol:water partition coefficient (Ko/w) of 1.41 and a log (Ko/w) of 0.15 at pH 7 (Carda-Broch et al., 2004). The US-FDA and other international regulatory agencies have set a residue tolerance limit for sulfamethazine to be 0.1 ppm in all edible tissues of swine (“Federal Food, Drug, and Cosmetic Act,” 1982)
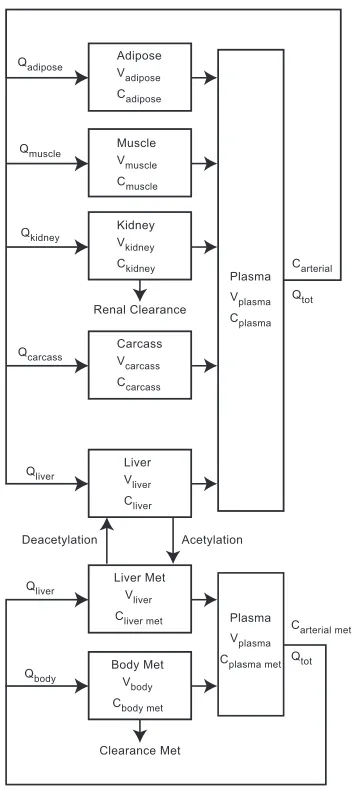
The pharmacokinetics of SMZ have been extensively studied in multiple species including carp, cattle, chickens, goats, horses, humans, rats, sheep, snails, swine, and turtles (Nouws J.F.M. et al., 1986b; Paulson et al., 1983). In swine, SMZ is directly metabolized to N4-acetyl metabolite in the liver by the N-Acetyltransferase 2 (NAT-2) enzyme rather than the more common phase I pathway of hydroxylation found in most other species. The N4-acetyl metabolite is then cleared by the kidneys or is deacetylated back into the parent compound (Mengelers et al., 1997; Shimoda et al., 1997). Both genetic and gender differences in the NAT-2 enzyme have been documented in hamsters, humans, mice, rabbits, rats, and ruminants; resulting in the classification of fast and slow acetylators. However this variability has not been documented in swine (Hoogenboom et al., 1989; Mengelers et al., 1997). SMZ has a moderate extraction ratio of around 0.58 in the rabbit (du Souich et al., 1981).
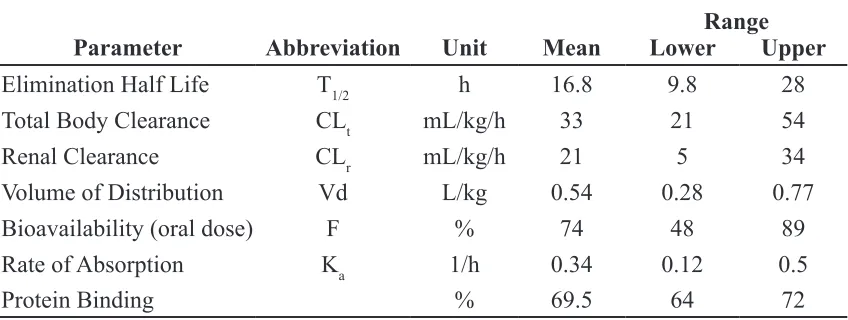
Nouws J.F.M. et al., 1986b; Piva et al., 1997; Poucke et al., 1994; Romvary et al., 1976; Shimoda et al., 1997; Sweeney R. W. et al., 1993; Yuan et al., 1997). Sulfamethazine is moderately protein bound (ranging from 60 to 87 %) to albumin at the warfarin binding site (Munsey et al., 1996). A summary of the average pharmacokinetic parameters for SMZ in swine is presented in Table 2.1.
Flunixin Meglumine
Flunixin Meglumine (FLU) is a non-steroidal anti-inflammatory (NSAID) used in many species. It is currently labeled for intramuscular (IM) use in swine for the treatment of
pyrexia associated with respiratory disease (Anonymous, 2006). The molecular weight of the salt is 491.46 g/mol. It is a weak acid with a pKa of 5.82 and a log (Ko/w) of 5.22 for the free flunixin acid (TerraQSAR-LOGP).
The pharmacokinetics of FLU have been studied in camels, cattle, chickens, equines
(including donkeys, mules, and horses), felines, goats, llamas, rabbits, and sheep (Anderson et al., 1990; Baert et al., 2002; Cheng et al., 1998; Coakley et al., 1999; Elmas et al., 2006; Horii et al., 2004; Konigsson et al., 2003; Navarre et al., 2001; Oukessou, 1994). In swine
Range Parameter Abbreviation Unit Mean Lower Upper
Elimination Half Life T1/2 h 16.8 9.8 28
Total Body Clearance CLt mL/kg/h 33 21 54
Renal Clearance CLr mL/kg/h 21 5 34
Volume of Distribution Vd L/kg 0.54 0.28 0.77
Bioavailability (oral dose) F % 74 48 89
Rate of Absorption Ka 1/h 0.34 0.12 0.5
Protein Binding % 69.5 64 72
after IM dosing, FLU is characterized by a 2 compartment model. The mean elimination T1/2 is between 3 to 4 hours; Vd is 2.003 L/kg; and CLbody is 390 mL/kg/h. Bioavailability of an IM dose is reported to be 87% (“Freedom of Information Summary,” 2005). Flunixin is cleared via biliary excretion and there is evidence of enterohepatic recycling in cats, cattle, and goats (Anderson et al., 1990; Horii et al., 2004; Konigsson et al., 2003). It is over 99% protein bound in plasma in cats, cattle, and horses (Anderson et al., 1990; Coakley et al., 1999; Horii et al., 2004).
Clinical relevance
According to the United States Department of Agriculture-Food Safety Inspection Service (USDA-FSIS) Red Book, in 2000 SMZ was the number one violative residue found in swine and in 2003 was the only sulfonamide found in violation of tolerance limits (FSIS, 2001; FSIS, 2004). This presents a significant public health concern due to both a large percentage of human allergic reactions related to sulfonamide drugs and evidence that SMZ can
contribute to the formation of thyroid tumors in rats (Poirier et al., 1999; Slatore et al., 2004; Wong et al., 2005). The current meat withdrawal time is 15 days.
Analytical Techniques
Chromatography
Chromatography is a common method for the quantification of drugs within biological systems. Thin layer chromatography (TLC), liquid chromatography (LC) including high pressure (HPLC) or ultra-high pressure (UPLC) chromatography, and gas chromatography (GC) are all methods that use the different physiochemical properties of drugs to provide adequate separation between the molecule of interest and biological interferences. The results can be used for both confirmation and quantification of drugs within a biological matrix (de Silva, 1985; Stolker et al., 2005). Each method has its own uses, advantages, and disadvantages.
Separations by TLC are achieved by differences in adsorption or partition properties of the plate and the molecules of interest. This technique is rapid, inexpensive, and allows for visual semi-quantification. Quantification can be achieved directly by fluorescence, fluorescence quenching, and densitometry; or indirectly by using TLC as a clean up technique prior to some other form of quantification such as HPLC (de Silva, 1985).
Gas chromatography methods offer high levels of sensitivity and specificity. They are suited for drugs that are heat stable and semi-volatile or volatile in nature. The mobile phase in GC analysis consists of an inert gas that serves as a medium to pass the gaseous drug through a column where differences in binding properties will allow for adequate separation. The wide variety of detectors that can be connected to GC systems allows for significant versatility (de Silva, 1985). The model drugs described above are neither semi-volatile or volatile in nature. Thus LC methods were developed for both plasma and tissue quantification.
solvent as the mobile phase) conditions depending on the molecule of interest. Differences between HPLC and UPLC are derived from the pressures generated within the system. The higher pressures found in UPLC systems allow for quicker analysis and slightly altered separation properties. Like GC systems, LC systems can be combined with a wide variety of detectors making them versatile, sensitive, and specific. LC methods are suited to the analysis of thermally unstable compounds, non-volatile compounds or zwitterionic compounds. It is the method of choice for the quantification of SMZ in tissues (de Silva, 1985; Stolker et al., 2005).
Protein Binding Parameters
The protein binding parameters Kd (equilibrium dissociation constant) and Bmax (maximal binding) can be determined from analysis of in vitro saturation binding experiments. Saturation binding experiments require the quantification of specific binding of drug at various concentrations while levels of protein are held constant. Quantification of bound drug is most often done using radioligand approaches. However, unlabeled drug can be quantified in vivo using microdialysis, or in vitro using equilibrium dialysis, ultrafiltration, high-performance frontal analysis, and automated sequential trace enrichment of dialysate (Liu Z. et al., 1999).
equilibrium does not change with altered concentrations of protein, and there is no leakage of bound proteins through the membrane. Unlike equilibrium dialysis, there are no issues with volume shifts and dilution of samples. And unlike high-performance frontal analysis it does not require large volumes of sample for analysis. These traits make it a very common procedure for therapeutic drug monitoring as well as in basic pharmacology research (Liu Z. et al., 1999; Wright et al., 1996).
Once obtained, specific binding data is used to estimate Kd and Bmax. Values are estimated using nonlinear regression techniques that fit a one site binding hyperbola equation
(Equation 17) to the data using least likelihood ratios.
[17]
tot tot bound
C Kd
C B
C
+ •
= max
Cbound is the concentration of specifically bound drug. Older methods including Scatchard, double reciprocal, or Rosenthal plots require the transformation of data to linearize the data. The transformation process distorts error and violates assumptions of linear regression by altering the relationship between the values on the X and Y axis. Since nonlinear techniques do not require the transformation of data, they provide more accurate parameter estimations. However, this type of analysis does assume that binding follows the law of mass action, the sample is at equilibrium, there is only one site for binding, there is no cooperativity, and only a small fraction of the drug is bound. The last assumption addresses alterations in binding affinities due to ligand depletion. Ligand depletion creates variability between concentrations. It is minimized by reducing the amount of protein or by increasing the amount of drug in the system (Motulsky, 1995).
Summary
have the advantages of being mechanistic, predictive, flexible in terms of dose, route of administration and species, and can include in vitro mechanistic data. The accuracy of these models can be continually improved over time as more is learned regarding the underlying processes of drug disposition. In addition, PBPK models can incorporate uncertainty by the use of Bayesian techniques like simple Monte Carlo sampling that use a combination of statistical distributions and randomness to predict population parameters.
The versatility of PBPK models makes them uniquely suited to applications in food safety where they could serve as an alternative method to the Tolerance Limit Method currently used for establishing meat withdrawal times for labeled drugs and as a collaborative method for the estimation of meat withdrawal intervals for drugs used in an extralabel manner. Beyond the practical applications, PBPK models are also used to study the underlying mechanisms that determine drug disposition for single drug exposures as well as in times of concurrent drug administration. The techniques have been used in enzyme alterations and could be extended to situations involving protein binding interactions.
References
Anderson, K. L., Neff-Davis, C. A., Davis, L. E. & Bass, V. D. (1990) Pharmacokinetics of flunixin meglumine in lactating cattle after single and multiple intramuscular and intravenous administrations. American Journal of Veterinary Research, 51, 1464-1467.
Animal Medicinal Drug Use Clarification Act (1994). United States Food and Drug Administration. Title 21 Code of Federal Regulations, part 530.
Anonymous (2006). Compendium of Veterinary Products, 9th Edition Eds S. Inglis. Adrian J. Bayley, Port Huron, Michigan.
Ascenzi, P., Bocedi, A., Notari, S., Fanali, G., Fesce, R. & Fasano, M. (2006) Allosteric modulation of drug binding to human serum albumin. Mini Rev Med Chem, 6, 483-489.
Baert, K. & De Backer, P. (2002) Disposition of sodium salicylate, flunixin and meloxicam after intravenous administration in broiler chickens. Journal of Veterinary Pharmacology and Therapeutics, 25, 449-453.
Bailer, A. J. & Dankovic, D. A. (1997) An introduction to the use of physiologically based pharmacokinetic models in risk assessment. Statistical methods in medical research, 6, 341-358.
Ball, R. & Schwartz, S. L. (1994) CMATRIX: software for physiologically based
pharmacokinetic modeling using a symbolic matrix representation system. Comput Biol Med,
24, 269-276.
Beliveau, M., Tardif, R. & Krishnan, K. (2003) Quantitative structure-property relationships for physiologically based pharmacokinetic modeling of volatile organic chemicals in rats.
Toxicol Appl Pharmacol, 189, 221-232.
Benet, L. Z. & Hoener, B. A. (2002) Changes in plasma protein binding have little clinical relevance. Clin Pharmacol Ther, 71, 115-121.
Bjorkman, S. (2004) Prediction of drug disposition in infants and children by means of physiologically based pharmacokinetic (PBPK) modelling: theophylline and midazolam as model drugs. British Journal of Clinical Pharmacology, 59, 691-704.
Brocklebank, J. R., Namdari, R. & Law, F. C. (1997) An oxytetracycline residue depletion study to assess the physiologically based pharmacokinetic (PBPK) model in farmed Atlantic salmon. Can Vet J, 38, 645-646.
Brown, S. A. (2001). Pharmacokinetics: Disposition and Fate of Drugs in the Body. In
Veterinary Pharmacology and Therapeutics, 8th Edition. Eds. H. R. Adams. Iowa State University Press, Ames, Iowa, 15-56.
Carda-Broch, S. & Berthod, A. (2004) Counter current chromatography for the measurement of the hydrophobicity of sulfonamide amphoteric compounds. Chromatographia, 59, 79-87.
Charnick, S. B., Kawai, R., Nedelman, J. R., Lemaire, M., Niederberger, W. & Sato, H. (1995) Perspectives in pharmacokinetics. Physiologically based pharmacokinetic modeling as a tool for drug development. J Pharmacokinet Biopharm, 23, 217-229.
Cheng, Z., Mckeller, Q. & Nolan, A. (1998) Pharmacokinetic studies of flunixin meglumine and phenylbutazone in plasma, exudate and transudate in sheep. Journal of Veterinary Pharmacology and Therapeutics, 21, 315-321.
Clewell, H. J., 3rd & Andersen, M. E. (1996) Use of physiologically based pharmacokinetic modeling to investigate individual versus population risk. Toxicology, 111, 315-329.
Clewell, H. J., 3rd, Gentry, P. R. & Gearhart, J. M. (1997) Investigation of the potential impact of benchmark dose and pharmacokinetic modeling in noncancer risk assessment. J Toxicol Environ Health, 52, 475-515.
Clewell, H. J., Gearhart, J. M., Gentry, P. R., Covington, T. R., Vanlandingham, C. B., Crump, K. S. & Shipp, A. M. (1999) Evaluation of the uncertainty in an oral reference dose for
methylmercury due to interindividual variability in pharmacokinetics. Risk Anal, 19, 547-558.
Clewell H. J., Gentry, P. R., Covington, T. R., Sarangapani, R. & Teeguarden, J. G. (2004) Evaluation of the potential impact of age- and gender-specific pharmacokinetic differences on tissue dosimetry. Toxicol Sci,79, 381-393.
Coakley, M., Peck, K. E., Taylor, T. S., Matthews, N. S. & Mealey, K. L. (1999)
Pharmacokinetics of flunixin meglumine in donkeys, mules, and horses. American Journal of Veterinary Research, 60, 1441-1444.
Colburn, W. A. (1988) Physiologic pharmacokinetic modeling. Journal of clinical pharmacology, 28, 673-677.
Concordet, D. & Toutain, P. L. (1997b) The withdrawal time estimation of veterinary drugs: a non-parametric approach. J Vet Pharmacol Ther, 20, 374-379.
Craigmill, A. L. (2003) A physiologically based pharmacokinetic model for oxytetracycline residues in sheep. J Vet Pharmacol Ther, 26, 55-63.
de Silva, J. A. (1985) Analytical strategies for therapeutic monitoring of drugs in biological fluids. J Chromatogr, 340, 3-30.
DeJongh, J. & Blaauboer, B. J. (1996) Simulation of toluene kinetics in the rat by a physiologically based pharmacokinetic model with application of biotransformation parameters derived independently in vitro and in vivo. Fundam Appl Toxicol, 32, 260-268.
du Souich, P. & Courteau, H. (1981) Induction of acetylating capacity with complete Freund’s adjuvant and hydrocortisone in the rabbit. Drug Metab Dispos, 9, 279-283.
Duddy, J., Hayden, T. L., Bourne, D. W., Fiske, W. D., Benedek, I. H., Stanley, D., Gonzalez, A. & Heierman, W. (1984) Physiological model for distribution of sulfathiazole in swine. J Pharm Sci, 73, 1525-1528.
el-Banna, H. A. (1999) Pharmacokinetic interactions between flunixin and sulphadimidine in horses. Dtsch Tierarztl Wochenschr, 106, 400-403.
Elmas, M., Yazar, E., Uney, K. & Karabacak, A. (2006) Pharmacokinetics of flunixin after intravenous administration in healthy and endotoxaemic rabbits. Veterinary Research Communications, 30, 73-81.
el-Masri, H. A., Thomas, R. S., Benjamin, S. A. & Yang, R. S. (1995) Physiologically based pharmacokinetic/pharmacodynamic modeling of chemical mixtures and possible applications in risk assessment. Toxicology, 105, 275-282.
Federal Food, Drug, and Cosmetic Act (1982). Title 21, Code of Federal Regulations, 21-CFR-556.670.
Federal Food, Drug, and Cosmetic Act (2004). Title 21, Code of Federal Regulations, 21-CFR-500.80.
Fisch, R. D. (2000) Withdrawal time estimation of veterinary drugs: extending the range of statistical methods. J Vet Pharmacol Ther, 23, 159-162.
FSIS (2004). 2003 FSIS National Residue Program Data. Food Safety Inspection Service. United States Department of Agriculture, Washington, DC.
Fouchecourt, M. O., Beliveau, M. & Krishnan, K. (2001) Quantitative structure-pharmacokinetic relationship modelling. Sci Total Environ, 274, 125-135.
Frederick, C. B. (1993) Limiting the uncertainty in risk assessment by the development of physiologically based pharmacokinetic and pharmacodynamic models. Toxicol Lett, 68, 159-175.
Freedom of Information Summary (2005). Supplemental New Animal Drug Application, NADA 101-479.
Gearhart, J. M., Mahle, D. A., Greene, R. J., Seckel, C. S., Flemming, C. D., Fisher, J. W. & Clewell, H. J., 3rd (1993) Variability of physiologically based pharmacokinetic (PBPK) model parameters and their effects on PBPK model predictions in a risk assessment for perchloroethylene (PCE). Toxicol Lett, 68, 131-144.
Gehring, R., Baynes, R. E., Craigmill, A. L. & Riviere, J. E. (2004) Feasibility of using half-life multipliers to estimate extended withdrawal intervals following the extralabel use of drugs in food-producing animals. J Food Prot, 67, 555-560.
Gehring, R., Baynes, R. E. & Riviere, J. E. (2006) Application of risk assessment and management principles to the extralabel use of drugs in food-producing animals. J Vet Pharmacol Ther, 29, 5-14.
Gentry, P. R., Covington, T. R., Andersen, M. E. & Clewell, H. J., 3rd (2002) Application of a physiologically based pharmacokinetic model for isopropanol in the derivation of a reference dose and reference concentration. Regul Toxicol Pharmacol, 36, 51-68.
Gentry, P. R., Covington, T. R., Clewell, H. J., 3rd & Anderson, M. E. (2003) Application of a physiologically based pharmacokinetic model for reference dose and reference concentration estimation for acetone. Journal of toxicology and environmental health. Part A, 66, 2209-2225.
Gerlowski, L. E. & Jain, R. K. (1983) Physiologically based pharmacokinetic modeling: principles and applications. J Pharm Sci, 72, 1103-1127.
Haddad, S., Beliveau, M., Tardif, R. & Krishnan, K. (2001) A PBPK modeling-based approach to account for interactions in the health risk assessment of chemical mixtures.
Toxicol Sci, 63, 125-131.
Honore, B. & Brodersen, R. (1984) Albumin binding of anti-inflammatory drugs. Utility of a site-oriented versus a stoichiometric analysis. Mol Pharmacol, 25, 137-150.
Hoogenboom, L. A., Pastoor, F. J., Clous, W. E., Hesse, S. E. & Kuiper, H. A. (1989) The use of porcine hepatocytes for biotransformation studies of veterinary drugs. Xenobiotica, 19, 1207-1219.
Hopp, P., Webb, C. R. & Jarp, J. (2003) Monte Carlo simulation of surveillance strategies for scrapie in Norwegian sheep. Prev Vet Med, 61, 103-125.
Horii, Y., Ikenaga, M., Shimoda, M. & Kokue, E. (2004) Pharmacokinetics of flunixin in the cat: enterohepatic circulation and active transport mechanism in the liver. Journal of Veterinary Pharmacology and Therapeutics, 27, 65-69.
Hunt, C. A., Givens, G. H. & Guzy, S. (1998) Bootstrapping for pharmacokinetic models: visualization of predictive and parameter uncertainty. Pharm Res, 15, 690-697.
Isaacs, K. K., Evans, M. V. & Harris, T. R. (2004) Visualization-based analysis for a mixed-inhibition binary PBPK model: determination of mixed-inhibition mechanism. J Pharmacokinet Pharmacodyn, 31, 215-242.
Iwi, G., Millard, R. K., Palmer, A. M., Preece, A. W. & Saunders, M. (1999) Bootstrap
resampling: a powerful method of assessing confidence intervals for doses from experimental data. Phys Med Biol, 44, N55-62.
Jang, J. Y., Droz, P. O. & Chung, H. K. (1999) Uncertainties in physiologically based
pharmacokinetic models caused by several input parameters. Int Arch Occup Environ Health,
72, 247-254.
Johanson, G. & Naslund, P. H. (1988) Spreadsheet programming--a new approach in physiologically based modeling of solvent toxicokinetics. Toxicol Lett, 41, 115-127.
Jones, D. K., Hakim, M., Wallwork, J., Higenbottam, T. W. & White, D. J. (1986) Serious interaction between cyclosporin A and sulphadimidine. Br Med J (Clin Res Ed), 292, 728-729.
Jonsson, F. & Johanson, G. (2003) The Bayesian population approach to physiological toxicokinetic-toxicodynamic models--an example using the MCSim software. Toxicol Lett,
138, 143-150.
Kanamitsu, S., Ito, K., Green, C. E., Tyson, C. A., Shimada, N. & Sugiyama, Y. (2000) Prediction of in vivo interaction between triazolam and erythromycin based on in vitro studies using human liver microsomes and recombinant human CYP3A4. Pharm Res, 17, 419-426.
Karsten, S., Rave, G. & Krieter, J. (2005) Monte Carlo simulation of classical swine fever epidemics and control. II. Validation of the model. Vet Microbiol, 108, 199-205.
Kawai, R., Lemaire, M., Steimer, J. L., Bruelisauer, A., Niederberger, W. & Rowland, M. (1994) Physiologically based pharmacokinetic study on a cyclosporin derivative, SDZ IMM 125. J Pharmacokinet Biopharm, 22, 327-365.
Kokue, E., Shimoda, M., Sakurada, K. & Wada, J. (1988) Pharmacokinetics of oral sulfa drugs and gastric emptying in the pig. J Pharmacobiodyn, 11, 549-554.
Konigsson, K., Torneke, K., Engeland, I. V., Odensvik, K. & Kindahl, H. (2003)
Pharmacokinetics and pharmacodynamic effects of flunixin after intravenous, intramuscular and oral administration to dairy goats. Acta Veterinaria Scandinavica, 44, 153-159.
Kosa, T., Maruyama, T. & Otagiri, M. (1997) Species differences of serum albumins: I. Drug binding sites. Pharm Res, 14, 1607-1612.
Kragh-Hansen, U. (1988) Evidence for a large and flexible region of human serum albumin possessing high affinity binding sites for salicylate, warfarin, and other ligands. Mol
Pharmacol, 34, 160-171.
Krishnan, K. & Andersen, M. E. (2001). Physiologically Based Pharmacokinetic Modeling in Toxicology. In Principles and Methods of Toxicology, Eds. A. W. Hayes. Taylor & Francis, Philadelphia, 193-241.
Krishnan, K. & Johanson, G. (2005) Physiologically-based pharmacokinetic and
toxicokinetic models in cancer risk assessment. J Environ Sci Health C Environ Carcinog Ecotoxicol Rev,23, 31-53.