Volume 8, No. 5, May-June 2017
International Journal of Advanced Research in Computer Science
REVIEW ARTICLE
Available Online at www.ijarcs.info
ISSN No. 0976-5697
Review of Programming Languages and Tools for Big Data Analytics
Tamanna Siddiqui
Department of Computer Science Aligarh Muslim University, Aligarh, India
Mohammad Alkadri
Department of Computer Science Aligarh Muslim University Aligarh, India
Najeeb Ahmad Khan
SRB International Private Limited Noida (UP), India
Abstract: Big data is a large pool of data that can be captured, communicated, aggregated, stored, and analyzed. This fact made big data material an attractive area for data scientists to innovate and practice their algorithms to implement and analyze this complex and unstructured data pool. In order to fully appreciate and carry out these tasks, data scientists are required to have a specific kind of knowledge and usage of powerful languages and tools.
This paper presents a systematic review of programming languages, statistical tools, analytical solutions and visualization applications available in big data analytics area. Comparative study has been done to produce some concluding remarks.
Keywords: Big Data, Data Sciences, R, Python, SAS, SPSS, Tableau, SQL Server.
INTRODUCTION
To work in big data analytics you should be one of the data scientists in this field, and choose your sufficient tools which will able you to achieve all your analyzing tasks in proper way.
There are a lot of great analytical tools for data; they are categorized in three groups, programming languages, statistical solutions and visualization tools [1]. Choosing one or some of them depends on your background in programming and your statistical knowledge.
For example when you want to use R language you have to have a good background in both science programming and statistics. In contrast, in visualization tools you can play with data without that knowledge.
BIGDATACLOUDPLATFORMS
Many frameworks are available in the market to handle big data challenges, some of them are open source like Apache Hadoop and SciDB, and others are proprietary frameworks owned by companies like Google, IBM, Amazon and Microsoft [1].
Depending on the features of these frameworks, many platforms were built on the cloud (Google AppEngine, Microsoft Azur, Amazon EC2, …) ; each of them has their own manner to handle big data problems (storage data, analytics, database issues and machine learning implementation).
Next table compare between famous big data cloud platforms:
Table1: Google VS Amazon VS Microsoft Comparison
Amazon Microsoft Google
Big data storage S3 Azure Google cloud services Big data analytics Elastic MapReduce (Hadoop) Hadoop on Azure BigQuery
Relational database MySQL or Oracle SQL Azure Cloud SQL
NoSQL database DynamoDB Table storage AppEngine Datastore MapReduce Elastic MapReduce (Hadoop) Hadoop on Azure AppEngine
Streaming processing Nothing prepackaged Streaminsight Search API Machine learning Hadoop+Mahout Hadoop+Mahout Prediction API Data sources Public Datasets Windows Azure marketplace A few sample datasets Availability Public production Some services in private beta Some services in private beta
BIG DATA ANALYTICS SOFTWARE AND
LANGUAGES
Programming Languages
For big data analytics, a lot of programming languages are provided which take care of all variant tasks in this field, but they can be divided into two groups: (High level, Low level), these levels are distinguished by the analytical usage of these languages.
High Level
PYTHON
Python language is one of the famous data analyzing language which data scientists use to focus on in their researches. The high-level interactive nature of this language and its scientific ecosystem libraries make it the preferred choice for developing analytical algorithms and exploring the hidden facts in the data [2].
Focusing on the scientific computing community, it is easy to notice how the usage of Python language increases in this community (starting from the early 2000), in both industry solutions (applications) and academic research [3].
Python has its scientific ecosystem as well as a lot of useful library which are:
Numpy: Stand for "Numerical Python", it's the base data structure and the fundamental package in Python language. Knowing that all input data in Python is represented as numpy array; make it easily to infer that all libraries in this language built on top of this package [2].
Numpy provides these features [3]:
• Ndarray: An efficient and fast multidimensional array object.
• Long list of functions to manipulate with arrays through element-wise computations with them or by providing mathematical operators between arrays.
• Tools for reading and writing array-based data sets to disk.
• Fourier transform, Linear algebra operations, and random number generation.
• Tools to integrate other languages code (C, C++, and FORTRAN) in Python.
Pandas: This package support the scientists and fasten their tasks on structured data with its prepared and pre-designed functions and the rich data structures and make these tasks easy and significant [3].
Matplotlib: for visualization data and drawing expressive plots, this tool is very popular and effective for these tasks especially for 2D plots [3].
IPython: is an interactive computing and development environment, it's used to maximize your productivity in both interactive computing and software development. It also includes a rich GUI console with inline plotting, a web-based interactive notebook format, and a lightweight, fast parallel computing engine. It's a consolidation on the Python shell to hasten the writing, testing, and debugging of Python code [3].
SciPy: is a collection of packages of efficient algorithms for linear algebra, sparse matrix representation, special functions and basic statistical functions [2]. These packages include [3]:
• scipy.integrate • scipy.linalg • scipy.optimize
• scipy.signal • scipy.sparse • scipy.special
• scipy.stats • scipy.weave •
Also for Fortran-based standard numerical packages, scipy has bindings for many of them; such as LAPACK [2].
Cython: Data scientists can use Python syntax and high level operations, and increase compiling performance to reach the performance of the compiled languages, by using this package because it combine C in Python [2].
R Language
functional based syntax or program based code with very powerful debugging facilities, and this language has a many interfaces to other programming languages. Then the resulting statistics can be displayed by using the high level graphical tool in R [5].
When data scientists work in any fields of big data like data business, industry, and government, you'll find the majority of them using R environment and packages (comparison between languages will discuss later), even when they work in medicine, academia, and so on.
R has the following features [6]:
• A short and slim syntax to accelerate your tasks on your data.
• It has a variant formats for loading and storing data for both local and over internet tasks.
• Ability to perform your tasks in memory by using a consistent syntax.
• A long list of tools (functions, packages) for data analysis tasks, some of them are built in and the rest are open source.
• It has different easy manners to represent the statistical results in graphical methods, and the ability to store these graphs on the disk.
• Ability to automate analyses and create new functions (R is programming language), and extend the existing language features.
• Users don’t need to reload their data every time because the system saves the data between the sessions, and save the history of their commands.
• If you prefer GUI, there are many free GUI for R like:
• RStudio • R Commander • StatET
• ESS • JGR Java GUI for R
• It is available for all platforms Windows, Macintosh, and Linux.
For all these features; data scientists had found that R language provides a large various tools for all statistical, machine learning (linear and nonlinear modeling, classic statistical tests, time-series analysis, classification, clustering) and graphical techniques, and is massively extensible. R has various built-in as well as extended functions for statistical, machine learning, and visualization tasks such as:
•Data extraction • Data cleaning • Data loading
•Data transformation • Statistical analysis
• Data
visualization
•Predictive modeling SAS
SAS software (with its language) is a famous and common solution for accessing, transformation and reporting data by using its flexible, extensible and web-based interface [7]. The SAS Analytics Platform consists of many analytical applications which form this application framework and make it very useful tool for all data scientists in most of their tasks [8]. The main useful analytical applications are the following:
oNormal local text files.
oRetrieved text from SAS data sets or other external databases.
oFiles on the Web.
SAS Text Miner 14.1 includes many nodes that you are able to use in your text mining analysis; these nodes are [9]:
• Text Import node • Text Parsing node
• Text Filter node • Text Topic node
• Text Cluster node • Text Rule Builder node
• SAS Forecast Server: its automation and scalability enable organizations to take more efficient and effective decisions for their future and able them to generate large quantities of high-quality forecasts quickly and automatically. This tool increases the efficiency of forecasts which produced by enterprises for a board range of regular problems (planning challenges) and allows forecasters to distinguish the most important forecasts and focus their efforts on them [10].
• SAS Model Manager: it arranges and organizes the steps of building analytical model collections, starting from creating, through managing and monitoring, and ending with administering [11]. SAS Model Manager provides the decision makers with a web-based environment which facilitate their job with a perfect managed tools and support lifecycle management and governance of models, whether while choosing and identifying, in development process, the priorities of the models to deployment or even when managers want to ensure that all current new conditions are reflected in the models after updating.
MS SQL SERVER
MS SQL Server is a very famous solution for traditional relational database, and has a very good tools for drawing ERDs and also for optimizing queries by using graphical tool which explain how MS SQL do this task (query) and the steps of this task.
But till MS SQL Server 2012, there were a lot of rumors about Microsoft that it's not interest in business intelligent (BI). Then, in 2012 version of MS SQL Server, Microsoft surprises all the data analysts with its ecosystem, because they had found that BI concepts had been covered as set of distributed features across several products, and BI was not just a single product in Microsoft Ecosystem.
On the other hand, MS SQL Server has an integrated Analysis Service 2012, which has a very big relation with Tabular Model, Multidimensional Model, and the Microsoft BI stack. There are also three main services for business intelligence in MS SQL Server 2012:
• SQL Server Integration Service (SSIS) for collecting the data.
• SQL Server Analysis Service (SSAS) for analyzing the data.
• SQL Server Representation Service (SSRS) for viewing
the data (visualizing it).
And to build the bridge between the non-relational and relational data management worlds, Microsoft SQL Server has built the connector for Apache Hadoop (SQL Server-Hadoop connector) which is a Sqoop-based connector; the main purpose of designing this connector is to provide an efficient tool to transfer data between SQL Server and Hadoop [12].
Now, it is obvious that MS SQL Server 2012 packages provide the data scientists with full tools for data integration, visualization solutions, a rich Business Intelligence suite, and the ability to connect with Apache Hadoop and Hive through an efficient connector.
Low Level
Sometimes the high-level data science platform is not enough for a particular analytics task, and data scientists need to go to a lower level statistics / programming language (Low level in analytical tasks). Especially when they find that the code in these high-level languages is almost slower than code written in a compiled language like Java or C++, for that when data scientists need highly concurrent, multithreaded applications and applications with many CPU-bound threads they build and create their own solutions depending on these low-level languages.
Statistical Solutions
There are many statistical solutions like SPSS, STATA, MiniTab, Statistica...Etc. But statisticians have to differentiate between these solutions through some feature which make it easy to decide what the best choice for their own usage is?
STATA is very strong solution but it’s not easy for non-statistical user to work with, for that we focus in this part on the most famous solution which is SPSS because it is easy to use and even non-statistical users are able to use it.
SPSS
This software stand for Statistical Package for the Social Sciences (SPSS), and data analysts are able to make a suitable and convenient decision, solve problems and increase our benefits depending on our predictive results by using SPSS predictive analytics software, on our data, to know what will happen next.
The current version of this software called "IBM SPSS Statistics ", and the full version (not student version) of this system consists of all next features and add-ons [13]:
•Statistics Base •Advanced Statistics
•Bootstrapping •Exact Tests
•Categories •Complex Samples
•Conjoint •Direct Marketing
•Custom Tables •Data Preparation
•Decision Trees •Forecasting
•Exact Tests •Missing Values
•Neural Networks •Regression
Table 2: SPSS VS STATA VS MiniTab VS Statistica
Features SPSS [13], [14] STATA [15] MiniTab [16], [17 Statistica
Usage • Easy-to-use by menus
• Non-statisticians are able to use it easily.
• Easy-to-use by command or menus.
• Some tasks need code.
• Needs strong statistical experience.
• Needs statistical experience, but it offers some help by Assistant menu.
• Needs strong statistical experience.
Learn Very easy to learn. Needs longer than SPSS. Not easy to learn Not easy to learn Operating
System
Windows, Mac OS, Linux.
Windows, Mac OS, Linux. Windows. Windows.
Scripting languages
R, Python, SaxBasic. ado, Mata R, Statistica Visual Basic (SVB)
ANOVA All Kind All Kind (One-way, Two-way, MANOVA, GLM, Mixed model, Post-hoc, Latin squares)
All Kind except Mixed model
All Kind except Mixed model
Regression OLS, WLS, 2SLS, NLLS, Logistic, GLM, Stepwise.
OLS, WLS, 2SLS, NLLS, Logistic, GLM, LAD, Stepwise, Quantile, Probit, Cox, Poisson, MLR.
OLS, WLS, NLLS, Logistic, Stepwise.
OLS, WLS, 2SLS, NLLS, Logistic, GLM, LAD, Stepwise, Probit, Cox, Poisson, MLR. Time series
analysis
ARIMA ARIMA, GARCH, Unit root test, Cointegration test, VAR, Multivariate, GARCH
ARIMA ARIMA
Visualization Tools
To visualize the results and observations; data scientists can use any software or program from the previous explained solutions which has visualization package, like Python, R, SAS, Julia or MATLAB. But there are some other solutions (software) which are focusing specially on visualization, and become very professional in this field, like Tableau, Qlikview, Spotfire, Congos, D3, Protovis...Etc.
This section demonstrates famous solution Tableau for general visualization purpose and D3 for web visualization.
Tableau
By using this software you can visualize any kind of data with the most perfect manner to do that. Really Tableau Public is wonderful, surprising and effective tool to draw a simple plot with an extraordinary easiest way (comparing with any competitor product) or even combined complex joint collected plots together in one frame with full control on this frame through filtering or customization mechanism [1].
New feature is available starting from Tableau 8.1; this
feature is R integration, that because R becomes the most common and powerful software is used by data scientists. This feature offers next capabilities:
• Tableau users are able to access the rich and huge collections of data analysis libraries in R.
• No needs for Tableau users to learn R language in details, they can include R command in any of the four functions which are offered from Tableau side and use the result of this function to build great graph by using Tableau again.
• R users are able to use the data exploration experience in Tableau by applying it on their own R code.
D3 (Data-Driven Documents)
[image:4.595.29.574.579.696.2]For web visualization purpose Data-Driven Documents (D3) is the best choice for handle this task. D3 use a specific toolkit for hiding the underlying scenegraph, also it enables manipulation of DOM (the standard Document Object Model). It’s an integrated solution with developer tools.
Table 3: Tableau VS Qlikview VS Spotfire Comparison
Features Tableau [18], [19] Qlikview [20], [21] Spotfire
Implementation Speed High Above average Good
Data Integration Excellent Good Good
Modeling and Analytics Excellent Good Excellent
Multidimensional Cubes Good None Average
Mapping Best Average Good
Power Pivot Support Good None None
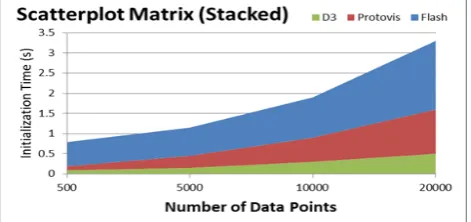
Figure 1: Comparison between D3, Protovis and Flash
ANALYSISANDDISCUSSION
In Table 2 a comparison between SPSS, STATA, MiniTab, and Statistica has been made, by focusing on their features (Usage, Learn, … ), and this comparison shows that STATA is the best statistical software between them, but it is not easy to use for non-statistician users because it needs very good knowledge and strong background in statistical concepts, for that almost new users prefer SPSS than other statistical software.
For famous professional visualization solutions (Tableau, Qlikview, and Spotfire), a comparison between their features - in implementation speed, data integration, and others – has been made in Table3 to proof that Tableau is
the best between them when the user (data analysis, data scientists) focus on graphs, charts, maps, … etc.
The benchmarking comparison (initialization time, page loading, visualization view) between D3 and some other web visualization tools (Protovis, Flash) confirms that D3 faster twice than Protovis and over three times than Flash, this is appeared in Figure1 [22].
Table 4: The Percentage of Analytical Tools Usage
Table 5: Python VS R Comparison
Features Python R
Libraries NumPy, SciPy, Pandas, Matplotlib, Scikit Learn, etc.
Over 7500 libraries for many domains.
Compiler Interpreted language Interpreted language Learning Suitable to learn. Harder to learn. IDE PyCharm, Spyder, Anaconda RStudio, Red-R
Speed Slow Comparing with R Fast especially after new computation algorithms. Visualization There are a lot of libraries, like Pandas, ggplot
..etc, but R better in this side.
R has an incredible ggplot2 package, ggvis, rgl, htmlwidgets, and googleVis.
According to KDnuggets poll (2014) when they compared the percentage of data scientists usage of all analytical tools and software, they found that the four main languages for Analytics, Data Mining, and Data Science were R, SAS, Python, and SQL , and the ratio of usage is represented in Table 4.
These percentages appear that almost SAS users use neither R language nor Python in their research, while the combination between R and Python for data analysts is better.
Also the combination between these three tools (R, Python and SQL Server) is better than other set of tools (R, Python and SAS).
Although, R and Python are similar programming languages, but there are some differences, next comparison table (Table 5) mentions the features of these languages from many faces:
Through all these comparison it is easy to observe that R language is better choice than others. But we should mention here that other tools sometimes better for non-professional users or who don’t has programming background.
In next table (Table 6); comparison between R, SPSS, and SAS are made:
CONCLUSION
[image:5.595.317.546.163.335.2]Table 6: R VS SPSS VS SAS Comparison
Features R SPSS SAS
Year released 1995 1968 1972
Cost It’s open source It’s not free. It’s an expensive solution. Language Kind R is really a programming
language with great data manipulation, statistics, and graphics functionality built in.
SPSS has Syntax and Scripts. SAS is halfway in between a real programming language and script language.
Usage • Used in academic and research for a long time
• It is used for commercial application purpose but not from long time.
• R has advance graphical capabilities
• Latest techniques are developed and released quickly.
• Main role in social science
• Great tool for non-statisticians
• Easy-to-use drop down menus
• SPSS tables can relatively easily be transported to Word Documents or Excel sheets for further analysis / presentation.
• In commercial analytics space it has a very strong leading position.
• It has a large amount of high quality code for many kinds of purposes.
• It has a strong data handling capabilities.
Learn • It’s not easy to learn.
• It has a large and supportive community
• There are high quality introductory tutorials.
• User friendly interface
• Very easy to learn
• Its biggest advantage is its similarities to Excel which we are familiar to work with.
• It’s easy to understand and get the basics in SAS, but it needs more time to become really good.
• Many official and unofficial tutorials are available for SAS.
REFERENCES
[1] T. Siddiqui and M. Al Kadri, “Big data analytics on the cloud”, 2015, International Journal of Emerging Technologies in Computational and Applied Sciences (IJETCAS), pp. 61–66.
[2] C. L. P. Chen and C. Zhang, “Data-intensive applications, challenges, techniques and technologies : a survey on big data”, vol. 275, 2014, Information Sciences, pp. 314–347. [3] F. Pedregosa, G. Varoquax, A. Gramfort, V. Michel, B.
Thirion, O. Grisel, M. Blondel, P. Prettenhofer, R. Weiss, V. Dubourg, and M. Brucher, “Scikit-learn: machine learning in python”, vol. 12, 2011, Journal of Machine Learning Research, pp. 2825–2830.
[4] W. McKinney, “Python for data analysis”,1st ed., 2013, O’Reilly Media Inc., pp.453.
[5] D. Rotolo and L.Leydesdorff, “Matching medline / pubmed data with web of science: a routine in r language”, vol. 66, no. 10, 2015, Journal of the Association for Information Science and Technology, pp. 2155–2159.
[6] N. Matloff, “Art of r programming”, 1st ed., 2011, No Starch Press, Inc., pp.373.
[7] D. Toomey, “R for Data Science”, 1st ed., 2014, Packt Publishing, pp.347.
[8] D. Gervais, E.Derclaye “The scope of computer program protection after sas : are we closer to answers ?”, vol. 34,2012, European Intellectual Property Review, pp. 565– 572.
[9] SAS Institute Inc., “SAS 9.4 intelligence platform: data administration guide”, 5th ed., 2015, SAS Institute Inc., pp.407.
[10] SAS Institute Inc., “Getting Started with SAS Enterprise Miner™ 14.1”,1st ed., 2015, SAS Institute Inc., pp.94. [11] SAS Institute Inc., “SAS Forecast Server”, 1st ed., 2015,
SAS Institute Inc., pp4.
[12] SAS Institute Inc., “SAS ® Model Manager”, 1st ed., 2015, SAS Institute Inc., pp4.
[14] IBM, “IBM spss statistics 21 brief guide”, 1st ed., 2012, IBM Corp., pp.158.
[15] K. McCormick and J. Salcedo, “Spss statistics for dummies”, 3rd ed., 2015, John Wiley & Sons, Inc., pp.370.
[16] StataCorp, “Stata user’s guide”, 1st ed., 2013, Stata Press, pp.409.
[17] I. Newton, “Minitab cookbook”, 1st ed., 2014, Packt Publishing, pp.321.
[18] R. M. Khan, “Problem solving and data analysis using minitab. a clear and easy guide”, 1st ed., 2013, John Wiley & Sons, Inc., pp.469.
[19] A. Ohmann and M. Floyd, “Creating data stories with tableau public”, 1st ed., 2015, Packt Publishing, pp.195. [20] J. Stirrup, “Tableau dashboard cookbook”, 1st ed., 2014,
Packt Publishing, pp.322.
[21] S. Redmond, “QlikView for developers cookbook”, 1st ed., 2013, Packt Publishing, pp.272.
[22] M. García and B. Harmsen, “QlikView 11 for developers”, 1st ed., 2012, Packt Publishing, pp.504.
[23] M. Bostock, V. Ogievetsky, and J. Heer, “D3 : data-driven documents”, vol. 17, no. 12, 2011, IEEE Transactions on Visualization and Computer Graphics, pp. 2301–2309.
AUTHOR’S PROFILE
Muslim University (AMU). She has performed different administrative responsibilities apart from teaching and research. She has rich no of publications in well reputed indexed international journals. She also contributed as reviewer, Editor, keynote Speaker etc.
Mohammad AlKadri Obtained his B.Sc. (Maths) from Damascus University, Syria and MSc(IT) from Jamia Hamdard, India. He is currently a Ph.D. student at Aligarh Muslim University, Aligarh, Uttar Pradesh. He has rich 12 years working and teaching experience which includes Central Bureau of Statistics (Syria), University of Al-Jouf (KSA), Damascus University (Syria) and many private companies in Syria.