International Journal of Advanced Research in Computer Science
RESEARCH PAPER
Available Online at www.ijarcs.info
Split/Merge and Chromosome Encoding Model of Genetic Algorithm For Image
Segmentation & Optimization
Mansoor Farooq
School of Science & Technology/Department of Computer Science Shri Venkatashwara University
U.P, 244236, India
Abstract The present paper focuses on image segmentation by the implementation of the split/merge approach which involves k-means clustering algorithm and proficient chromosome encoding model of Genetic Algorithm for merging. The input for a segmentation algorithm is an image that is converted to a gray-level intensity image through the preprocessing techniques and optimized according to some predefined quality measures. In order to optimize the image, an evolutionary computation algorithm is utilized.
Keywords: Image Segmentation, Genetic Optimization, Genetic Algorithm, K-means Clustering Algorithm and Split/Merge approach
I. INTRODUCTION
Image segmentation is a fundamental method for object recognition in any image. Many different algorithms for image segmentation have been generated. However, it is still difficult to judge which algorithm results in a better segmentation outcome compared to the others. Image segmentation approaches are used for partitioning an image into sets of homogeneous pixels [1] where each set is known as a region corresponding to a real object. It is fruitful to mention that in a segmented image, the adjacent regions cannot be homogeneous [2]. Objects of an image can be distinguished from their background by using a successful segmentation algorithm. In each region, pixels are similar to each other with respect to some feature such as intensity, color or texture of the image [3]. Image segmentation techniques can be categorized into four main groups: clustering-based methods, edge-based approaches, region-based approaches and split/ merge approaches [1]. Edge-based image segmentation can be done by means of two main techniques; canny edge detection which is based on a predefined threshold value and evolutionary edge detection methods [4]. Region-based approaches can be categorized to Region Growing [5], [6], [7]; Watersheds [8], [8], [9]; and Pyramidal [11]. For split/merge group of algorithms, there are four split approaches; Pyramidal Segmentation [11]; Watersheds [8], [8], [9]; FCM [12] and K-means [12]. In merge process, Region Adjacency Graph (RAG) [13] and Nearest Neighbor Graph [8] representations are two widely used and offered structures. Moreover, there are two clustering-based approaches, namely: the Fuzzy-C-Means [12], [14], [15] and K-Means clustering algorithms [12]. A variety of experiments, researches and papers have been developed on image segmentation process from different aspects such as active counter worked out by Isard and Blake et al in “1998”, snake methods introduced by Kass et al in “1988” and shortest path methods carried out by Mortensen and Barrett in “1998”. In “1999” Suchendra M. Bhandarkar and Hui Zhang [3], studied the image segmentation using metaheuristics. Three categories of hybrid stochastic optimization approaches were used to minimize an objective function. The first component of their hybrid approaches is one of a simulated annealing (SA) [14]; random cost algorithm (RCA) [15], [18]; and micro-canonical annealing (MCA) [19], which are the subcategory of stochastic hill-climbing search techniques, and they can be characterized by their ability to get away from local optima in the solution space. The second component is taken as the
genetic algorithms. Their search procedures employ a combination of the building blocks property of the genetic algorithms and hill-climbing techniques to take advantages from both methods.
II.GENETICOPTIMIZATIONFORIMAGE SEGMENTATION
In computer vision, Segmentation is the method of dividing an image into several meaningful regions for applications such as objects tracking and understanding [20]. The aim of segmentation is to simplify and modify the demonstration of an image into something that is more significant and easier to investigate [1]. As it is mentioned, there are several segmentation methods, such as Edge-based, Region-based, Clustering-based methods and Split/merge approaches [1].
Region-Based Methods
The input image is separated into several allied regions by grouping the adjacent pixels of close intensity levels [1]. The goal is the recognition of regions that satisfy certain predefined homogeneity criteria. Neighboring regions are further grouped due to their homogeneity or sharpness of region boundaries.
Edge-Based Methods
Edge-based methods of image segmentation are based on edge detection which is a well-expanded field in image processing. As there is often a sharp variation in intensity of the object boundaries, these boundaries can be considered as the edges. However, closed region boundaries must be determined to detect image objects and the detected edges are the boundaries between objects [21]. In this approach, image edges are recognized and then linked into lines that indicate the borders of image objects [26]. Edge detection algorithms are sometimes discontinuous. In order to solve this problem several evolutionary algorithms have been proposed for detecting well-localized and continuous thin edges based on optimization of edge configurations [4].
Split/Merge Approaches
advance [1]. Then, analogous neighboring regions are combined according to certain homogeneity features. As a result, Region Adjacency Graph (RAG) is proposed to determine neighboring regions [3]. After each merge procedure‟s iteration, RAG must be updated to represent the new regions and their 88eighbours correctly.
Clustering Based Methods
The entire pixels of an image are sorted in a histogram according to their intensity values [1]. Then, a predefined number of clusters will be defined to split the intensity histogram into several intervals [22]. In this unsupervised region segmentation algorithm, pixels which are located at the same cluster may not be adjacent. Therefore, the number of regions is not the same as the number of clusters [1]. There are several clustering based methods such as K-means clustering and fuzzy-c-means (FCM). In this study, K-means algorithm is used.
Genetic Algorithms
Genetic Algorithms (GA) are stochastic search procedures introduced by J.Holland in the 70‟s [23]. These algorithms are based on ideas and techniques from genetic and evolutionary theory which is a field of artificial intelligence and is a kind of searching for better solutions that mimics the process of natural evolution [24], [23], [25]. Gas generate valuable solutions for hard optimization problems using techniques that are inspired by natural evolutionary operators, such as inheritance, mutation, selection, and crossover [3].
Fitness Function
To produce better solutions from the current one, there should be a fitness function to evaluate the quality of each encoded solution through the generations. The form of the fitness function is always a problem-dependent issue [26]. Fitness value is a quality measurement of each solution. Better fitness values belong to better individuals in each population.
Initialization of the Population
Usually, the population size involves hundreds or thousands of probable solutions. Subsequent to generate first population and define fitness function, a new population is produced through the mutation, crossover, inversion and selection operators.
Selection Procedure
An important procedure during GA generations is how to select individuals from the current population and use them to generate next population. Selection operation directly depends on the individual quality. The quality of each individual is measured by a fitness function. Individuals with better fitness value are more likely to be selected [3].
Reproduction Process
Reproduction methods are biologically inspired and based on the use of two parents to produce a child. To produce each new child, two individuals (parents) are selected from the current generation to reproduce new individuals for the next generation through the crossover operation and/or mutation. Inherently, a generated child shares many characteristics of its parent through the swapping of some genes between parents. Therefore, the new child takes advantage from both parents and might be better in comparison to the previous individuals. Reproduction process will be terminated when the size of the new population is equal to the size of the last population.
Crossover
Crossover is a significant way to mate two parents for the production of a new child (offspring). Two individuals are selected through the selection operation and then used as two parents [27]. In crossover operation, random numbers of genes are swapped between parents. The main advantage of this operation is that the generated child is better than its parents if it takes the best properties from its parents.
Mutation
Mutation can be takes place after the crossover get performed. This is to prevent falling all solutions in population into a local optimum of solved problem. The mutation depends on the encoding as well as the crossover. For example when we are encoding permutations, mutation could be exchanging two genes. Mutation changes the new offspring randomly. For binary encoding we can switch a few randomly chosen bits from 1 to 0 or from 0 to 1. Mutation can then be following [5]: Original offspring 1- 1101111010011110
Mutated offspring 1- 1100111010011110 Original offspring 2- 1101100100110110 Mutated offspring 2- 1101101100110110
Termination Conditions
GAs have a repetitive procedure until the termination condition is reached. Some of the necessary termination conditions are mentioned as follows [24]:
Reach to a solution which has the predefined reasonable fitness value.
Reach to the maximum number of generations. Reach to a predefined allocated budget (computation time/money).
Combinations of the above.
III.PROPOSEDAPPROACHAND IMPLEMENTATION
The presented evolutionary image segmentation approach consists of three phases: preprocessing filters split procedure and merge procedure using genetic optimization. In the first step of our segmentation approach, original input image should be transformed into a gray-level intensity image.
Preprocessing phase includes the following steps:
1. To convert the original input image into a gray-level intensity image:
Gray_Image= rgb2gray(Original_Image);
2. To reduce the level of noise in the gray-level intensity image:
Gray_Image=medfilt2 (Gray_Image, [3 3]); G=fspecial(„gaussian‟,[5 5],2);
Gray_Image =
imfilter(Gray_Image,G,‟symmetric‟,‟conv‟); 3. To enhance the dissimilarity of the edge pixels:
h=fspecial(„unsharp‟);
Enhanced_Image=imfilter(Gray_Image,h);
Enhanced_Image =imfilter(Gray_Image,h,‟replicate‟); Imshow(Enhanced_Image);
1. To cluster pixels of the image by K-means clustering algorithm.
2. To identify different regions using connected component neighbour.
3. To determine region neighbours by means of the Region Adjacency Graph (RAG).
4. Removal of small regions in order to prevent over-segmentation.
K-means Clustering Algorithm
K-means is an applicable method to divide the image pixels into a variety of clusters based on histogram technique which is a representation of number of pixels in each intensity level [36].
The split process consists of the following steps based on the K-means clustering algorithm.
Step 1: choose K numbers of initial values for an image with 256 gray levels.
Step 2: choose pixel as a member of cluster if the distance between this pixel and the center of cluster is smaller than the distance between other clusters‟ center
Where xg is the intensity value of pixel
Step 3: recalculate the cluster center vk for all clusters ck
Where s is a member of ck , xg is the gray value of pixel s and | ck| is the number of members in ck .
Step 4: Termination condition is reached when the entire cluster centers vk remain constant. Otherwise, go back to the step 2.
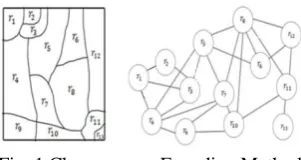
Region Adjacency Graph
[image:3.595.366.502.281.326.2]Region adjacency graph (RAG) with (g = {y, E} ) is defined as a set of nodes (y) and a set of arcs (E ) in which, every node represents a separated region and the arcs between a couple of nodes indicate the adjacency between these two regions. An example of RAG for an initial segmented image is illustrated
Fig. 1 Chromosome Encoding Method
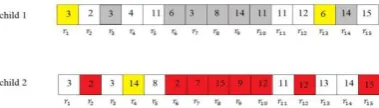
A chromosome encoding method is used to represent a segmented image. Each gene of the chromosome indicates a separated region of the image. Assume that the segmented image has R regions (r1, r2, r3,…….rR), let the chromosome α = α1, α2,….., αN be an integer string, which represents the number of genes. The length of the chromosome (number of genes) is equal to the number of regions in segmented image.
In our study, chromosome structure is illustrated in Figure 2 each gene is defined as an agent of each region and denoted by region label rR.
Fig. 2 Chromosome Encoding Model
Population Generation
To generate an initial population of chromosomes, a few number of genes is selected from the initial chromosome randomly and If the merging conditions are satisfied, these selected regions will be merged with one of their neighbors. Consequently, the other chromosomes (individuals) will be generated.
[image:3.595.87.238.583.663.2]In each chromosome, αi = i for i = 1, 2, ….., N means region i should be reserved and αi = j means region i is removed by merging with region j . For instance, Figure represents that α3 = 4, which means r3 is merged with its best neighbor (r4).
Fig. 3 Initial Individual Structure
Additionally, this chromosome represents that regions 5 and 8 are merged with region 11 and 23, respectively. Other individuals are generated by repeating this merge approach.
Neighbor Selection for Merge Procedure
To decide which neighbor is the best one to merge, dissimilarity distances must be compared between a region and all of its neighbors. In this study, the dissimilarity distance is based on the region variance. If the variances of two adjacent regions are close, then they are candidates for merging. Therefore, variance distances should be calculated between a region and all of its neighbors. For example, a neighbor with lower variance distance r3 to is selected as a candidate region to be merged with region r3. As it is shown in Figure 3 region r3 is to be merged with its single candidate neighbor that is r4 .
Dissimilarity Distance Computation
Dissimilarity distance is calculated by measuring the Euclidean distance between variances of one region and all of its neighbors. In this approach, Euclidean distance has been computed in the scale of regions variance. As a result of the K-means clustering algorithm, each region involves a number of connected pixels (x ), with similar gray level intensity ( g). To compute distance between two adjacent regions, Euclidean distance of variances is denoted
Description of the merge procedure is shown by the following algorithm
Through the crossover operation, a fixed interval with a random selected start point is defined as the crossover interval. The length of crossover interval depends on the number of separated regions in the segmented image. The entire genes of the crossover interval will be swapped between two parents, hence generating two offspring. This transformation manipulates the feasibility of the both chromosomes. Therefore, in order to sustain the feasibility, genes with the wrong value should be updated. If the crossover segment of a parent chromosome includes some merged regions with the other regions out of the crossover interval, then existence of a relation between these regions will be approved. This relation must be maintained through the crossover operation Then those genes which are out of crossover interval and depending on crossover interval must be updated by means of applying the relation between gens.
Mutation Operation
[image:4.595.51.241.415.469.2]In our representation, mutation operation causes to change the region label into one of its neighbors. In this method, random numbers of genes (regions) are selected from the offspring. The selected regions are going to be merged with one of the adjacent neighbors as an extra merge procedure. As a result of this method, in order to produce one uniform region, the boundaries between two merged regions will be removed. For example, two regions ( r1 and r13 ) from offspring 1, are selected for mutation operation and then merged with r3 and r6, respectively. Besides, region r4 from offspring 2 is merged with region r14 . A representation of mutation operator is illustrated in Figure 4.
Fig. 4 Results of the Mutation Operation
IV.CONCLUSION
In this paper, we have developed a split/merge image segmentation approach with an evolutionary combinatorial optimization method. This approach for optimized image segmentation employs a K-means clustering algorithm in split process and an intelligent genetic algorithm with efficient chromosome encoding model in merge process. Well-organized chromosome encoding is defined to represent detected regions and a two-point crossover model is applied on chromosomes to produce new generations. GOIS can simultaneously gain the following five objectives: (1) detected edges are always continuous; (2) final detected regions can indicate significant objects from the image; (3) short computation time; (4) this method is practical with acceptable performance for noisy images; (5) high accuracy in comparison with other segmentation methods. Elevated performance of GOIS is shown in terms of assessment performance and computation time compared to some well-known segmentation methods. It is also illustrated that GOIS can be applied on various nature images with different characteristics and produced robust and efficient results.
V. REFERENCES
[1]. S. Ying Ho, K. Zheng Lee, "Design and Analysis of an Efficient Evolutionary Image Segmentation Algorithm," Journal of VLSI Signal Processing, vol. 35, pp. 29-42, 2003. [2]. K. S. Fu, J. K. Mei, "A survey on Image Segmentation," Pattern Recognition, vol. 13, pp. 3-16, 1981.
[3]. S.M. Bhandarkar, H. Zhang, "Image Segmentation Using Evolutionary Computation," Transaction on Evolutionary Computation, vol. 3, no. 1, pp. 1-21, 1999.
[4]. M. Gudmundsson, E. A. El-Kwae, M. R. Kabuka, "Edge Detection in Medical Images Using A Genetic Algorithm," Medical Images, vol. 17, no. 3, pp. 469-474, 1998.
[5]. Y. L. Chang, X. Li, "Adaptive Image Region-Growing," Transaction on Image Processing, vol. 3, no. 6, pp. 868-872, 1994.
[6.] R. Adams, L. Bischof, "Seeded Region growing," Transaction on Pattern Analysis and Maching Intelligence, vol. 16, no. 6, pp. 641-647, 1994.
[7] S. A. Hojjatoleslami, J. Kittler, "Region Growing: A New Approach," Transactions on Image Processing, vol. 7, no. 7, pp. 1079-1084, 1998.
[8.] K. Haris, S. N. Efstratiadis, N. Maglaveras, A. K. Katsaggelos, "Hybrid Image Segmentation Using Watersheds and Fast Region Merging," Transaction On Image Processing, vol. 7, no. 12, pp. 1684-1699, 1998.
[9] A. Tremeau, P. Colantoni, "Regions Adjacency Graph Applied to Color Image Segmentation," Transaction On Image Processing, vol. 9, no. 4, pp. 735-744, 2000.
[11] M. R. Rezaee, P. M. J. Vanderzwet, B. P. F. Lelieveldt, R. j. Vandergeest, J. H. C. Reiber, "A multiresolution Image Segmentation Technique Based on Pyramidal Segmentation and Fazzy Clustering," Transaction On Image Processing, vol. 9, no. 7, pp. 1238-1248, 2000. [12] D. N. Chun, H. S. Yang, "Robust Image Segmentation Using Genetic Algorithm with A Fuzzy Measure," Pattern Recognition, vol. 29, no. 7, pp. 1195-1211, 1996.
[13] T. N. Pappas, "An Adaptive Clustering Algorithm for Image Segmentation," Transaction On signal Processing, vol. 40, no. 4, pp. 901-914, 1992.
[14] Y. A. Tolias, S. M. Panas, "Image Segmentation by A Fuzzy Clustering Algorithm Using Adaptive Spatially Constrained Membership Functions," Transaction on Systems, Man and Cybernetics, vol. 28, no. 3, pp. 359-369, 1998. [15] Bezdek, J. C., "Pattern Recognition with Fuzzy Objective Function Algorithm," in Plenum press, newyork, 1981.
[16] S. Kirkaptrick, C. Gelatt, Jr., M. Vecchi, "Optimization by Simulated Annealing," vol. 220, no. 4598, pp. 498-516, May 1983.
[17] B. A. Berg, "Locating Global Minima in Optimization problems by A Random-Cost Approach," vol. 361, pp. 708-710, 1993.
[18] Y. Wang, R. A. Prade, J. Griffith, W.E. Timberlake, J. Arnold, "A Fast Random Cost Algorithm for Phisical Mapping," vol. 91, pp. 11094-11098, 1994.
[19] M. Creutz, "Microcanonical Monte Carlo
Simulation," vol. 50, no. 19, pp. 1411-1414, 1983.
[21] R. C. Gonzalez, R. E. Woods, "Real-time Digital Image Enhancement," Digital Image Processing, vol. 69, no. 5, 1981.
[22] A. Albiol, L. Torres, E.J. Delp, "An Unsupervised Color Image Segmentation Algorithm for Face Detection Applications," in Image Processing, 2001.
[23] J. H. Holland, Adaptation in Natural and Artificial Systems., M. P. B. Books, Ed., London, 1998.
[24] D. Goldberg, Genetic Algorithm in Search, MA: Addition-Wesley, 1989.
[25] M. Mitchell, An Introduction to Genetic Algorithms, MA: MIT Press, 1996.
[26] Y. J. Zhang, "A Survey on Evolutionary Methods for Image Segmentation," Pattern Recognition, vol. 29, no. 8, pp. 1335-1346, 1996.