ABSTRACT
FISCHER, WILLIAM KEVIN. Effect Of Percentage Baghouse Fines On The Amount Of Antistripping Agent Required To Control Moisture Sensitivity. (Under the Direction of Dr. Akhtarhusein A. Tayebali)
Moisture damage in asphalt pavement reduces the service life of the pavement as well as increases permanent deformation. Moisture sensitivity in asphalt concrete mixtures is often associated with high concentrations of fine aggregate particles. In this study, the effects of baghouse fines, a source of fine mineral aggregate, on moisture sensitivity were examined. Two types of baghouse fines with different gradations were used in various concentrations in the laboratory production of hot-mix-asphalt samples. To determine the effects of the various baghouse fines contents, testing was performed to determine the tensile-strength-ratio of the different mixes.
To assess the rutting resistance of the various asphalt mixtures, an Asphalt Pavement Analyzer test was performed. Half of the laboratory compacted specimens were moisture conditioned and tested submerged, while the other half was tested dry. Results indicate an increase in rut depth with the removal of anti-strip additive from the mix, indicating the effectiveness of the additive in preventing moisture damage.
Finally the specimens were tested in the Superpave Shear Test Machine. Frequency Sweep and Repeated Shear tests were performed for each mixture with half of the samples again conditioned. The Frequency Sweep test measures the shear modulus and phase angle over a number of frequencies. The results of this test showed that the average shear modulus declined with moisture conditioning for each mix. The Repeated Shear test subjects the specimen to repeated loading and measures the accumulated plastic strain over a number of cycles, which can be used to determine rutting resistance. The results of this test corresponded with the Asphalt Pavement Analyzer results, with the rutting resistance decreasing with the removal of anti-strip additive.
Based on these results, it was concluded that a large concentration of baghouse fines can increase moisture sensitivity in asphalt pavement. It was also determined that the LOF 6500 anti-strip additive, in the 0.5 percent concentration, was sufficient to
EFFECT OF PERCENTAGE BAGHOUSE FINES ON THE AMOUNT
OF ANTISTRIPPING AGENT REQUIRED TO CONTROL
MOISTURE SENSITIVITY
by
William Kevin Fischer
A thesis submitted to the Graduate Faculty of North Carolina State University
in partial fulfillment of the requirements for the Degree of
Master of Science
CIVIL ENGINEERING
Raleigh, North Carolina 2002
APPROVED BY:
_________________________ _________________________
(Dr. James Nau) (Dr. Tasnim Hassan)
_________________________ (Dr. Akhtarhusein A. Tayebali)
PERSONAL BIOGRAPHY
The author was born in Fairfax, Virginia on September 4, 1977 to Jeff and Diane Fischer. One year later a brother, Todd, was born. After twelve years in Northern Virginia the Fischer family moved to Kill Devil Hills, North Carolina. Five years later Kevin graduated from Manteo High School in 1995.
ACKNOWLEDGEMENTS
The author would like to thank his advisor and committee chairman, Dr. Akhtar Tayebali for the guidance and direction given during this study.
Special thanks are due to Dr. James Nau and Dr. Tasnim Hassan for their review of this thesis as members of the committee.
The author extends his sincere appreciation to the authorities of the North Carolina Department of Transportation (NCDOT) for funding this project as well as performing laboratory tests. Thanks to Mr. Chris Bacchi, who was instrumental in coordinating the testing at NCDOT Materials and Testing Unit.
Thanks are also due to Mr. Moreshwar Kulkarni for the help and guidance he has provided throughout this project.
TABLE OF CONTENTS
Page No.
LIST OF TABLES ...vii
LIST OF FIGURES...ix
NOTATIONS ...xi
1. BACKGROUND...1
1.1 Introduction ...1
1.2 Objectives and Scope ...2
1.3 Significance ...3
2. LITERATURE REVIEW...5
2.1 Definition of Baghouse Fines...5
2.1.1 Fines Collection Systems ...5
2.1.2 Variability of Baghouse Fines ...7
2.1.3 Recycling of Baghouse Fines ...8
2.2 Definition of Mineral Filler ...8
2.3 Effects of Baghouse Fines ...10
2.3.1 Asphalt Cement- Fines Interaction...10
2.3.2 Influence on Mixture Properties...12
2.4 Moisture Sensitivity in HMA ...13
2.4.1 Adhesion and Cohesion Loss ...14
2.4.2 Moisture Sensitivity Testing...15
2.5 Prevention of Moisture Damage...16
2.5.1 Types of Anti-Strip Additives ...16
2.5.2 Studies of Additive Effectiveness ...17
3. RESEARCH APPROACH AND METHODOLOGY ...19
3.2 Research Tasks ...19
3.2.1 Selection of Materials and Job-Mix Formula...19
3.2.2 Moisture Susceptibility Testing...20
3.2.3 Asphalt Pavement Analyzer Testing ...20
3.2.4 Specimen Shear Testing ...20
3.3 Selection of Test Temperature...21
3.4 Specimen Nomenclature...22
4. EVALUATION OF MATERIAL AND JOB-MIX-FORMULA...25
4.1 Introduction ...25
4.2 Baghouse Fines...25
4.3 Evaluation and Revision of JMF ...26
4.3.1 Gradation Analysis ...26
4.3.2 Evaluation of Volumetric Properties ...27
4.3.3 Batching Adjustment for Various Fine Contents ...28
5. MOISTURE SUSCEPTIBILITY TESTING ...33
5.1 Introduction ...33
5.2 Moisture Sensitivity Testing...33
5.2.1 Test Method Description ...33
5.2.2 Sample Preparation and Testing...34
5.2.3 Test Results ...35
5.3 Summary and Conclusions ...37
6. ASPHALT PAVEMENT ANALYZER TESTING ...42
6.1 Introduction ...42
6.2 APA Specimen Testing ...42
6.2.1 Test Method Description ...42
6.2.2 Sample Preparation and Testing...43
6.2.3 Test Results ...44
7. SUPERPAVE SHEAR TESTING ...51
7.1 Introduction ...51
7.2 SST Specimen Testing ...51
7.2.1 Test Method Description ...51
7.2.2 Sample Preparation and Testing...52
7.2.3 Frequency Sweep Test...53
7.2.3.1 Testing Procedures ...53
7.2.3.2 Test Results ...54
7.2.4 Repeated Shear Test ...56
7.2.4.1 Testing Procedures ...56
7.2.4.2 Test Results ...57
7.2.4.3 Rutting Resistance ...58
7.3 Summary and Conclusions ...60
8. SUMMARY AND CONCLUSIONS...79
8.1 Summary...79
8.2 Conclusions ...80
8.3 Recommendations ...80
9. REFERENCES ...82
APPENDIX A: BAGHOUSE FINES PARTICLE ANALYSIS RESULTS ...84
LIST OF TABLES
Table 4.1 – Batching for Original JMF and 0% BHF Revision ...29
Table 4.2 – Gradations for Original JMF and 0% BHF Revision ...29
Table 4.3 – Volumetric Properties for Original JMF and 0% BHF Revision ...29
Table 4.4 – Batching for 2% and 5% BHF Revisions...29
Table 4.5 – Gradations for 2% and 5% BHF Revisions...30
Table 5.1 – TSR Results: 0% Boone fines with 0.5% Additive...38
Table 5.2 – TSR Results: 2% Boone fines with 0.5% Additive...38
Table 5.3 – TSR Results: 5% Boone fines with 0.5% Additive...38
Table 5.4 – TSR Results: 5% Boone fines with 0% Additive...38
Table 5.5 – TSR Results: 5% Enka fines with 0.5% Additive ...39
Table 5.6 – TSR Results: 5% Enka fines with 0% Additive ...39
Table 5.7 – Boone and Enka TSR Values ...39
Table 6.1 – Average APA Results for Unconditioned Subsets ...48
Table 6.2 – Average APA Results for Conditioned Subsets ...48
Table 7.1 – Dynamic Shear Modulus versus Frequency; 0% Boone, 0.5% LOF ...61
Table 7.2 – Phase Angle versus Frequency; 0% Boone, 0.5% LOF ...61
Table 7.3 – Dynamic Shear Modulus versus Frequency; 5% Boone, 0.5% LOF ...62
Table 7.4 – Phase Angle versus Frequency; 5% Boone, 0.5% LOF ...62
Table 7.5 – Dynamic Shear Modulus versus Frequency; 5% Boone, 0% LOF ...63
Table 7.6 – Phase Angle versus Frequency; 5% Boone, 0% LOF ...63
Table 7.8 – Phase Angle versus Frequency; 0% Enka, 0.5% LOF ...64
Table 7.9 – Dynamic Shear Modulus versus Frequency; 5% Enka, 0.5% LOF ...65
Table 7.10 – Phase Angle versus Frequency; 5% Enka, 0.5% LOF ...65
Table 7.11 – Dynamic Shear Modulus versus Frequency; 5% Enka, 0% LOF ...66
Table 7.12 – Phase Angle versus Frequency; 5% Enka, 0% LOF ...66
Table 7.13 – Average FSCH Properties for Boone Fines ...67
Table 7.14 – Average FSCH Properties for Enka Fines...67
Table 7.15 – Average 5,000 Cycle Plastic Shear Strain...67
Table 7.16 – Average Plastic Shear Strain for 5% Boone Fines ...68
Table 7.17 – Average Plastic Shear Strain for 5% Enka Fines ...68
LIST OF FIGURES
Figure 2.1 – Batch Plant and Drum Mix Plant Layouts [14]...18
Figure 2.2 – Fractional Voids in Dust/Asphalt System [6] ...18
Figure 3.1 – Summary of Research approach and Methodology ...24
Figure 4.1 – Gradation of Boone and Enka Baghouse Fines Retained on #200 Sieve ...30
Figure 4.2 – Gradation of Boone and Enka Baghouse Fines Passing #200 Sieve ....31
Figure 4.3 – Gradation Curves for 0% BHF Aggregate Batching ...31
Figure 4.4 – Gradation Curves for 0, 2, and 5% BHF Aggregate Batching...32
Figure 5.1 – Boone and Enka TSR Values...40
Figure 5.2 – TSR Specimen Failure: 5% Boone BHF, 0% LOF...40
Figure 5.3 – TSR Specimen Failure: 5% Enka BHF, 0% LOF...41
Figure 6.1 – APA Test Specimen, 5% Boone BHF, 0% LOF, Dry ...49
Figure 6.2 – APA Test Specimen, 5% Boone BHF, 0% LOF, Conditioned...49
Figure 6.3 – Average APA Rut Depth Results...50
Figure 7.1 - Dynamic Shear Modulus versus Frequency; 0% Boone, 0.5% LOF ....69
Figure 7.2 – Phase Angle versus Frequency; 0% Boone, 0.5% LOF...69
Figure 7.3 - Dynamic Shear Modulus versus Frequency; 5% Boone, 0.5% LOF ....70
Figure 7.4 – Phase Angle versus Frequency; 5% Boone, 0.5% LOF...70
Figure 7.5 - Dynamic Shear Modulus versus Frequency; 5% Boone, 0% LOF ...71
Figure 7.6 – Phase Angle versus Frequency; 5% Boone, 0% LOF...71
Figure 7.7 - Dynamic Shear Modulus versus Frequency; 0% Enka, 0.5% LOF...72
Figure 7.9 - Dynamic Shear Modulus versus Frequency; 5% Enka, 0.5% LOF...73
Figure 7.10 – Phase Angle versus Frequency; 5% Enka, 0.5% LOF...73
Figure 7.11 - Dynamic Shear Modulus versus Frequency; 5% Enka, 0% LOF...74
Figure 7.12 – Phase Angle versus Frequency; 5% Enka, 0% LOF...74
Figure 7.13 – Plastic Shear Strain versus Number of Cycles; 100,000 Cycle Trials ...75
Figure 7.14 – Plastic Shear Strain versus Number of Cycles; 0% Boone, 0.5% LOF ...75
Figure 7.15 – Plastic Shear Strain versus Number of Cycles; 5% Boone, 0.5% LOF ...76
Figure 7.16 – Plastic Shear Strain versus Number of Cycles; 5% Boone, 0% LOF . ...76
Figure 7.17 – Plastic Shear Strain versus Number of Cycles; 0% Enka, 0.5% LOF ...77
Figure 7.18 – Plastic Shear Strain versus Number of Cycles; 5% Enka, 0.5% LOF ...77
Figure 7.19 – Plastic Shear Strain versus Number of Cycles; 5% Enka, 0% LOF ... ...78
NOTATIONS
AASHTO American Association of State Highway Transportation Officials AC asphalt cement
APA Asphalt Pavement Analyzer
ASTM American Society of Testing Materials BHF baghouse fines
DSR dynamic shear rheometer ESAL equivalent single axle load
F/A ratio of fines to asphalt, by volume FSCH frequency sweep at constant height HMA hot mix asphalt
ITS indirect tensile strength
NCDOT North Carolina Department of Transportation NCSU North Carolina State University
PG performance graded
RSCH repeated shear at constant height SGC SUPERPAVE Gyratory Compactor SST Superpave shear testing machine Superpave Superior performing pavements VMA voids in mineral aggregate
|G*| magnitude of dynamic shear modulus
1. BACKGROUND
1.1 Introduction
In order to expand and maintain the immense road infrastructure in the US, between 450 and 500 million tons of hot-mix-asphalt is produced annually [15]. This asphalt concrete is produced in approximately 3600 asphalt plants throughout the country. With such a large number of plants, variability of materials and methods produces mixes with unique properties.
One variable aspect of asphalt concrete production is the collection and use of fine particulate matter carried in plant exhaust gases. Asphalt plants use large drums and hot air to dry aggregate before mixing. This air carries away a fraction of the smallest aggregate particles. These particles pose environmental and health problems if released into the atmosphere. Currently collection systems are used to remove the fine material before the exhaust gas is released into the air.
One of these collection systems is the baghouse. It consists of filters that trap the airborne fines and collect the fines, which are known as baghouse fines. These fines can then be wasted or recycled back into the mix. A majority of asphalt plants reintroduce baghouse fines, although there are many methods for reintroduction. Many plants do not meter these fines and intermittently purge them back into the mix, which leads to
concentrations of baghouse fines in the mix.
fines to the performance of asphalt binder and asphalt concrete. Variability in the properties of the baghouse fines makes general conclusions and guidelines difficult to draw.
Moisture sensitivity in asphalt pavements can lead to performance problems and should be avoided by designers. Some evidence has shown that the introduction of the finely graded baghouse fines can increase asphalt mix moisture susceptibility. However, an increase in stiffness with the addition of baghouse fines is a positive.
Most asphalt plants are required to use anti-strip additives to reduce the moisture sensitivity of the asphalt concrete. These additives work with both the aggregates and binder to increase the adhesion between aggregate and asphalt and reduce the attraction between water and aggregate to prevent the stripping of asphalt by water.
This project involved the evaluation of laboratory mixes for moisture
susceptibility. Some of the mixes were made with large quantities of additional baghouse fines to simulate the intermittent reintroduction of the fines into the mixes. The
effectiveness of an anti-strip additive was also determined by producing samples with and without the additive.
1.2 Objectives and Scope
The objective of this study was to determine the effects baghouse fines have on asphalt concrete mixtures. The study also addressed the effectiveness of anti-strip additives in preventing moisture damage.
job-mix-formula provided by NCDOT. The first task was the evaluation of baghouse fines on the moisture susceptibility of the mixes. This included a determination of the effectiveness of the anti-strip additive. The second step was to evaluate the effect of baghouse fines on the rutting resistance of the mixes both dry and conditioned. The final step was to determine the effect of baghouse fines on the performance properties of the asphalt pavement.
There were four tasks involved in this study. The first was a verification of the job-mix-formula and volumetric properties of the mix. This was performed with gradation analyses, particle analyses for the baghouse fines, and volumetric analyses. Two types of fines were used, at various concentrations, and with different anti-strip additive contents, to produce the samples in the laboratory. The second task was the evaluation of moisture susceptibility with the Tensile Strength Ratio (TSR) test. The third task involved the determination of rutting resistance of conditioned and unconditioned specimens using the Asphalt Pavement Analyzer (APA) test. Finally, the mix
performance of dry and conditioned samples was evaluated using the Frequency Sweep at Constant Height (FSCH) and Repeated Shear at Constant Height (RSCH) tests.
1.3 Significance
of tack coats as well as the improper use of baghouse fines. In the study it was determined that baghouse fines had some effect on the moisture sensitivity, but the extent was not determined. This research further studies the contribution of baghouse fines to asphalt concrete behavior as well as evaluates the effectiveness of additives in negating any moisture susceptibility.
The following chapter is an overview of all the previous research in the effects of baghouse fines and additives. Chapter 3 details the research approach and the methods used in each step of the project. Chapter 4 deals with the verification of the job-mix-formula and necessary adjustments. The evaluation of the moisture sensitivity of the different asphalt concrete mixes is discussed in Chapter 5 while Chapter 6 deals with the rutting resistance in the APA testing. Chapter 7 details the mix performance using the FSCH and RSCH tests to determine mixture properties for pavement performance in rutting and fatigue. Finally, Chapter 8 provides a summary as well as future
2. LITERATURE
REVIEW
The purpose of the present study is to determine the effect baghouse fines have on the properties of hot-mix-asphalt (HMA). These properties include moisture sensitivity, rutting and fatigue resistance, and strength among others. This chapter presents previous research conducted in all areas of this project and will present a body of knowledge to build conclusions on.
2.1 Definition of Baghouse Fines
The production of asphalt concrete involves several steps at the mixing plant. The aggregate is first batched and then dried. The aggregate is dried using drums with hot gas passing over the aggregate to heat the aggregate for mixing as well as remove excess moisture. During this drying process, small particulate in the aggregate mix becomes airborne. Collection systems are used to remove the fines from the exhaust stream. These fines are often reintroduced into the mix and, due to the fineness of the material, may have an effect on the mixture properties. The next sections will discuss the various aspects of these fines.
2.1.1 Fines Collection Systems
primary collectors while the baghouses and wet scrubbers are secondary collectors. Often the exhaust gases are filtered through a combination of primary and secondary collectors.
Primary collectors operate by reducing the speed of the exhaust gases. The reduction of air speed causes the coarse particles to fall out of suspension. Knockout boxes increase the cross sectional area, which reduces air speed. In cyclone systems, the exhaust gas is forced to spin inside the cyclone. The heavier particles are forced to the outside of the chamber and slowed by friction until they slide down into a collection bin. When a primary collector is used, the baghouse fines are finer and have a more consistent gradation [5].
Secondary systems are used to remove material down to 1µm from the exhaust gases. The two systems used for this process are wet-scrubbers and baghouses. Studies have shown that secondary systems are 99 percent efficient in filtering particles larger than 10µm while they are only 75 percent efficient in removing particles 1µm and smaller [6]. Wet-scrubbers inundate the fine particles with water droplets and the heavy particles fall from the air stream. The resulting slurry of water and fines is often sent to a settling pond. The downside of this method is the wasting of the fines as well as environmental impacts.
the cake is removed, the fines fall into a storage bin and can be returned to the mix. This process allows for the more efficient use of materials because the fines are not wasted.
2.1.2 Variability of Baghouse Fines
The composition of the baghouse fines varies depending on the type of plant, aggregate type, and the configuration of the collection system. There are two types of plants: batch plants and drum plants. The two plants differ in the method of mixing as well as exhaust gas velocity. Batch plants have exhaust gas velocities around 800 fpm while drum plants often have velocities of 1000 fpm or more [6]. With a higher velocity, more and larger particles will be picked up by the airstream. The type of aggregate also affects the baghouse fines according to the dust content. Natural aggregates may be covered with clay that will be picked up during drying. Mixes with large fractions of fine material may also increase the baghouse fines collection and change the gradation as well.
Exhaust systems containing primary and secondary collectors will produce
2.1.3 Recycling of Baghouse Fines
Another concern that arises in this process is how the fines are reintroduced into the mix. Fines may be wasted, as with the wet scrubbers, or reintroduced to the mix. Environmental concerns have led a majority of plants to recycle baghouse fines. The fines must, however, be returned to the aggregate in a uniform manner. This can be
accomplished by storing the fines in bins and metering, or even weighing them, into the mix. Figure 2.1 [15] shows layouts of the two types of plants and the methods of baghouse fines reintroduction. If the material is not metered into the mix, surges can produce large changes in the concentration of baghouse fines in the mix. This can lead to changes in the mix composition and performance, which will be addressed later in this section.
2.2 Definition of Mineral Filler
The two constituent parts that make up HMA are asphalt cement and mineral aggregate. A further breakdown of the mineral aggregate produces three categories: coarse aggregate, fine aggregate, and mineral filler. Coarse aggregate is defined as the fraction of aggregate retained on the #8 sieve and higher. Fine aggregate is then classified as the material passing the #8 sieve.
There is no universal definition, however, for mineral filler. ASTM D242 [2] defines mineral filler as: “Mineral filler shall consist of finely divided mineral matter such as rock dust, slag dust, hydrated lime, hydraulic binder, fly ash, loess, or other suitable
definition is too broad, however, and does not provide criteria to determine the suitability of the filler.
Tunnicliff [13] tried to define mineral fillers in terms of what is filled, what does the filling, and why the filling is done. One definition he provided was: “Filler is that portion of the mineral aggregate generally passing the 200 sieve and occupying void
spaces between the coarser aggregate particles in order to reduce the size of these voids
and increase the density and stability of the mass.” In this definition the filler reduces the voids as well as increases the stability and is composed of material passing the #200 sieve. Another definition given is: “Filler is the mineral material that is in colloidal suspension in the asphalt cement and results in a cement with a stiffer consistency.” The filler in this definition is in the asphalt mastic and stiffens the asphalt as well.
Another definition was proposed by Tunnicliff [14] in 1967. He proposed that filler is the portion of aggregate that passes the #200 sieve, will perform satisfactorily in the presence of moisture, and has, through experience, been deemed to produce successful pavements. Therefore, mineral filler must not contribute to the moisture damage of the asphalt pavement.
Puzinauskas [10] provided another mineral filler definition as follows:
“Mineral fillers play a dual role in paving mixtures. First, they are a part of the mineral aggregate – they fill the interstices and provide contact points between larger aggregate particles and thereby strengthen the mixture. Second, when mixed with the asphalt, mineral fillers form a high-consistency binder or matrix which cements larger aggregate particles together.”
All of the definitions of mineral fillers allow baghouse fines to be classified as filler. The effects of baghouse fines on asphalt cement and asphalt concrete will be discussed in following sections. Baghouse fines must also not contribute to stripping or other moisture damage in asphalt pavement. Moisture susceptibility of asphalt concrete with baghouse fines will be discussed in this chapter and is an objective in this research project.
2.3 Effects of Baghouse Fines
It has been shown that mineral fillers can increase the stiffness of both the asphalt cement as well as the asphalt pavement. Baghouse fines, a constituent of the mineral filler, also affects both the asphalt cement and the HMA performances, depending on the particle size distribution. Baghouse fines interact with the asphalt cement as an extender as well as a stiffener. In asphalt concrete the fines fill the spaces between the larger aggregates producing a stiffer mix, which can lead to compaction problems. The following sections discuss these issues further.
2.3.1 Asphalt Cement – Fines Interaction
The properties of the asphalt used in HMA mixes are altered by the addition of baghouse fines. As filler is added to the asphalt cement, the binder becomes stiffer and its properties can be affected. The creation of an asphalt-filler mastic is referred to in
Tunnicliff’s definition as a colloidal suspension. Many tests have been run on the
include viscosity, softening point, and penetration tests as well as Dynamic Shear Rheometer (DSR) testing.
Anderson [3] performed a study on the behavior of the asphalt-filler mastic using the penetration, softening point and ductility. He used five filler/asphalt (F/A) ratios and five different types of filler. These F/A ratios are calculated by volume of material to allow for comparison between filler types. As expected, he found the penetration to decrease with an increase in the F/A ratio. He also found the softening point and
viscosities increased with an increasing F/A ratio. The results showed a large increase in the viscosity at an F/A ratio of 0.4. This F/A ratio is lower than those found in many HMA mixtures. The much higher viscosity can affect the compactibility of the HMA [3] and require more compactive effort or higher compaction temperatures.
Eick [5] also performed viscosity testing on baghouse fines and asphalt binder mastics. His results show a correlation between viscosity ratio and fineness of the baghouse fines. He performed viscosity tests on mastics as well as neat asphalt with no filler. The two values were used to find a viscosity ratio for each F/A ratio. The results showed increasing viscosity ratios as the F/A ratio increased. The results also showed a correlation between the fineness of the baghouse fines and the viscosity ratio. As the percent of baghouse fines material passing the #200 sieve increased, the viscosity ratio also increased.
and rut resistance of the mastics over the asphalt binder. An increase in stiffness was also observed in one of the baghouse fines mastics over the regular mineral filler.
An important concept that illustrates the fine-asphalt interaction is the fractional voids. Figure 2.2 [6] graphically describes the fractional voids concept. If a filler sample is dry-compacted to its maximum density, the internal voids will be at a minimum. This condition is represented by Vds in the figure. If a volume of asphalt is added to the dust,
the amount of asphalt required to fill these voids is considered fixed asphalt while the remaining asphalt is free asphalt, Vaf. The total volume of fines and fixed asphalt is the
bulk volume of compacted dust, Vdb. These values show that as the percent bulk volume
of fines increases, the percent free asphalt decreases and the mortar becomes stiffer.
2.3.2 Influence on Mixture Properties
The introduction of baghouse fines to HMA mixes produces a profound affect on the in-place properties of the pavement. The thickness of the asphalt film on the
aggregate in HMA is between 9 to 25 microns [3], depending on the type of mixture. The addition of baghouse fines to the binder acts as an asphalt extender if the fines are of sufficient fineness. For baghouse fines with a significant fraction finer than 25 microns, the particles will become embedded in the asphalt film and increase the effective asphalt volume. This is known as asphalt extension. In a study by Anderson [3], the results showed an increase in the flow values with an increase in F/A ratio. His explanation was a lubricating, or extending, of the asphalt by the fine particles. The increased effective asphalt volume counteracted the stiffening effect of the increased filler content. If,
asphalt content as well as the voids in mineral aggregate (VMA) [17]. This will in turn stiffen the mix as well as provide a greater potential for stripping.
Tunnicliff’s [13] definition of mineral filler, discussed previously, states that filler reduces the voids between aggregates. The contact increases aggregate interlock, which increases the Marshall stability and flow values [5]. A result of the increased stiffness is the possibility of compaction difficulties. Compactive effort is related to the binder viscosity, which has been shown to increase with the addition of filler. Kandhal [8] suggests that there is a relation between bulk volume of fines in the mix and resistance to compaction. This relation is straightforward since as bulk volume increases, free binder decreases, decreasing the flow. Using the Ridgen voids test, the bulk volume of fines is determined. If the value is below 50 percent, the HMA mixture is acceptable. If, however, the bulk volume is greater than 50 percent, a softening point test is used to determine the suitability of the HMA mixture.
The increased effort leads to compaction problems and higher in-situ air voids, which increase the stripping potential. This in turn can lead to raveling, bleeding, or shoving of asphalt mixes. If too many fines are added, the mix can become tender and rutting or shoving may occur. If, however, too few fines are added, the pavement may have high voids and raveling may be observed.
2.4 Moisture Sensitivity in HMA
by the water in the pavement. The main cause of this stripping is the higher affinity for water over asphalt in the aggregate. If the moisture penetrates the asphalt film it will displace the asphalt film and weaken the pavement. Moisture damage occurs due to loss of cohesion or adhesion and aggregate degradation. Stripping is caused by the loss of cohesion and adhesion and will be discussed.
2.4.1 Adhesion and Cohesion Loss
The loss of bond between the asphalt binder and the aggregate is adhesion loss. There are four theories, which together explain the adhesion of asphalt to aggregate. They are: the Mechanical Theory, the Chemical Reaction Theory, the Surface Energy Theory, and the Molecular Orientation Theory. The chemical theory is shown by the higher tendency of acidic aggregates to strip [7]. An acidic aggregate may reduce the chemical reaction on the aggregate surface, reducing adhesion.
The surface energy theory is based on the wettability of the aggregate by the asphalt and is dependant on the viscosity and surface tension of the asphalt. Water has a lower viscosity and surface tension than asphalt, which increases water’s wettability of the aggregate. The molecular orientation deals with the polarity of the water molecule. Water is a polar molecule while asphalt is nonpolar. The charged surface of the aggregate will then have a greater affinity for water molecules.
affect asphalt adhesion. If the surface is dusty or moist before mixing, the asphalt will not bond as well to the aggregate.
Cohesion is the bond developed throughout the asphalt concrete by the asphalt cement. Loss of cohesion is primarily evident in the softening of asphalt in the pavement. The viscosity of the asphalt and the asphalt-fines mastic determine the susceptibility for cohesion loss. Both cohesion and adhesion loss are closely related and contribute simultaneously to stripping in asphalt concrete.
2.4.2 Moisture Sensitivity Testing
The most widely used testing method for determining the moisture susceptibility of asphalt pavement is AASHTO T-283 or Modified Lottman Test. This test is performed on sets of six to eight specimens compacted to 7±1 percent air-voids. Half of the
specimens are saturated to between 50 and 80 percent. An indirect tensile strength (ITS) test is performed on the specimens and an average for each subset is used to find the tensile strength ratio (TSR). The TSR is the ratio of moisture conditioned strength to dry strength. A minimum value is set to determine the acceptable moisture damage. The NCDOT minimum value is 85 percent retained strength.
sets with different fine types, asphalt types, and F/A ratios. Using the NCDOT requirement of 85 percent, none of the sets passed.
Kandhal [8] carried out moisture susceptibility testing using the Asphalt Institute Water Sensitivity Test and the Idaho Test. The Asphalt Institute test follows the
AASHTO test while the Idaho test includes a freeze-plus-soak cycle. Specimens were prepared using ten different baghouse fines at fine-asphalt ratios of 0.3 and 0.5. Kandhal [8] used a minimum TSR value of 50 percent and four fines types failed. Using the NCDOT criteria of 85 percent, only Portland cement passed the TSR testing. These results show a connection between baghouse fines and moisture damage.
2.5 Prevention of Moisture Damage 2.5.1 Types of Anti-Strip Additives
In order to reduce pavement damage related to stripping, additives are used to decrease moisture susceptibility. There are two types of anti-strip additives used in HMA production: hydrated lime and liquid surfactants. The hydrated lime is applied to the aggregates before mixing in several different ways. The lime can be added as a dry powder to wet or dry aggregates or as a slurry to the aggregates which are then dried before mixing. Lime is typically added to the aggregates at 1 percent of the aggregate weight. Lime increases the adhesion between asphalt and aggregates through different chemical reactions. The increase in adhesion reduces stripping, providing a more durable pavement.
of the asphalt for the aggregate, moisture stripping is reduced. Liquid amines and liquid phosphate ester are the two types of anti-strip additives used in HMA. They are mixed with the asphalt prior to mixing at a dosage of about 0.5 to 1 percent of the asphalt weight. Unlike the application of the hydrated lime, the liquid additives can be mixed with large amounts of asphalt and stored for use in many mixes. These advantages save time and money by using less material and not affecting the production process greatly. A disadvantage of the liquid surfactants is possible heat degradation [4]. If the asphalt mixture is held at high temperature for long periods of time, the effectiveness may be reduced. Also, it has to be added uniformly and mixed consistently throughout the mix.
2.5.2 Studies of Additive Effectiveness
Previous studies have been conducted on the subject of moisture sensitivity and anti-strip additives. Birdsall performed a study using three different aggregates and three different additives as well as a control set without additives. The results showed
Figure 2.1 – Batch Plant and Drum Mix Plant Layouts [14]
3.
RESEARCH APPROACH AND METHODOLOGY
3.1 Introduction
Previous testing performed for NCDOT [11] demonstrated moisture susceptibility in asphalt pavement containing baghouse fines. These fines were purged into the mix producing large changes in the mix composition and performance. Further testing was necessary to determine the extent of the moisture damage as well as effective additives to prevent stripping. Using a job mix formula (JMF) provided by NCDOT, laboratory specimens were prepared for several different tests to evaluate moisture damage as well as changes in performance associated with changes in baghouse fines content and anti-strip additive.
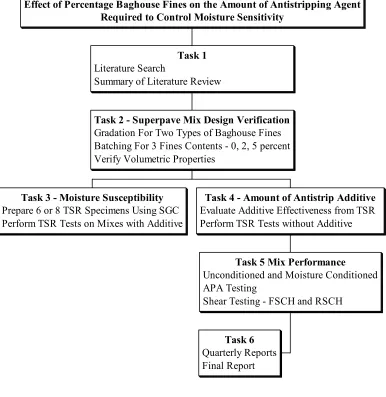
The research approach is outlined in a flow chart that details each individual step. This flowchart is shown in Figure 3.1. Each step will be discussed in the following sections.
3.2 Research Tasks
3.2.1 Selection of Materials and Job-Mix-Formula
volumetric properties from the JMF were verified. Batching was adjusted slightly to provide a gradation within acceptable limits.
3.2.2 Moisture Susceptibility Testing
The test performed by NCDOT for moisture sensitivity is a modified AASHTO T-283. The freeze/thaw cycle is removed from the testing and each subset contains 8 specimens. The specimens are required to be 150 mm in diameter and 95 mm tall with an air-void content of 7±1 percent. Several sets, each with different fines and anti-strip
additive content, were prepared in the lab using a Superpave gyratory compactor (SGC). After the air void percentage was determined, the samples were delivered to NCDOT for conditioning and testing. The conditioned subset was saturated and indirect tensile tests were performed on the dry and conditioned subsets. A TSR value was then calculated for each subset. These values were compared to the NCDOT criteria of 85 percent retained strength and the effectiveness of the additive was evaluated.
3.2.3 Asphalt Pavement Analyzer Testing
3.2.4 Specimen Shear Testing
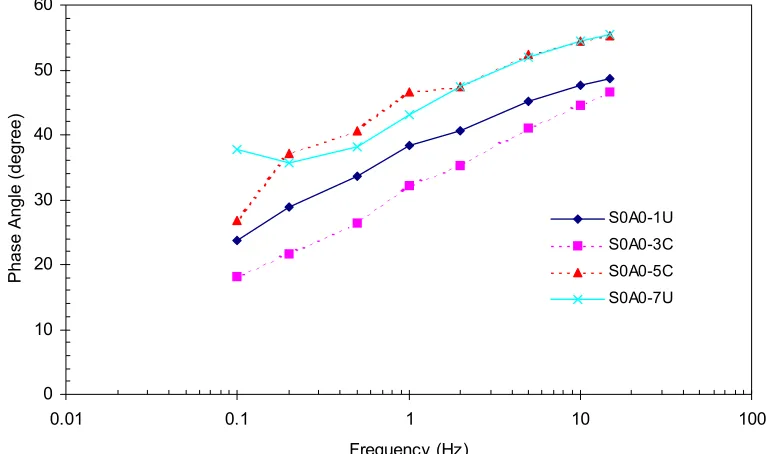
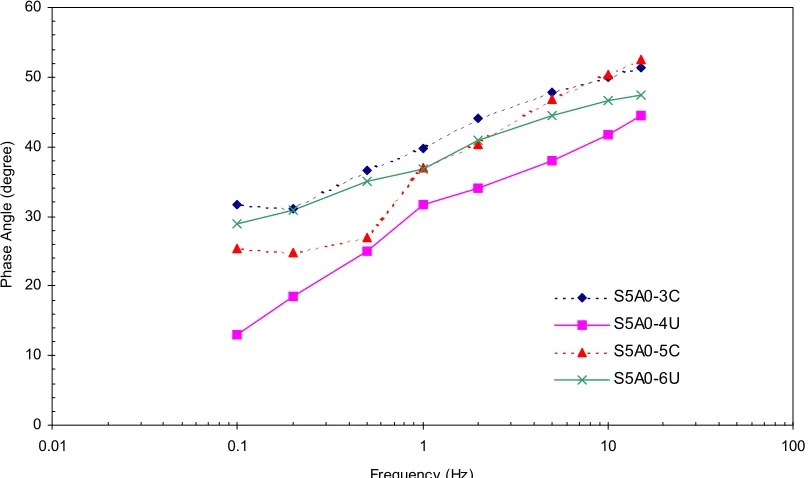
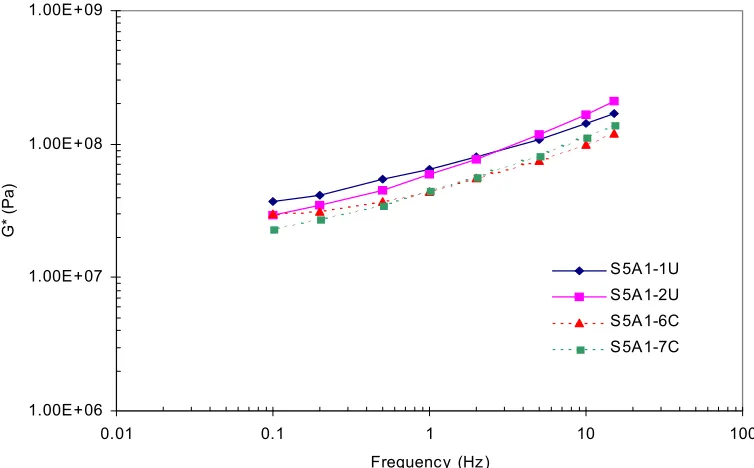
The final testing was the frequency sweep (FSCH) and repeated shear (RSCH) testing on the Superpave Shear Testing (SST) apparatus. 150 mm diameter specimens were compacted in the SGC to a height of 127mm and sawed to the specified height of 50 mm. The air-void range for the cut specimens was reduced to 6.3±0.5 percent. Each set consisted of four samples with two conditioned and two dry specimens. A FSCH test was run on each specimen to determine the shear modulus, |G*|, and the phase angle, δ, at various frequencies. These values are also used to determine fatigue resistance. The RSCH test is subsequently run and the plastic shear strain is recorded. From these values comparisons were drawn on the effects of baghouse fines and anti-strip additive on mix performance.
3.3 Selection of Test Temperature
Testing temperature plays a significant role in the behavior and properties of asphalt concrete. Asphalt design must take into account the in-situ environment with considerations such as pavement temperature and moisture. There are a few different procedures for determining the testing temperature. AASHTO TP7 – Procedure F, dealing with the repeated shear test, uses the seven-day temperature at the selected pavement depth. The suggested depth is 20 mm from the surface and the surface temperature data is determined using the SHRPBIND program in the Superpave
software.
maximum temperatures between 35° and 38°C. The pavement depth chosen corresponded to the interface layer at approximately 33 mm. These values were placed into the
SHRPBIND program as well as into the equations:
Tsurf – Tair = -0.00618*(lat.)2 + 0.2289*(lat.) + 24.4 (3.1)
Td = Tsurf * (1-0.063*d + 0..007*d2 – 0.0004*d3) (3.2)
Where Tsurf, Tair, and Td are the temperatures, in degrees C, of the surface, air, and
at depth d, in inches, respectively and lat. is latitude in degrees. The two computed values were within 3°C and were averaged to a value of 50.2°C. This temperature was rounded to 50°C in this study due to the accuracy of the thermometers and instruments. Both the FSCH and RSCH tests were run at this temperature for comparison.
3.4 Specimen Nomenclature
In order to keep track of the large number of samples produced and tested
throughout this project, a naming system was developed. The names of the subsets had 4 characters describing the test type, percentage baghouse fines (BHF), type of BHF, and type and quantity of anti-strip additive. A list of the terms and meanings follows:
First Character – Testing type
A – Asphalt Pavement Analyzer test S – Simple Shear Testing
T – TSR test
Third Character – Type of Baghouse Fines A – Maymead Boone BHF
B – Enka BHF
Fourth Character – Type and Percentage of Anti-Strip Additive 0 – 0.5 percent, Ad-Here 6500 LOF
1 – no additive used
Task 3 - Moisture Susceptibility Prepare 6 or 8 TSR Specimens Using SGC Perform TSR Tests on Mixes with Additive
Task 6 Quarterly Reports Final Report
Task 5 Mix Performance Unconditioned and Moisture Conditioned APA Testing
Shear Testing - FSCH and RSCH Task 4 - Amount of Antistrip Additive Evaluate Additive Effectiveness from TSR Perform TSR Tests without Additive Task 2 - Superpave Mix Design Verification
Gradation For Two Types of Baghouse Fines Batching For 3 Fines Contents - 0, 2, 5 percent Verify Volumetric Properties
Task 1 Literature Search
Summary of Literature Review
Effect of Percentage Baghouse Fines on the Amount of Antistripping Agent Required to Control Moisture Sensitivity
4.
EVALUATION OF MATERIAL AND JOB-MIX-FORMULA
4.1 Introduction
This investigation was motivated by the pavement distress observed by NCDOT in western North Carolina. Previous studies have pointed to moisture damage, related to the unmetered introduction of baghouse fines into mixes, as a factor in this distress.
Therefore, the materials needed for HMA production, asphalt, aggregates, baghouse fines, and additives, were provided from plants in that area. A JMF was also provided for the laboratory production of HMA.
4.2 Baghouse Fines
Two different baghouse fines samples were used in this study. One sample was from a Maymead Materials plant in Boone (NCDOT Division 11), North Carolina and the other was from a plant in Enka (NCDOT Division 13), North Carolina. In order to
determine the gradation of the two samples, a wet sieve analysis was performed in accordance with ASTM – C117. The material was sieved on the #16 and #200 sieves while water was washed over the aggregate. Unlike typical wet sieve procedure, the water and the aggregate passing the #200 sieve was retained. The fine-water slurry was dried in an oven and the fine aggregate was collected for further analysis.
The fines passing the #200 sieve were sent to the National Center for Asphalt Technology (NCAT) lab in Auburn, Alabama for fine particle analysis. Using the Coulter Particle Size Analyzer, two trials were performed for each fine and an average gradation was calculated. A mixture of water and 1 percent sodium hexametaphosphate was used to create a suspension of the baghouse fines. Light was passed through the sample and optical sensors detect the intensity. When the intensity data is compared to a
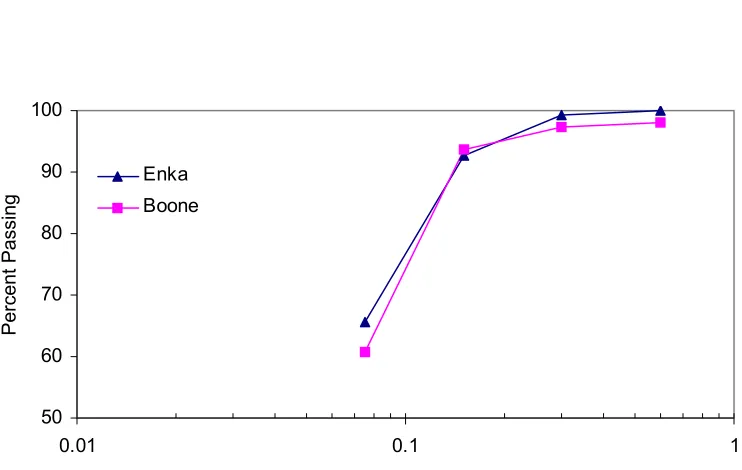
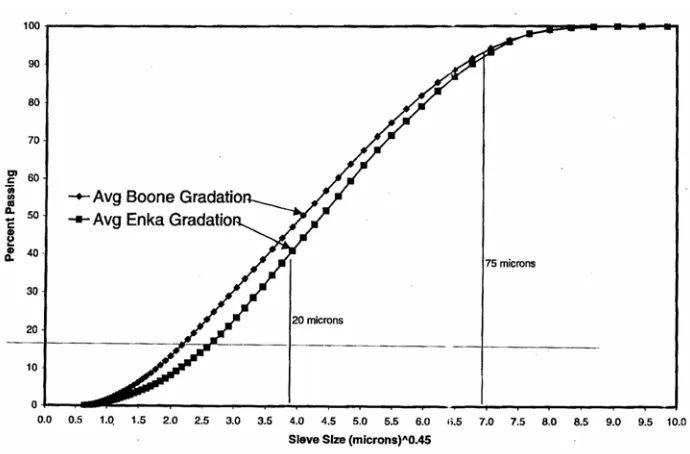
measurement of the fluid with no fine material present, a particle distribution is generated. The particle distributions give the gradation of the fines in suspension. The Boone and Enka gradations are shown in Figure 4.2 and more detailed graphs appear in
Appendix A. From the graph it is evident that the Boone baghouse fines are finer than the Enka fines. The mean particle size for the Boone and Enka fines is 29.4 µm and 32.4 µm respectively. The Boone fines are about 7-8% finer than the Enka fines at the 20-micron level. The 20-micron level is important because it is the upper level of thickness for the asphalt film. Particles below this size are likely to get embedded in the asphalt film and act as asphalt extenders.
4.3 Job-Mix-Formula Evaluation and Revision 4.3.1 Gradation Analysis
screenings. The Maymead Boone baghouse fines accounted for 1.5 percent of the aggregate weight.
The aggregates were first combined using the JMF batching and a wet sieve analysis was performed. The aggregates were washed over the #16 and #200 sieves to remove the material passing the #200 sieve. The remaining aggregate was dried and sieved and a gradation was plotted. The mass lost in the wet sieving was added to the mass of the material passing the #200 sieve in this gradation. Two trials produced gradations similar to the given JMF gradation, however, the experimental gradation passed through the restricted zone. After several adjustments to the batching, an acceptable gradation, which passed below the restricted zone, was produced. The new batching data is presented in Table 4.1 and the final gradation and that of the experimental JMF are shown in Figure 4.3 and Table 4.2.
4.3.2 Evaluation of Volumetric Properties
Once the proper batching was determined, the volumetric properties of the
laboratory mix were evaluated. The asphalt used in this JMF was a PG 64-22 produced by Citgo in Bristol, Virginia. The design asphalt content was determined to be 5.8 percent by weight of the mix. Finally the anti-strip additive, LOF 6500, was added to the asphalt cement at 0.5 percent by weight of the asphalt. The asphalt concrete was mixed in the laboratory at 149°C and the maximum specific gravity was determined. Using the Rice specific gravity test the maximum specific gravity, Gmm, was found to be 2.509 compared
Using the experimental Gmm value, Superpave gyratory compactor (SGC) samples
were compacted for testing. These specimens were required to have 4±0.5 percent air voids that were verified using the bulk specific gravity. With the height data from the compactor and the specific gravities, the volumetric properties can be calculated. The values found experimentally and those provided with the JMF were close and both were within the acceptable NCDOT limits. This data is shown in Table 4.3.
4.3.3 Batching Adjustment for Various Fine Contents
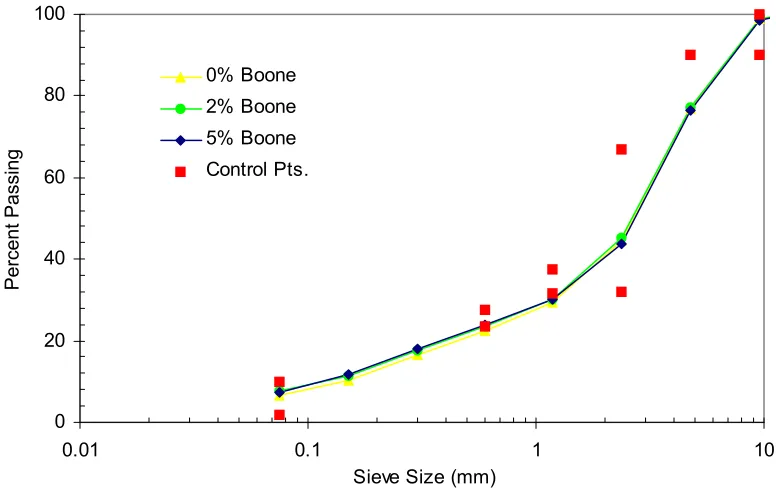
Once the gradation and volumetric properties of the JMF were verified, two different baghouse fines contents were considered. The original JMF required 1.5 percent Boone baghouse fines. Because this study deals with high concentrations of baghouse fines in HMA mixtures due to intermittent surges, this fines content is referred to as 0 percent baghouse fines. Additional baghouse fines concentrations of 2 and 5 percent over the JMF required 1.5 percent, provided total baghouse fines concentrations of 3.5 and 6.5 percent respectively. In consultation with NCDOT, it was decided that the additional baghouse fines would replace the fraction of dry screenings that passed the #200 sieve. Calculations and sieve analysis indicated that only 65 percent of the dry screening material passing the #200 sieve was required for the additional 2 percent BHF
Table 4.1 – Batching for Original JMF and 0% BHF Revision
Aggregate Fraction
78M Manufactured Dry Washed Boone
Batch Type Sand Screenings Screenings BHF
JMF Batching 30 26 19.5 23 1.5
0% Revision 30 21.5 19.5 27.5 1.5
Table 4.2 – Gradations for Original JMF and 0% BHF Revision
Sieve Sieve Percent Passing Control
Size Opening (mm) JMF Batching 0% Revision Points
1/2" 12.5 100.00 100.00 100
3/8" 9.5 98.45 99.00 90-100
4 4.75 76.79 76.96 <90 8 2.36 46.33 44.60 32-67
16 1.18 33.09 29.24 <31.6, >37.6
30 0.6 25.47 22.55 <23.5, >27.5
50 0.3 18.08 16.69
100 0.15 10.20 10.44
200 0.075 5.02 6.44 2.0-10.0
Pan - 0.00 0.00
Table 4.3 – Volumetric Properties for Original JMF and 0% BHF Revision
Trial Asphalt Est. Asphalt % Air % Gmm % Gmm Dust
Mix Type Content (%) Content (%) Voids % VMA % VFA @ N=8 @ N=174 Portion
0% Boone 5.8 5.79 4.76 16.7 76.0 87.3 97.3 0.86
JMF 5.8 5.1 4.8 15.8 75.9 86.6 96.4 0.98
Superpave 4% 15% min 65-76% <89% <98% .6-1.2
Table 4.4 – Batching for 2% and 5% BHF Revisions
Aggregate Fraction
Dry Dry
78M Manufactured Screenings Washed Boone Screenings
Batch Type Sand Ret. #200 Screenings BHF Pass. #200
2% Revision 32 19.5 16.1 27.5 3.5 1.4
Table 4.5 – Gradations for 2% and 5% Boone Revisions
Sieve Sieve Percent Passing Control
Size Opening (mm) 2% Boone 5% Boone Points
1/2" 12.5 100.00 100.00 100
3/8" 9.5 98.05 98.51 90-100
4 4.75 78.11 76.50 <90 8 2.36 50.20 43.85 32-67
16 1.18 34.28 30.12 <31.6, >37.6
30 0.6 25.27 23.95 <23.5, >27.5
50 0.3 17.85 18.02
100 0.15 10.61 11.75
200 0.075 5.48 7.17 2.0-10.0
Pan - 0.00 0.00
50 60 70 80 90 100
0.01 0.1 1
Seive Size (mm)
Percent Passing
Enka Boone
Figure 4.2 – Gradation of Boone and Enka Baghouse Fines Passing #200 Sieve
0 20 40 60 80 100
0.01 0.1 1 10
Sieve Size (mm)
Percent Passing
JMF Batch 0% Boone Control Pts.
0 20 40 60 80 100
0.01 0.1 1 10
Sieve Size (mm)
Percent Passing
0% Boone 2% Boone 5% Boone Control Pts.
5. MOISTURE
SUSCEPTIBILITY
TESTING
5.1 Introduction
For this project task, samples were prepared using different fines and fine
percentages and different anti-strip additive contents. The samples were manufactured at NCSU labs and sent to NCDOT for the TSR testing. The first set included samples using Boone baghouse fines at 0, 2, and 5 percent contents as well as the 0.5 percent anti-strip additive specified in the JMF. Based on the results of these tests, samples were made using 0 and 5 percent Enka fines and additive. Finally, samples without anti-strip additive were also produced to determine the effectiveness of the additive in preventing moisture damage.
5.2 Moisture Sensitivity Testing 5.2.1 Test Method Description
The moisture susceptibility testing performed in this study followed the NCDOT modified AASHTO T-283 standard. This standard calls for sets of 6 to 8 specimens with a 150 mm diameter and a height of 95 mm. These specimens were to be compacted to a 7±1 percent air-void level. The specimens were then divided into subsets with half
ITS ioned Uncondit Average ITS d Conditione Average
TSR = (5.1)
After the TSR is calculated it is compared to a minimum value to determine the level of moisture damage. The NCDOT acceptable minimum retained strength is 85 percent or greater. Any mix that falls below this value is unsatisfactory and action must be taken to inhibit moisture damage. Two notable differences between the T-283 standard and the test performed by NCDOT is the number of specimens and the freeze/thaw cycle. NCDOT uses eight specimens per subset while T-283 requires six. The first three subsets, containing various Boone fines contents, had six samples while the remaining subsets consisted of eight specimens. The freeze/thaw cycle, which is optional in T-283, is not used by NCDOT.
5.2.2 Sample Preparation and Testing
The specimens were compacted to 7±1 percent air voids and measured 95 mm with a 75 mm radius. The first three sets contained 0, 2, and 5 percent additional Boone baghouse fines with the required dosage of anti-strip additive. Each specimen was mixed at 149°C and subsequently aged for four hours at 65°C following the NCDOT
found for all six mixes using an average of two trials using the Rice method. The Gmm
value was then used in the air-void calculations.
The specimens were then delivered to NCDOT for conditioning and testing. Using the air-void data, the conditioned specimens were saturated between 50 and 80 percent. The indirect tensile strengths were evaluated and the TSR was determined. Once the performance of the Boone specimens was determined, specimens containing additive and 5 percent Enka fines were also produced and tested. Finally, sets containing no anti-strip additive were produced to determine the influence of the anti-strip additive on moisture damage. Only two sets were prepared with 5 percent Boone or Enka fines since this represented the worst-case scenario for testing. A total of 42 specimens were produced for this task.
5.2.3 Test Results
The results of the TSR tests indicate the effects of both fine amount and use of anti-strip additive on moisture damage. Tables 5.1 through 5.6 show the test results for each of the six sets and Table 5.7 and Figure 5.1 show the TSR values for each mix. The first tests were performed on the sets containing additive and Boone fines, and all three fine contents produced passing results. The TSR values were 91.6, 96.6, and 90.4 percent retained strength for the 0, 2, and 5 percent Boone baghouse fines contents, respectively. All three values are greater than the 85 percent minimum used by NCDOT.
percent Boone subsets. The conditioned or wet tensile strength progressed from 778.5 to 826.6 to 837.2 psi, a 7.5 percent increase. The increase in the tensile strength with increasing fines contents illustrates the stiffening effect of the baghouse fines in the asphalt concrete.
The set containing 5 percent Enka baghouse fines and the additive also passed the TSR test with an 88.5 percent. This is comparable to the 90.4 percent retained strength of the Boone samples. The average dry tensile strength of the Enka samples with 5 percent BHF was 780.2 psi and the conditioned strength was 690.6 psi. Both of these values are around 80 percent of the corresponding values of the 5 percent Boone samples.
The final two sets contained no additive. One set contained 5 percent Boone fines and the other contained 5 percent Enka fines. Both sets fell well below the minimum required TSR value. The TSR value for the Boone subset was 48.4 percent with an average dry tensile strength of 843.0 psi and a wet strength of 407.7 psi. The dry strength is 91 percent of the dry strength of the sample with additive. The wet strength, however, is only half of the conditioned specimens with additive. The large reduction in tensile strength shows the effect of the anti-strip additive in preventing moisture damage.
damage. For both Boone and Enka specimens visual stripping was observed as shown in Figures 5.2 and 5.3.
5.3 Summary and Conclusions
Table 5.1 – TSR Results: 0% Boone fines with 0.5% Additive
Unconditioned Specimens Conditioned Specimens
Air Voids Max Load Saturation Air Voids Max Load
Sample ID (%) (N) Sample ID (%) (%) (N)
T0A0-1 7.0 877.3 T0A0-3 78.0 7.2 778.5 T0A0-2 7.1 849.7 T0A0-5 72.6 7.0 757.9 T0A0-4 7.2 805.2 T0A0-6 74.6 7.0 795.5
Average 7.1 849.7 7.1 778.5
Table 5.2 – TSR Results: 2% Boone fines with 0.5% Additive
Unconditioned Specimens Conditioned Specimens
Air Voids Max Load Saturation Air Voids Max Load
Sample ID (%) (N) Sample ID (%) (%) (N)
T2A0-3 6.8 958.3 T2A0-1 73.1 6.9 828.6 T2A0-6 6.6 783.8 T2A0-2 71.0 6.5 830.1 T2A0-7 6.7 856 T2A0-5 77.6 6.7 801.6
Average 6.7 856.0 6.7 826.6
Table 5.3 – TSR Results: 5% Boone fines with 0.5% Additive
Unconditioned Specimens Conditioned Specimens
Air Voids Max Load Saturation Air Voids Max Load
Sample ID (%) (N) Sample ID (%) (%) (N)
T5A0-1 6.7 891.6 T5A0-3 73.6 6.4 821.2 T5A0-2 6.3 928.3 T5A0-4 75.9 6.6 854.2 T5A0-5 6.3 928.3 T5A0-6 75.0 6.4 837.2
Average 6.4 926.3 6.4 837.2
Table 5.4 – TSR Results: 5% Boone fines with 0% Additive
Unconditioned Specimens Conditioned Specimens
Air Voids Max Load Saturation Air Voids Max Load
Sample ID (%) (N) Sample ID (%) (%) (N)
T5A1-1 7.0 879.2 T5A1-2 79.5 7.3 365.2 T5A1-5 7.4 848.8 T5A1-3 74.5 7.3 358.3 T5A1-6 7.2 837.2 T5A1-4 78.5 7.0 460.3 T5A1-7 7.1 815.0 T5A1-8 78.7 7.0 490.4
Table 5.5 – TSR Results: 5% Enka fines with 0.5% Additive
Unconditioned Specimens Conditioned Specimens
Air Voids Max Load Saturation Air Voids Max Load
Sample ID (%) (N) Sample ID (%) (%) (N)
T5B0-4 7.6 815.8 T5B0-1 66.5 7.3 651.6 T5B0-5 7.6 775.7 T5B0-2 76.5 7.2 682.1 T5B0-6 7.9 784.6 T5B0-3 71.3 6.9 699.2 T5B0-7 7.8 762.3 T5B0-8 70.4 7.0 748.2
Average 7.7 780.2 7.1 690.6
Table 5.6 – TSR Results: 5% Enka fines with 0% Additive
Unconditioned Specimens Conditioned Specimens
Air Voids Max Load Saturation Air Voids Max Load
Sample ID (%) (N) Sample ID (%) (%) (N)
T5B1-4 7.6 869.3 T5B1-1 79.0 8.0 561.1 T5B1-5 7.6 868.4 T5B1-2 79.5 8.0 530.8 T5B1-6 7.9 813.3 T5B1-3 75.7 7.8 560 T5B1-7 7.8 889.3 T5B1-8 76.6 7.8 587.9
Average 7.7 868.9 7.9 560.5
Table 5.7 – Boone and Enka TSR Values
Boone BHF Specimens Enka BHF Specimens
Sample ID TSR (%) Sample ID TSR (%)
T0A0 91.6 - -
T2A0 96.6 - -
0 20 40 60 80 100
0%, 0.5% LOF 2%, 0.5% LOF 5%, 0.5% LOF 5%, 0% LOF Percent BHF and Additive
TSR Value (%
)
Boone Enka
Figure 5.1 – Boone and Enka TSR Values
6. ASPHALT
PAVEMENT ANALYZER TESTING
6.1 Introduction
The Asphalt Pavement Analyzer (APA) testing measures the rutting resistance of laboratory or field samples. This test repeatedly loads the samples at or above the load limit for the specimen in an accelerated time span. The damage accumulated is measured and compared to standard values to determine rutting performance. In this section, APA testing on dry and conditioned samples will be reviewed.
6.2 APA Specimen Testing 6.2.1 Test Method Description
The APA specimens were prepared in the NCSU labs and delivered to NCDOT for the APA testing. Specimens were produced with a SGC and were to measure 75 mm in height and have a 150 mm diameter. The target air-voids for the specimens was 7±0.5 percent, which is a narrower range than the TSR specimen requirements. Each subset contained eight specimens with four remaining dry and four being conditioned. The wet specimens were conditioned at NCDOT to between 50 and 80 percent saturation in 600C water. The conditioned specimens are tested underwater in the APA machine to retain the specimen internal moisture.
The APA test is performed using two six-inch specimens. These specimens are placed into a mold that restricts lateral deformation. The machine runs tests
maintained at 60°C while the air temperature in the chamber, for both conditioned and unconditioned tests, is maintained at 65°C.
The hoses are pressurized to 0.69 MPa (100 psi) and a steel wheel is passed over the tube at a speed of 2.0 km/h (33±1 cycles/min). This loading system approximates the interaction between the asphalt concrete and the pressurized vehicle tire. The test is conducted for 8000 cycles and the rut depth is measured at three different points at various intervals during the test. The three rut depths are then averaged to produce a deformation curve as well as a final rut depth value. The results from all the specimens in the subsets are then averaged to provide a rut depth for comparison between subsets.
There are several different criteria for maximum rut depth for the APA test. The Georgia Department of Transportation (GDOT) maximum limit is 7.6 mm while the FHWA sets the rut depth limit at 5 mm. The NCDOT limit is between these two values at 6.25 mm. The standard temperatures for these tests are different however. The GDOT test is performed at 40.60C while the NCDOT test is normally conducted at the maximum temperature rating of the asphalt binder. Since PG 64-22 was used in this study, the NCDOT criteria would require the test be run at 640C.
6.2.2 Sample preparation and testing
additive. A set containing 2 percent Boone baghouse fines and 0.5 percent additive was not produced since this was an intermediate mix.
The mixing was performed at 1490C, after which the mix was aged at 600C for four hours. The mix was then aged another two hours at 1380C and then compacted in the SGC. The samples were compacted to 75 mm with varying compactive efforts. The specimens were then tested to determine bulk specific gravity and air voids to be used in the saturation process. The samples were then transported to NCDOT for conditioning and testing.
6.2.3 Test Results
None of the subsets tested passed the NCDOT specification of rut depth less than 6.25 mm. Another observation was that the average rut depth of the conditioned
specimens is lower than the dry subsets. The TSR testing results showed a decline in strength between conditioned and dry sets. Therefore, the lower rut depths of the
conditioned specimens may be due to the water pressure filling the air voids in the sample. The dry subsets have empty air voids that allow for deformation when loaded. The voids in the conditioned samples are filled almost 80 percent with water, which restricts the deformation. Because of this difference in testing, comparisons cannot be made between the results of the dry and conditioned subsets. Therefore, dry subset results will only be compared to other dry results and vice versa.
rut depth for this sample was 11.74 mm. The sample in Figure 6.2 shows signs of stripping with much more aggregate exposed than the dry sample. The second sample also shows an upheaval of the aggregate around the rut while the first sample does not display this behavior. This upheaval suggests a loss of cohesive strength that allowed for severe deformation.
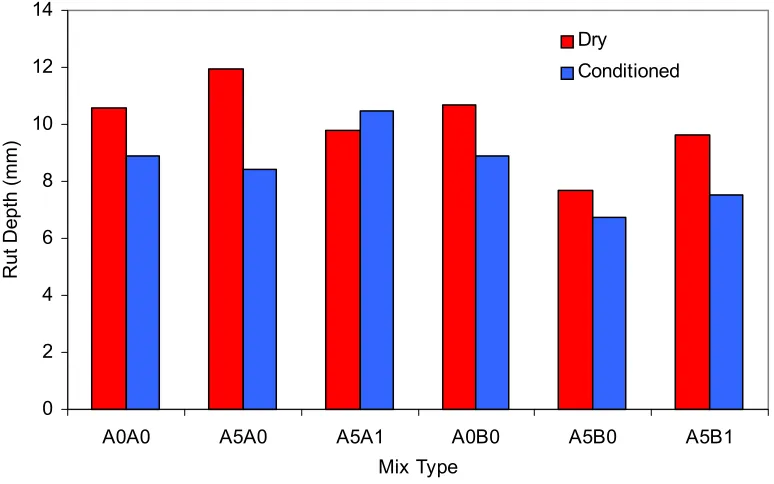
The average rut depths for the unconditioned and conditioned APA testing are shown in Tables 6.1 and 6.2 respectively and in Figure 6.3 graphically. For the dry specimens with Boone fines, the set containing 5 percent BHF with no anti-strip additive had the lowest rut depth at 9.81 mm. It was followed by the specimens containing 0 percent BHF with additive at 10.56 mm. The set with 5 percent BHF and additive had the highest rut depth at 11.93 mm.
The dry Enka set with the lowest rut depth contained 5 percent BHF with anti strip additive. The rut depth for this set was 7.67 mm. The set with 5 percent BHF and no additive had a rut depth of 9.64 mm. Finally, the set with 0 percent BHF with additive had the highest rut depth at 10.67 mm. The unconditioned sets containing Enka BHF displayed a decrease in rut depth with an increase in fines content. The stiffening effect of the increased baghouse fines reduces the rutting in the specimens.
anti-strip additive increased the conditioned rut depth by 25 percent for the specimens containing Boone BHF.
The conditioned Enka samples followed the same rut depth order as the Boone samples. The subset with 5 percent Enka BHF and additive had a rut depth of 6.75 mm. The rut depth for the conditioned subset with 5 percent BHF without additive was 7.53 mm. The subset with 0 percent BHF and additive had the largest rut depth at 8.91 mm. For the conditioned Enka specimens, the removal of anti-strip additive led to a 12 percent increase in rut depth.
In all the conditioned subsets and the unconditioned Enka subsets, the samples containing 5 percent baghouse fines and additive were the most rut resistant. This
corresponds to the TSR data with the 5 percent samples having the highest indirect tensile strength. This demonstrates the stiffening effect of the baghouse fines on the asphalt concrete as well as the effectiveness of the anti-strip additive. The wet Enka subsets are also more rut resistant than the corresponding Boone samples. Finally, the conditioned APA results show the effectiveness of the anti-strip additive in preventing moisture
damage. The sets containing 5 percent Boone and Enka BHF had increases in rut depth of 25 and 12 percent, respectively, due to the absence of anti-strip additive.
6.3 Summary and Conclusions
specimens are not comparable. The average rut depths differed by 55 and 58 percent for the dry and wet subsets respectively.
The dry subsets displayed an increase in rut resistance with an increase in
baghouse fines. The data also indicated the wet subsets with the highest BHF content and an additive were the most rut resistant. These results show both the effectiveness of the additive in preventing moisture damage and the stiffening effect of the increased BHF content on the mixes.
Table 6.1 – Average APA Results for Unconditioned Subsets
Type of BHF Additive Air Voids Rut Depth Sample ID BHF (%) Content (%) Content (%) (%) (mm)
A0A0 – U Boone 0 0.5 6.9 10.6
A5A0 – U Boone 5 0.5 7.4 11.9
A5A1 – U Boone 5 0 7.0 9.8
A0B0 – U Enka 0 0.5 7.0 10.7
A5B0 – U Enka 5 0.5 6.8 7.7
A5B1 - U Enka 5 0 7.2 9.6
Table 6.2 – Average APA Results for Conditioned Subsets
Type of BHF Additive Air Voids Rut Depth Sample ID BHF (%) Content (%) Content (%) (%) (mm)
A0A0 – C Boone 0 0.5 6.8 8.9
A5A0 - C Boone 5 0.5 7.1 8.4
A5A1 - C Boone 5 0 7.2 10.5
A0B0 - C Enka 0 0.5 7.2 8.9
A5B0 - C Enka 5 0.5 6.7 6.7
Figure 6.1 – APA Test Specimen, 5% Boone BHF, 0% LOF, Dry
0 2 4 6 8 10 12 14
A0A0 A5A0 A5A1 A0B0 A5B0 A5B1 Mix Type
Rut Depth (mm)
Dry
Conditioned
7. SUPERPAVE
SHEAR
TESTING
7.1 Introduction
The final testing phase of the project involved the Superpave Shear Testing (SST) device. Using a SST machine, specimens were subjected to stress and strain controlled tests and material properties were determined. There were two types of tests run using the SST: the frequency sweep and repeated shear tests. The results of these tests provide the values for the shear modulus as well as permanent deformation and phase angle. Differences in mixture performance will be determined using this data as will the rutting resistance.
7.2 SST Specimen Testing 7.2.1 Test Method Description
The two types of tests performed using the SST apparatus are the frequency sweep at constant height (FSCH) and the repeated shear at constant height (RSCH). The testing system consists of an environmental chamber that maintains a constant temperature and two hydraulic actuators that apply horizontal and vertical loads. A hydraulic pump runs the actuators and the displacement and loading is controlled by computer. For both the FSCH and RSCH tests, the computer applies a standard loading or displacement pattern and the deformations are measured using LVDTs.
reconditioning period. The RSCH test followed once the chamber returned to testing temperature. The first five RSCH samples were run to 100,000 cycles to determine the full stress strain response. Little additional permanent deformation was accumulated in the specimens after 5,000 cycles so additional tests were performed the AASHTO TP-7 procedure to 5,000 cycles.
7.2.2 Sample Preparation and Testing
All the SST samples were prepared in the laboratory using the SGC. Samples were compacted to a height of 127 mm and a radius of 75 mm. To coincide with the previous APA testing, an air-voids content of 7±0.5 percent was maintained. The specimens were compacted to the same height using different compactive efforts. Once the air-voids of the specimens were determined, each specimen was sawed into two 50 mm specimens. The sawing produced samples with two smooth faces for better adhesion with the epoxy. The cutting also lowered the air-void content by reducing the voids on the surface of the specimens. For this reason, the target air-voids were lowered to 6.3±0.5 percent. This drop in air-voids was consistent with findings from other research projects [11].
Before testing, the height of each sample was determined using a caliper. The sample was measured at four points on the circumference and the heights were averaged. The samples were then cleaned with rubbing alcohol and epoxied to the test platens using Devcon Plastic Steel epoxy. A platen-specimen assembly device provided pressure on the specimen while the epoxy hardened. After hardening the samples were placed in a 50°C oven for 2-3 hours for conditioning. The testing sample was then fitted with axial and horizontal LVDTs and placed into the machine. The sample was then conditioned for another half hour to allow the chamber and sample to return to testing temperature.
7.2.3 Frequency Sweep Testing
The frequency sweep at constant height (FSCH) test is performed to determine the shear modulus and the phase angle of the HMA specimen at several different frequencies. The specimen is loaded in a prescribed manner for each frequency and the viscoelastic properties are measured. Throughout the testing, the axial force prevents axial
deformation and maintains a constant height. The following sections describe the FSCH testing.
7.2.3.1 Testing Procedure
The FSCH test was performed in the Superpave SST machine in a
![Figure 2.1 – Batch Plant and Drum Mix Plant Layouts [14]](https://thumb-us.123doks.com/thumbv2/123dok_us/1382205.1170894/31.612.136.492.435.670/figure-batch-plant-drum-mix-plant-layouts.webp)