ABSTRACT
KUSAM, ABHILASH. Alternative Methods to Evaluate Moisture Sensitivity of Asphalt Mixtures. (Under the direction of Dr. Akhtarhusein A. Tayebali).
The North Carolina Department of Transportation (NCDOT) requires that asphalt
mixtures used in pavement construction meet the NCDOT moisture sensitivity specifications
prior to approval of the job mix formula (JMF). Foaming based warm mix asphalt (WMA)
mixes that use water injection WMA technologies, such as Astec’s Double Barrel® foamed
technology, and use of Zeolite additives such as Advera, tend to fail the current required tensile
strength ratio (TSR) tests. However, pavements constructed with these same WMA mixes in
the United States and in North Carolina have performed well to date. Either the current TSR
test protocol needed to be modified or new test(s) were needed for WMA mixes.
The main objectives of this research were:
(1) to explore modifications to the current TSR test protocol or to develop alternative
test methods such as impact resonance and colorimeter analysis that can be used in lieu of TSR
tests for foaming-based WMA mixes; and
(2) to evaluate the stiffness, fatigue performance, and rutting potential of the
foaming-based WMA mixes in a moisture-conditioned state so that the actual degradation of these mixes
can be compared directly to the results from TSR and indirect tensile (IDT) strength tests.
These objectives were accomplished by performing IDT tests to obtain the TSR in the
traditional manner, dynamic modulus (AASHTO TP79) and impact resonance (IR) tests for
fractured surfaces of the specimens used as a reference test method to indicate the level of
stripping in WMA and HMA mixes.
In the past, asphalt technologists used to first test the compatibility of asphalt and
aggregate source using tests such as Texas Boil Test and ASTM Test Method D3625.
However, these tests fell out of favor since they were subjective in nature. Although, not part
of the initial research objectives, a methodology evolved using colorimeter (Chroma meter)
that now allows the boil test results to be quantified. This is the single most important
breakthrough in evaluating the adhesive compatibility of asphalt and aggregate for any mixture
design process.
This research presents a new approach to asphalt-aggregate mixture design process.
Currently, the moisture sensitivity is evaluated as the final step in the mixture design process.
This research suggests a methodology that first evaluates the moisture sensitivity or the
adhesive compatibility of asphalt-aggregate in the presence of moisture before a mixture
design process is even considered. The advantages are savings in time, material resources, and
manpower.
Additionally, in this research, a new and easy way to evaluate the optimum antistrip
additive has been demonstrated using the asphalt boil test and the colorimeter device. The
research proposes to use this technique to evaluate the optimum antistrip additive for each
© Copyright 2017 Abhilash Kusam
Alternative Test Methods to Evaluate Moisture Sensitivity of Asphalt Concrete
by Abhilash Kusam
A dissertation submitted to the Graduate Faculty of North Carolina State University
in partial fulfillment of the requirements for the degree of
Doctor of Philosophy
Civil Engineering
Raleigh, North Carolina
2017
APPROVED BY:
_______________________________ _______________________________ Dr. Akhtarhusein A. Tayebali Dr. N Paul Khosla
Committee Chair
DEDICATION
BIOGRAPHY
Abhilash Kusam grew up in Kharagpur, a small town in Eastern India. His father is a professor
at the Indian Institute of Technology, Kharagpur, and his mother is a housewife. He received
his bachelor’s degree in Civil Engineering from Birla Institute of Technology and Science,
Pilani, India in 2011. During his undergrad, he worked on various topics including back
calculation of pavement layer moduli, environmental impact assessment, and water treatment
techniques. Growing up on the campus of one of India’s premier technological universities, he
was always inspired to be a researcher. After his undergrad, he joined Indian Institute of
Technology, Kharagpur for his masters. During his masters, he was involved in various
projects on pavement design, evaluation, and maintenance, and primarily worked on
performance evaluation of warm mix asphalt and half-warm mix asphalt mixtures. In 2012,
after a year at Kharagpur, he left the institute to start working under Dr. Akhtar Tayebali at
North Carolina State University on the use of recycled asphalt pavement materials in warm
mix asphalt mixtures as a master’s student. He received his Master of Science in Civil
Engineering degree from North Carolina State University in 2012. After his master’s degree,
he continued to work for his Ph.D. in civil engineering at North Carolina State University. For
his Ph.D. dissertation, he worked on developing alternative test methods to evaluate moisture
susceptibility in asphalt concrete mixtures. In addition to research and teaching, he is involved
in various STEM and K-12 outreach activities. In his free time, he likes playing sports, doing
ACKNOWLEDGMENTS
First I would like to sincerely thank my advisor and mentor, Dr. Akhtar Tayebali for
giving me an opportunity to work with him and for his constant support and guidance
throughout my graduate school. I am very thankful for the faith and trust he put in me. He has
always encouraged me to explore various professional and leadership avenues other than
research throughout my graduate school. He has always provided me with support and
guidance whenever I needed it. It was my honor and privilege to work with him and learn from
him throughout my graduate school.
I would like to thank Dr. Paul Khosla for his support and encouragement throughout
my graduate school. His advice and wisdom have been a great help for me to succeed in
graduate school. I am fortunate to have worked with Dr. Murthy Guddati, who has given a lot
of valuable inputs throughout my graduate school. I would also like to thank Dr. Abhinav
Gupta for his time, support and advice.
I thank the North Carolina Department of Transportation for funding this research
project. I thank the technical committee for the project and the staff of the Materials and
Testing Unit for their constant support and feedback throughout the project. I would also like
to thank Mr. James Budday for his help with the timely procurement of the materials and his
expertise and guidance throughout the project.
I would like to thank Mr. Ali Regimand, Dr. Andrew LaCroix, Mr. Christopher Bacchi,
I would like to thank Reza Rashetnia and Dr. Mohammad Pour-Ghaz for their
knowledge on nondestructive testing and impact resonance to develop an impact resonance
test method for the project.
I would like to sincerely thank my colleague and research mentor, Dr. Haritha Malladi.
Her constant help, support, and advice made my graduate school experience feel less burdened.
I would also like to thank my present and former colleagues Shivpal Yadav, Dr. Srikanth Sree
Ramoju, Dr. Haritha Musty, and Dr. Dinesh Ayyala for their support, help, and advice. I would
also like to thank Vivek Samu for his support and his expert advice on nondestructive testing.
I would like to especially thank Michael Elwardany and Sonja Pape for their advice,
ideas, and suggestions during lab testing. I would like to thank Payel Chatterjee, Divyamsh
Bosukonda and Arpit Sardana for their constant support.
Finally, I would like to thank my parents and my sister for their love, support, and
TABLE OF CONTENTS
LIST OF TABLES ……….. viii
LIST OF FIGURES ………... x
CHAPTER 1. INTRODUCTION ... 1
1.1 BACKGROUND AND NEED FOR STUDY ... 1
1.2 ORGANIZATION OF DISSERTATION ... 3
CHAPTER 2. LITERATURE REVIEW ... 4
2.1 MOISTURE SUSCEPTIBILITY ... 4
2.1.1 Visual Tests on Moisture Susceptibility ... 7
2.2 IMPACT RESONANCE ... 9
CHAPTER 3. RESEARCH APPROACH AND METHODOLOGY ... 13
3.1 RESEARCH OBJECTIVE ... 13
3.2 RESEARCH METHODOLOGY ... 13
CHAPTER 4. MATERIAL CHARACTERIZATION ... 16
4.1 AGGREGATES ... 16
4.2 ASPHALT BINDER... 21
4.2.1 Additives ... 21
4.3 COLORIMETER ... 22
CHAPTER 5. SUPERPAVE MIX-DESIGN ... 24
5.1 MIXTURE DESIGN ... 24
5.1.1 Aggregates ... 24
5.1.2 Asphalt Binder... 24
5.1.3 Air Void Calculation ... 25
5.1.4 Volumetric Properties ... 26
CHAPTER 6. TENSILE STRENGTH RATIO TEST ... 28
6.1 SPECIMEN PREPARATION ... 28
6.2 TEST PROCEDURE ... 29
6.3 MIXTURES ... 30
6.4 TEST RESULTS AND INTERPRETATION ... 30
CHAPTER 7. BOIL TEST ... 36
7.1 BOIL TEST MIXTURES ... 39
8.1 ESTIMATING TSR VALUE USING THE L*RT VALUES ... 56
CHAPTER 9. IMPACT RESONANCE TEST ... 59
9.1 DETECTING MOISTURE DAMAGE USING IMPACT RESONANCE (IR) TEST ... 61
9.1.1 Impact Resonance Test sensitivity to conditioning duration ... 62
9.1.2 Impact Resonance Test sensitivity to Warm Mix Asphalt ... 66
9.1.3 Impact Resonance vs TSR ... 68
CHAPTER 10. E* STIFFNESS RATIO TEST ... 71
10.1 ASPHALT MIXTURE PERFORMANCE TESTER (AMPT) ... 71
10.2 ESR TEST DESCRIPTION ... 72
10.3 SPECIMEN PREPARATION AND CONDITIONING ... 73
10.4 ESR TEST RESULTS ... 74
CHAPTER 11. PAVEMENT PERFORMANCE PREDICTION ... 79
11.1 PAVEMENT PERFORMANCE PREDICTION ... 84
CHAPTER 12. SUMMARY, CONCLUSIONS, AND RECOMMENDATION ... 89
12.1 CONCLUSIONS ... 90
12.2 RECOMMENDATIONS TO NCDOT ... 92
12.3 RECOMMENDATION FOR FURTHER STUDIES ... 93
REFERENCES ... 95
APPENDIX A – BOIL TEST PROCEDURE ... 104
APPENDIX B – GUIDELINES TO FIND OPTIMUM ANTISTRIP ADDITIVE FOR A MIXTURE ... 107
B.1 METHOD 1 – HIGHLY MOISTURE SENSITIVE CASES ... 107
B.1.1 Moisture Sensitive Aggregates ... 107
B.1.2 High Moisture Exposure ... 108
B.2. METHOD 2 – REGULAR SITUATIONS ... 109
APPENDIX C – REPEATABILITY OF QUANTIFICATION OF BOIL TEST USING COLORIMETER ... 111
APPENDIX D – PREPARING THIN DISK SPECIMENS ... 113
D.1 METHOD 1 – WITHOUT CUTTING A LARGE SPECIMEN ... 114
D.1.1 Preparing the base sample ... 114
D.1.2 Preparing the 25 mm height disk sample ... 114
D.2 METHOD 2 – CUTTING A LARGE SPECIMEN ... 115
D.3 CAUTIONS WHILE PREPARING AND HANDLING THIN DISK SAMPLES ... 115
D.3.1 Preparing the sample ... 115
LIST OF TABLES
TABLE 2-1MOISTURE SENSITIVITY TEST CATEGORIES (SOLAIMANIAN, ET AL.(2003)) ... 5
TABLE 2-2MOISTURE SENSITIVITY TESTS ON LOOSE SAMPLES (SOLAIMANIAN, ET AL.(2003)) ... 6
TABLE 4-1GRADATION FOR MANUFACTURED SAND FOR GARNER AGGREGATES ... 17
TABLE 4-2GRADATION FOR DRY SCREENINGS FOR GARNER AGGREGATES ... 18
TABLE 4-3GRADATION FOR 78MAGGREGATES FOR GARNER AGGREGATES ... 18
TABLE 4-4GRADATION FOR MANUFACTURED SAND FOR CRABTREE AGGREGATES ... 19
TABLE 4-5GRADATION FOR DRY SCREENINGS FOR CRABTREE AGGREGATES ... 19
TABLE 4-6GRADATION FOR 78MAGGREGATES FOR CRABTREE AGGREGATES ... 20
TABLE 5-1AIR VOID CONTENT,GMB, AND GMM FOR THE MIXTURES ... 26
TABLE 5-2SUMMARY OF VOLUMETRIC PROPERTIES ... 27
TABLE 6-1SUMMARY OF MIXTURES USED FOR TSRTEST ... 30
TABLE 6-2TENSILE STRENGTH VALUES FOR HMA1MIXTURE 24-HOUR CONDITIONING ... 31
TABLE 6-3TENSILE STRENGTH VALUES FOR HMA1MIXTURE 36-HOUR CONDITIONING ... 32
TABLE 6-4TENSILE STRENGTH VALUES FOR HMA1MIXTURE 48-HOUR CONDITIONING ... 32
TABLE 6-5TENSILE STRENGTH VALUES FOR HMA2MIXTURE ... 33
TABLE 6-6TENSILE STRENGTH VALUES FOR FOAMMIXTURE 24-HOUR CONDITIONING ... 33
TABLE 6-7TENSILE STRENGTH VALUES FOR CRABTREE 1MIXTURE ... 34
TABLE 6-8TENSILE STRENGTH VALUES FOR CRABTREE 2MIXTURE ... 34
TABLE 7-1SUMMARY OF THE MIXTURES USED FOR BOIL TEST ... 40
TABLE 7-2L* VALUES FROM COLORIMETER TEST ON DRY AND BOILED HMA1 MIXTURE ... 41
TABLE 7-3L*,L*RB AND CD*RB VALUES FOR HMA2 MIXTURE WITH ANTISTRIP ADDITIVE AND INCREASINGBOILING TIMES ... 44
TABLE 7-4L*,L*RB AND CD*RB VALUES FOR HMA3 MIXTURE WITHOUT ANTISTRIP ADDITIVE AND INCREASING BOILING TIMES ... 44
TABLE 7-5TSR,L* RT AND CD*RTVALUES FOR HMA3 MIXTURE WITHOUT ANTISTRIP ADDITIVE AND DIFFERENT CONDITIONING TIME ... 47
TABLE 7-6L*RB AND CD*RB VALUES BASED ON TSR VALUE AS ACCEPTANCE/REJECTION CRITERIA ... 51
TABLE 8-1TSR AND L*RT FOR NCDOTFIELD SPECIMENS FROM SOURCE 1 ... 53
TABLE 8-2TSR AND L*RT FOR NCDOTFIELD SPECIMENS FROM SOURCE 2 ... 53
TABLE 8-3TSR AND L*RT FOR HMA2 MIXTURE PREPARED IN LABORATORY ... 53
TABLE 8-4TSR AND L*RT FOR HMA3 MIXTURE PREPARED IN LABORATORY ... 54
TABLE 8-5TSR,L*RT, ESTIMATED TSR VALUES FOR MIXTURES PREPARED BY AN INDEPENDENT LABORATORY ... 56
TABLE 9-1RESONANCE FREQUENCY AND INDIRECT TENSILE STRENGTH VALUES FOR HMA3 MIXTURE ... 64
TABLE 11-1DYNAMIC MODULUS TEST RESULTS -7PERCENT AIR VOIDS (UNCONDITIONED) 80
TABLE 11-2DYNAMIC MODULUS TEST RESULTS -7PERCENT AIR VOIDS (CONDITIONED) ... 81
TABLE 11-3E*DATA FROM MASTERCURVES FOR USE AS M-EPDGINPUT (CONDITIONED) . 86
TABLE 11-4FATIGUE AND RUTTING FAILURE PREDICTION FOR TYPICAL 9.5BPAVEMENT
STRUCTURE (CONDITIONED) ... 87
TABLE 11-5FATIGUE AND RUTTING FAILURE PREDICTION FOR A WEAK PAVEMENT
LIST OF FIGURES
FIGURE 2-1CR400COLORIMETER (SOURCE:KONICA MINOLTA WEBSITE) ... 8
FIGURE 5-1DESIGN AGGREGATE GRADATION FOR THE MIXTURES ... 25
FIGURE 7-1TEXAS BOILING TEST RATING BOARD (KENNEDY, ET AL.1984) ... 37
FIGURE 7-2VISUAL DEPICTION OF THE LOSS OF ADHESION BETWEEN ASPHALT AND
AGGREGATE IN BOIL TEST ... 37
FIGURE 7-3VISUAL STRIPPING DUE TO BOIL TEST IN ASPHALT MIXTURES WITH DIFFERENT ADDITIVE CONTENT.THE TOP PICTURES ARE OF DRY ASPHALT MIXTURES AND THE BOTTOM ONES ARE OF BOILED ASPHALT MIXTURES.(L TO R):NO ANTISTRIP ADDITIVE,1.5%
ANTISTRIP ADDITIVE,2.5% ANTISTRIP ADDITIVE,3.5% ANTISTRIP ADDITIVE ... 41
FIGURE 7-4COMPARISON OF L* VALUES FOR ASPHALT CONCRETE MIXTURES WITH NO ADDITIVES AND DRY VIRGIN AGGREGATE TO THE L* VALUE OF PURE BLACK AND PURE WHITE COLOR ... 42
FIGURE 7-5VARIATION OF L*RB(%) DAMAGE WITH CHANGE IN ANTISTRIP ADDITIVE CONTENT
(%)... 43
FIGURE 7-6VARIATION OF CD*RB(%) DAMAGE WITH CHANGE IN ANTISTRIP ADDITIVE
CONTENT (%) ... 43
FIGURE 7-7VISUAL STRIPPING DUE TO BOIL TEST FOR HMA3 MIXTURE WITHOUT ANTISTRIP ADDITIVE FOR DIFFERENT BOILING TIMES.THE TOP PICTURES ARE OF DRY ASPHALT MIXTURES AND THE BOTTOM ONES ARE OF BOILED ASPHALT MIXTURES.(L TO
R):10-MINUTES BOILING,20-MINUTES BOILING,30-MINUTES BOILING. ... 45
FIGURE 7-8VARIATION OF L*RB(%) WITH CHANGE IN BOILING TIMES FOR HMA MIXTURES WITH ANTISTRIP ADDITIVE AND WITHOUT ANTISTRIP ADDITIVE ... 45
FIGURE 7-9VARIATION OF CD*RB(%) WITH CHANGE IN BOILING TIMES FOR HMA MIXTURES
WITH ANTISTRIP ADDITIVE AND WITHOUT ANTISTRIP ADDITIVE ... 46
FIGURE 7-10VISUAL STRIPPING DUE TO MOISTURE CONDITIONING USING AASHTOT283
PROCEDURE FOR TSRTEST IN HMA3 MIXTURE WITHOUT ANTISTRIP ADDITIVE WITH AN INCREASE IN CONDITIONING TIMES.THE UNCONDITIONED MIXTURE IS ON THE LEFT WHILE THE CONDITIONED MIXTURE IS ON THE RIGHT.(L TO R):24-HOUR CONDITIONING,
36-HOUR CONDITIONING,48-HOUR CONDITIONING. ... 47
FIGURE 7-11VARIATION OF TSR(%) VALUE WITH INCREASE IN CONDITIONING TIME DURING
TSRTEST FOR HMA MIXTURES WITHOUT ANTISTRIP ADDITIVE ... 48
FIGURE 7-12 RELATIONSHIP BETWEEN L*RT(%) AND TSR(%) WITH INCREASE IN
CONDITIONING TIME DURING TSRTEST FOR HMA MIXTURES WITHOUT ANTISTRIP
ADDITIVE. ... 49
FIGURE 7-13RELATIONSHIP BETWEEN CD*RT(%) AND TSR(%) WITH INCREASE IN
CONDITIONING TIME DURING TSRTEST FOR HMA MIXTURES WITHOUT ANTISTRIP
ADDITIVE. ... 49
FIGURE 8-2PLOT BETWEEN L*RT AND TSRRATIO FOR THE FIELD AND LABORATORY
SPECIMENS ... 55
FIGURE 8-3PLOT BETWEEN MEASURED TSRVALUES AND ESTIMATED TSRVALUES ... 57
FIGURE 8-4PLOT BETWEEN L*RT AND TSRRATIO FOR THE FIELD,NCSU LABORATORY, AND INDEPENDENT LABORATORY SPECIMENS ... 58
FIGURE 9-1IMPACT RESONANCE TEST SETUP ... 60
FIGURE 9-2SHIFTING OF THE PEAK (RESONANCE FREQUENCY) AS THE MOISTURE CONDITIONING INCREASES FOR HMA3 MIXTURE. ... 64
FIGURE 9-3RESONANCE FREQUENCY AND ITS VALUE WITH DURATION OF CONDITIONING ... 65
FIGURE 9-4PLOT OF ER(%) AND TSR(%) VERSUS THE DURATION OF MOISTURE CONDITIONING OF THE SAMPLES FOR HMA3 MIXTURE ... 66
FIGURE 9-5 ER AND TSR RATIO FOR HMA2 AND WMA MIXTURES AFTER 24 HOURS OF MOISTURE CONDITIONING ... 68
FIGURE 9-6RELATIONSHIP BETWEEN ELASTIC MODULUS RATIO AND TSR VALUES FOR ALL FIVE MIXTURES... 69
FIGURE 10-1SCHEMATIC DIAGRAM OF STRESS AND STRAIN IN ASPHALT CONCRETE ... 72
FIGURE 10-2GRAPH BETWEEN ESR AND TSRVALUES ... 78
FIGURE 10-3GRAPH BETWEEN ER AND TSRVALUES ... 78
FIGURE 11-1MASTERCURVE FOR HMA2 MIXTURE ... 82
FIGURE 11-2MASTERCURVE FOR FOAM MIXTURE ... 82
FIGURE 11-3MASTERCURVE FOR CRABTREE MIXTURE WITH LOF6500 ... 83
FIGURE 11-4MASTERCURVE FOR CRABTREE MIXTURE WITHOUT LOF6500 ... 83
FIGURE 11-5NCDOTPAVEMENT LAYER STRUCTURE FOR PERFORMANCE PREDICTION ... 84
FIGURE 11-6WEAKER PAVEMENT LAYER STRUCTURE ... 87
Chapter 1.
Introduction
1.1 Background and Need for Study
Warm Mix Asphalt (WMA) technologies are being used more commonly in pavement
construction, as they are more cost effective and/or produce lower emissions. Two
methodologies used in the production of foaming based WMA, i.e., Double Barrel® foamed
technology and Zeolite additives such as Advera, add moisture to the mix to achieve lower
mixing and compaction temperatures compared to that of Hot Mix Asphalt (HMA) mixes.
Using WMA results in economic and environmental benefits due to lower energy demand
during production and reduced emissions at the plant and with the paving during construction.
However, concerns remain regarding the moisture susceptibility for these mixes and its effect
on pavement performance.
Moisture Susceptibility is an important parameter during the asphalt concrete mix
design. That is because moisture susceptible asphalt mixtures lead to stripping of asphalt from
aggregate and is a major cause of asphalt pavement distresses leading to premature failure of
the pavement. Therefore, evaluating the resistance to moisture susceptibility is an important
and integral step in the asphalt mixture design process.
NCDOT requires that the moisture sensitivity criteria be met for the job mix formula
to be approved. Currently, the NCDOT uses only the tensile strength ratio (TSR) test to
manufactured using new technologies such as WMA mixtures. There have been instances
where WMA mixtures produced using foaming-based technologies have failed the moisture
sensitivity specifications; even when antistrip additives were used. However, field
performance of these mixtures has been observed to be comparable to the performance of the
conventional HMA mixtures. Therefore, the validity of using the current TSR test to evaluate
moisture susceptibility of WMA mixtures is in question. There is a need to either modify the
current TSR test protocol or develop an entirely new test(s) that is applicable to all asphalt
mixtures for moisture sensitivity evaluation.
There are many reasons for the discrepancy between the TSR test results and the field
performance. Some of these factors are listed below:
1. The moisture conditioning procedure in the AASHTO T283 specifications, which the
TSR test follows, does not adequately simulate the conditions to which foaming-based
WMA mixes are subjected in the field.
2. The indirect tensile strength (IDT) test used to determine the TSR is not a reliable test
method for determining the moisture susceptibility of foaming-based WMA mixes.
3. The foaming-based WMA mixture’s state at the time that TSR measurements are taken
(i.e., the mixture’s state when it is obtained during the paving process) is different from
the state the WMA mixture is in for its longer-term performance when moisture is
present.
The proposed research investigated possible modifications to the current TSR test protocol
and proposed new tests for not only foaming-based WMA mixtures but also applicable to all
1.2 Organization of Dissertation
This dissertation presents a brief literature review in chapter 2; followed by research
methodology and material characterization in chapters 3 and 4, respectively. Chapters 5
presents the Superpave mix design verification, followed by the traditional TSR test results
presented in chapter 6. Chapters 7 and 8 present the quantitative interpretation of Boil Test
results and use of colorimeter for quantitative interpretation of the TSR test results,
respectively. The impact resonance (IR) test and its results are presented in chapter 9. Chapter
10 presents the stiffness ratio from the AMPT test, and the pavement performance evaluated
using the dynamic stiffness obtained in chapter 10 is presented in chapter 11. Summary,
Chapter 2.
Literature Review
In the field of asphalt mixture and pavement design, moisture susceptibility of
asphalt-aggregate mixtures and the asphalt-asphalt-aggregate compatibility are very important issues. That is
because moisture susceptible asphalt mixtures lead to stripping of asphalt from aggregate,
which is a major cause of asphalt pavement distress, and is one of the leading cause of
premature failure in the pavement. No asphalt mixture design process is complete without the
final step to ascertain that the mixture is adequately resistant to potential moisture damage.
Research for finding a solution to evaluate the moisture damage in asphalt concrete or stripping
of asphalt has been conducted for many years. Yet, the search to find a simple, practical and
reliable solution is still going on.
2.1 Moisture Susceptibility
Solaimanian, et al. [1] and Mehrara et al. [2] have summarized a considerable list of
research done on this topic to date. Mehrara et al. [2] have a comprehensive summary of all
the test methods used to determine the amount of stripping in asphalt concrete. They divided
the test methods into five different categories – tests on loose mixtures, destructive mechanical
tests on asphalt concrete, nondestructive mechanical tests on asphalt concrete, energy methods
and nondestructive non-mechanical tests. According to them, most tests on loose mixtures
except for the boil test do not consider the stripping potential of the whole gradation in a
mixture. The tests on loose mixtures are simple, fast and low-cost approaches to the problem.
qualitative visual subjective tests, and 2) quantitative strength tests, that are listed in Table
2-1. Various moisture sensitivity tests on loose mixture samples are presented in Table 2-2.
Table 2-1 Moisture Sensitivity Test Categories (Solaimanian, et al. (2003))
The visual subjective test The quantitative strength tests
1. Boiling water test 1. Immersion–compression test
2. Freeze–thaw pedestal test 2. Indirect tensile test
3. Quick bottle test 3. Marshall immersion test
4. Rolling bottle method 4. Double punch method 5. Resilient modulus tests
From the tests listed in the tables, tensile strength ratio (TSR) test is the most commonly
used test to evaluate moisture susceptibility. TSR test uses the ratio of the indirect tensile
strength of dry specimens and moisture conditioned specimens to evaluate moisture
susceptibility. However, the shortcoming of the TSR test is evident when determining the
moisture susceptibility of mixtures produced with Warm Mix Asphalt Technology (WMA),
specifically the foaming based technology. Studies done at NC State University (NCSU) and
nationally have shown that foaming-based WMA asphalt mixes often fail the TSR
specifications requirements yet do not show any significant deterioration in performance as
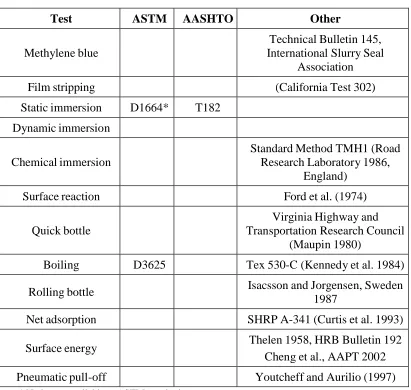
Table 2-2 Moisture Sensitivity Tests on Loose Samples (Solaimanian, et al. (2003))
Test ASTM AASHTO Other
Methylene blue
Technical Bulletin 145, International Slurry Seal
Association
Film stripping (California Test 302)
Static immersion D1664* T182 Dynamic immersion
Chemical immersion
Standard Method TMH1 (Road Research Laboratory 1986,
England)
Surface reaction Ford et al. (1974)
Quick bottle
Virginia Highway and Transportation Research Council
(Maupin 1980)
Boiling D3625 Tex 530-C (Kennedy et al. 1984)
Rolling bottle Isacsson and Jorgensen, Sweden
1987
Net adsorption SHRP A-341 (Curtis et al. 1993)
Surface energy Thelen 1958, HRB Bulletin 192
Cheng et al., AAPT 2002 Pneumatic pull-off Youtcheff and Aurilio (1997)
*No longer available as ASTM standard.
Due to this contradiction, there is a need to investigate the issue of evaluating moisture
sensitivity of foaming-based WMA mixes. The effectiveness of any moisture sensitivity test(s)
will depend on three distinct aspects: 1) sample preparation method, 2) moisture conditioning
Lee et al. [3] have reported that adhesive failure between the aggregate and asphalt
binder mainly causes moisture damage. They also reported that tensile stress is the most
suitable state of stress to test the adhesive properties at the interface of two materials. They
found that the direct tension test is the simplest form of a test method that measures the tensile
properties of a material. The NCHRP 9-26A [4] project results suggest that the use of cyclic
direct tension tests that employ cored and cut specimens should be investigated for moisture
susceptibility evaluation, because such tests may be able to overcome the high variability of
air void distribution in the specimens and high variability in the strength test results for
compressive mode testing.
2.1.1 Visual Tests on Moisture Susceptibility
Tayebali et al. [5] and Lee et al. [3] have successfully shown the degradation of
dynamic shear and axial modulus, respectively, due to moisture damage and its effect on
pavement design. Lee et al. have also shown the effect of moisture damage on fatigue life of
asphalt mixes in a direct tension test. In addition, they have successfully employed digital
imaging technique to quantify visual effects of moisture damage on fractured surfaces from
fatigue testing. Lee et al. reported that visual observation using digital imaging using mesh
selection method is accurate, but it is also a relatively time-consuming approach to determine
the stripping percentage. Another promising method for the visual determination of stripping
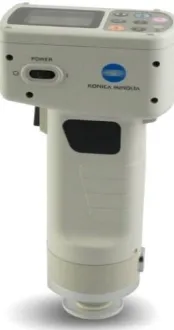
percentage may be the use of Spectrophotometer (Colorimeter, Chroma Meter) that is
Figure 2-1 CR 400 Colorimeter (Source: Konica Minolta Website)
Wistuba, et al. [6], Liu, et al. [7], Apeagyei, et al. [8] and Zhang, et al. [9] have used
quantitative strength test approach by calculating bond energy, surface energy or other
physiochemical properties on loose mixtures to quantify stripping in asphalt concrete. Other
studies conducted by Kennedy et al. [10]; Pavol, et al. [11]; Amelian, et al. [12], and Bayazit
et al. [13] have tried to visually evaluate stripping in loose asphalt mixtures, either through
visual observation or other computerized image processing techniques.
This study focuses on using the colorimeter to evaluate stripping in asphalt concrete
for the boil test and TSR tests. This study also introduces a new way to quantify the results
from visually subjective test methods like the asphalt boil test. Additionally, the study
correlates the moisture sensitivity results from the impact resonance test to the TSR test and
2.2 Impact Resonance
While in TSR test, the indirect tensile strength is used, the damage in asphalt concrete mixture
may also be quantified by measuring the dynamic elastic modulus. It is well established that
the dynamic elastic modulus of materials can be estimated using wave propagation or vibration
based methods. In many instances, however, calculating the absolute values of dynamic elastic
modulus using these methods can be difficult due to the geometry and boundary conditions of
the specimen tested. Therefore, generally, wave propagation and vibration based methods are
used to estimate the ratio of dynamic elastic moduli of materials, before and after damage, by
calculating the ratio of wave travel time in wave propagation or resonance frequency in
vibration based methods. For example, the square ratio of the resonance frequency of Portland
cement concrete prisms, before and after exposure to freeze-thaw loading, is used as a measure
of reduction in dynamic elastic modulus (ASTMC666 2008). Methods for measuring the
vibration response and resonance frequency of materials are discussed in (ASTM E 1876-09
2009). Similarly, square of the ratio of the wave travel time is used as a measure of reduction
in elastic modulus in concrete materials (Li et al. [14], Ghasemzadeh et al. [15], and Rashetnia
et al. [16]).
In certain circumstances, i.e., for a specific geometry with specific boundary conditions, under
certain assumptions, the actual (absolute) value of the elastic modulus can be estimated from
the vibration response of the material. For example, Kweon and Kim [17, 18] used cylindrical
[21-28] in estimating the dynamic elastic modulus of Portland cement concrete. Ryden [29,
30] used thick disk geometry to determine the mastercurve for asphalt concrete. Similarly,
LaCroix et al. [31] used cylindrical geometry for determining the mastercurve. Gudmarsson et
al. [32, 33] used acoustic spectroscopy technique on asphalt concrete beams with a rectangular
cross-section to estimate their dynamic elastic modulus.
Like vibration-based tests, under certain assumptions, the dynamic elastic modulus can be
estimated from acoustic and ultrasonic wave propagation measurements. For example,
Norambuena-Contreras et al. [34] and Mounier et al. [35] used ultrasonic measurements to
estimate elastic modulus of asphalt concrete and Van Velsor et al. [36] used ultrasonic testing
for measuring complex modulus of asphalt concrete.
The above mentioned works clearly show that both vibration based and wave propagation
based methods can be used to determine the dynamic elastic modulus of asphalt concrete. One
of the research questions of this project was whether the change in dynamic elastic modulus,
as opposed to the change in the indirect tensile strength, can be used to quantify the
susceptibility of asphalt mixtures to moisture damage. To answer this question, we utilized the
so-called axisymmetric flexural vibration of a thick free circular plate [20] to measure the
elastic modulus of asphalt concrete disks of different composition subjected to various levels
of moisture conditioning. We also investigated whether this method can effectively quantify
the effect of aging and temperature on the dynamic elastic modulus of asphalt materials. We
note here that this method, axisymmetric flexural vibration of a thick free circular plate, has
been previously used for estimating dynamic elastic modulus of Portland cement concrete [21],
freeze-thaw loading [16]. This method was also used by Kim and Kim [19] and Ryden [29, 30] to
estimate the dynamic elastic modulus of asphalt concrete. The method in question, however,
has not been used to quantify the effect of moisture damage in asphalt concrete. In this study,
we investigated whether linear impact resonance shift can be used to determine the moisture
sensitivity of the WMA mixtures. To this end, the axisymmetric flexural impact resonance
technique is applied to the asphalt concrete disks to quantify moisture damage [16].
In short, in axisymmetric flexural vibration test, the resonance frequency of a thick freely
vibrating circular disk is measured using an accelerometer under the influence of a slight
impact. The resonance frequency is used then, to compute elastic modulus. The presence of
moisture damage will, in principle, result in the shift of the frequency of vibration, which in
turn translates, into a reduction in elastic modulus.
The axisymmetric flexural impact resonance technique quantifies the damage level based on
the change in the resonance frequency of materials and frequency spectrum bandwidth change.
This vibration-based method provides the vibration response of the specimen and carries the
global response to it [17]. The proposed technique lets us deal with disk geometries that are
desirable geometry and applicable to test the cores from constructed facilities. Linear elastic
wave propagation based methods measure the local response of the material that does not lead
to evaluate distributed changes in the material. However, the axisymmetric flexural impact
resonance technique as a vibration-based method leads us to measure the global response
method requires impact resonance measurement experiment and computation of the frequency
resonance parameter to solve axisymmetric flexural vibration of asphalt concrete disks. The
sensitivity of the elastic modulus estimation to the temperature and age of specimens are
discussed. Comparison of the proposed method to the conventional TSR test is elaborated in
Chapter 3.
Research Approach and Methodology
3.1 Research Objective
The primary objectives of the research were:
(1) To explore modifications to the current TSR test protocol or to develop alternative test
methods that can be used in lieu of TSR tests;
(2) To evaluate the viability of the use of impact resonance (IR) technology along with
colorimeter analysis in assessing moisture damage;
(3) To evaluate the stiffness, pavement fatigue and rutting performance of the
foaming-based WMA and the HMA mixes in a moisture-conditioned state so that the actual
degradation of these mixes can be compared directly to the results from TSR and
indirect tensile (IDT) strength tests.
3.2 Research Methodology
The objectives of the proposed study were accomplished through the following specific tasks:
Task 1. Literature Review: An exhaustive literature review on various test methods to evaluate
moisture sensitivity was done. The test methods were divided into different categories based
on the literature. The pros and cons of each category were examined and a simple test method
to evaluate moisture sensitivity of asphalt concrete was selected. A literature review was done
on various approaches to visual quantification of stripping in asphalt concrete mixtures.
Task 2. Materials: The aggregates used in this study were from two different sources. The
aggregates (granite) from one source were relatively less moisture sensitive, and the aggregates
(Crabtree Valley) from the other source were highly moisture sensitive. These sources were
chosen based on previous experiences of working with asphalt concrete mixtures made using
the aggregates from these sources. A foaming device manufactured by Pavement Technology,
Inc., The Foamer, was used to prepare WMA mixtures manufactured using foaming
technology. Additionally, two different antistrip additives were used in this study – one is a
proprietary antistrip additive while the second was LOF 6500 that is commonly used in the
mixtures in North Carolina.
Task 3. Visual Quantification of stripping: From the literature review, it was found that many
researchers used the asphalt boil test or one of its variations to come up with test methods to
visually quantify stripping in asphalt concrete mixtures. In this study, a different approach was
used on the asphalt boil test to quantify stripping by using a colorimeter.
Task 4. Impact Resonance and Colorimeter Analysis: This task involved the determination of
the level of stripping (moisture induced damage intensity) in visually quantifiable term based
on the use of colorimeter, as well as mechanically quantifiable value based on impact
resonance testing. The impact resonance testing was used to assess moisture damage on
samples conditioned based on the modified AASHTO T283 procedure. The colorimeter device
was used on the exposed surfaces of the cracked TSR test samples as well as on loose mixture
in the asphalt boil test to evaluate moisture damage.
Task 5. Investigation of Moisture Damage Using Performance Test: In this task, the dynamic
evaluate moisture damage of HMA as well as WMA mixtures. The results were compared to
the moisture damage results from the TSR test. The dynamic modulus data from the AMPT
test were used to evaluate the impact of moisture damage on typical NC Pavement's
performance and its impact on pavement thickness design.
Task 6. Development of Recommended Moisture Susceptibility Test Protocol(s): This task
presents a recommendation for a new or refined moisture susceptibility test protocol based on
Chapter 4.
Material Characterization
PG 64-22 binder, granite aggregates and pond fines passing 75µm were used in this
study. The aggregates were from two different quarries – Garner, NC and Crabtree, NC. Details
about the materials used in the study are presented below. Two different anti-strip additives
were used in this study to prepare the mixtures – LOF 6500 (0.75% by weight of binder) and
a proprietary antistrip additive (varying percentages).
4.1 Aggregates
The aggregates were obtained from two different sources. The aggregates from
Crabtree Quarry were highly moisture sensitive. The aggregates from the Garner Quarry were
relatively less susceptible to moisture damage. The mixtures used in this study were designed
for 9.5B (12.5 mm NMSA) surface course mixture. Three aggregates stockpiles were used for
both the sources. The stockpile gradation and bulk specific gravity for these stockpiles
specified in JMF were verified.
Representative samples from three stockpiles were used to verify the gradation of the
aggregate stockpiles. ASTM C136-06, “Standard Test Method for Sieve Analysis of Fine and
Coarse Aggregates” [42] and ASTM C117-04, “Standard Test Method for Materials Finer than
75-µm (No. 200) Sieve in Mineral Aggregates by Washing” [43] procedures were used to do
a washed sieve analysis on the dried representative samples to find out the gradation of the
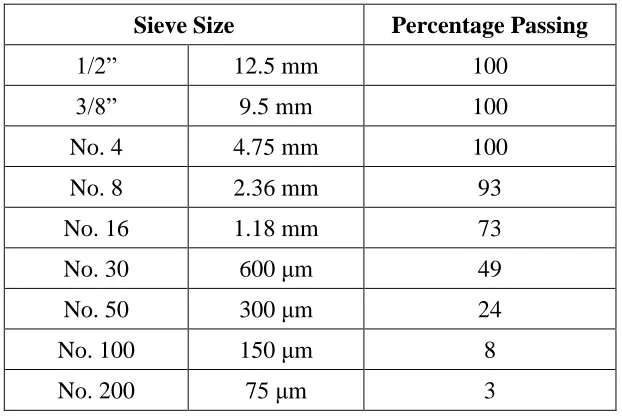
The gradation of Manufactured Sand, Dry Screening and 78 M for the Garner aggregate
source as determined are shown in the Tables 4-1 to 4-3. The gradation of Manufactured Sand,
Dry Screening and 78 M for the Crabtree aggregate source as determined are shown in the
Tables 4-4 to 4-6. Variability for the samples was low for all three stockpiles from both the
aggregate sources. However, the overall gradation for the three stockpiles from the Garner
quarry differed from that given in the JMF by a small extent. Thus, the gradation results as
determined in the laboratory were used for preparing samples for further testing. For the
Crabtree quarry materials, the JMF gradation was used. In addition to the three stockpiles,
pond fines were used in the amount of 1.5% by weight of total aggregate that replaced the No.
200 passing virgin aggregates to increase the moisture susceptibility of the mixtures.
Table 4-1 Gradation for Manufactured Sand for Garner Aggregates
Sieve Size Percentage Passing
1/2” 12.5 mm 100
3/8” 9.5 mm 100
No. 4 4.75 mm 100
No. 8 2.36 mm 93
No. 16 1.18 mm 73
No. 30 600 μm 49
No. 50 300 μm 24
No. 100 150 μm 8
Table 4-2 Gradation for Dry Screenings for Garner Aggregates
Sieve Size Percentage Passing
1/2” 12.5 mm 100
3/8” 9.5 mm 100
No. 4 4.75 mm 97
No. 8 2.36 mm 77
No. 16 1.18 mm 59
No. 30 600 μm 44
No. 50 300 μm 30
No. 100 150 μm 19
No. 200 75 μm 12
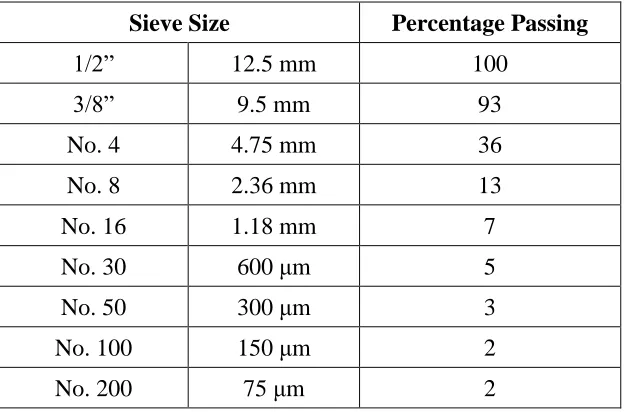
Table 4-3 Gradation for 78M Aggregates for Garner Aggregates
Sieve Size Percentage Passing
1/2” 12.5 mm 100
3/8” 9.5 mm 93
No. 4 4.75 mm 36
No. 8 2.36 mm 13
No. 16 1.18 mm 7
No. 30 600 μm 5
No. 50 300 μm 3
No. 100 150 μm 2
Table 4-4 Gradation for Manufactured Sand for Crabtree Aggregates
Sieve Size Percentage Passing
1/2” 12.5 mm 100.0
3/8” 9.5 mm 100.0
No. 4 4.75 mm 100.0
No. 8 2.36 mm 85.0
No. 16 1.18 mm 66.0
No. 30 600 μm 49.0
No. 50 300 μm 30.0
No. 100 150 μm 11.4
No. 200 75 μm 3.3
Table 4-5 Gradation for Dry Screenings for Crabtree Aggregates
Sieve Size Percentage Passing
1/2” 12.5 mm 100.0
3/8” 9.5 mm 100.0
No. 4 4.75 mm 100.0
No. 8 2.36 mm 80.0
No. 16 1.18 mm 52.0
No. 30 600 μm 37.0
No. 50 300 μm 28.0
No. 100 150 μm 19.0
Table 4-6 Gradation for 78M Aggregates for Crabtree Aggregates
Sieve Size Percentage Passing
1/2” 12.5 mm 100.0
3/8” 9.5 mm 92.0
No. 4 4.75 mm 38.0
No. 8 2.36 mm 7.0
No. 16 1.18 mm 3.0
No. 30 600 μm 2.0
No. 50 300 μm 2.0
No. 100 150 μm 2.0
No. 200 75 μm 1.4
To calculate the bulk specific gravity of the aggregate gradation, the aggregates from
each aggregate stockpile were divided into coarse and fine aggregates using the US Standard
#4 sieve (4.75 mm). The bulk specific gravities of the coarse and fine aggregate portions were
calculated separately and then a combined specific gravity was calculated using them. For pond
fines, the bulk specific gravity provided by the quarry was used. The bulk specific gravity of
the coarse aggregates was calculated per the procedure outlined in AASHTO T 85-14,
“Standard Method of Test for Specific Gravity and Absorption of Coarse Aggregate”, [44]
while the guidelines mentioned in AASHTO T 84-13, “Standard Method of Test for Specific
Gravity and Absorption of Fine Aggregate” [45] were used to calculate the bulk specific
gravity of the fine aggregate portion. The combined specific gravity for an aggregate stockpile
was calculated using the following equation.
100
𝐺𝑠𝑏 =
𝑐
𝐺𝑐
+ 𝑓
Where,
c = percentage of the coarse aggregate of the total aggregate
f = percentage of fine aggregate
Gc = specific gravity of Coarse aggregate fraction
Gf = specific gravity of Fine aggregate fraction
The bulk specific gravity for the total aggregates was calculated using the blend ratio
of the stockpiles and their corresponding bulk specific gravities. The blend ratio was calculated
using all the three aggregate stockpiles in addition to the pond fines. The bulk specific gravity
of the aggregates from Garner Quarry came out to be 2.640 and for the aggregates from
Crabtree Quarry came out to be 2.664
4.2 Asphalt Binder
Superpave Performance grade PG 64-22 asphalt binder was used in this study. NuStar
Asphalt Refining Company located in River Road Terminal, Wilmington, NC, provided the
binder. The manufacturer reported the specific gravity of the binders as 1.034.
4.2.1 Additives
Use of an anti-strip additive, 0.75% by weight of binder was recommended in the JMF
for all mixtures. The anti- strip additive used in this study was AD-here® LOF 6500,
manufactured by ArrMaz Custom Chemicals. Additionally, a proprietary antistrip additive was
4.3 Colorimeter
In this research study, a commonly available colorimeter device (also known as
“Chroma Meter”) – CR400 (Konica Minolta) shown in Figure 2-1 was used. There are many
other similar devices manufactured and sold by other companies that could also be used
effectively. An ASTM standard ASTM E284-13b [46] – Standard Terminology of Appearance
exists and was used to define color.
Color perception, simultaneous contrast and chameleon effect, are the three main
effects that “deceive” the color perception, based on hue, background on which the sample is
placed on, and the light source under which the sample is being observed. Due to these reasons,
the human eye can view the same color differently under different conditions, and hence leads
to the qualitative subjective interpretation of boil and other tests.
The use of colorimeter eliminates this human bias in color perception. In the
colorimeter test, the background, hue and the light source is controlled. A standard light source
that is emitted from the colorimeter device is used while measuring the color of the specimen.
The background color effect is eliminated by placing the colorimeter’s measuring orifice on
the specimen such that the sample or the specimen is completely enclosed within the orifice of
the colorimeter device.
ASTM E284-13b Standard elaborates several ways under the heading of “Chroma” to
measure and analyze the colors. In this study, the most widely used CIE L*, a*, and b* method
was used where the color is plotted on a graph with L*, a*, and b* as their axes. The L* axis
determines the color index on light to dark axis; a* determines the redness to greenness index,
standard white color. Before the use of the colorimeter for measurements, the device is
calibrated using a standard white color calibration plate provided with the colorimeter.
Additional accessories may be required to protect the light from escaping the device while
taking readings on uneven samples. This is because some samples such as broken half of TSR
samples will not likely have a uniform surface. Although, the comparison (color readings) can
be done based on different color measurement scales or combination with respect to L*, a*,
and b* readings; in this study, the results are analyzed and presented based on only the L*
readings that measure color index based on gray scale. However, when colored aggregates or
the asphalt cement is used, a more complex approach can be used that include a* and b*
Chapter 5.
Superpave Mix-Design
This chapter describes the Superpave mix design method of the four mixtures used in
this study. The optimum asphalt content given in the JMF was used for prepared specimens
with aggregates from Garner Quarry and Crabtree Quarry using the Superpave mix design
method. The volumetric properties were verified for the corresponding FOAM mixture for the
mix produced using aggregates from Garner Quarry.
5.1 Mixture Design
5.1.1 Aggregates
All the mixtures were designed as Asphalt Concrete Surface Course, type NCDOT RS
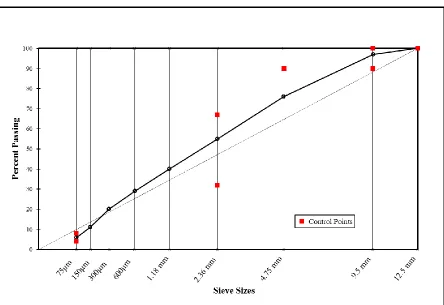
9.5B mixtures. The design aggregate gradation was provided in the JMF for mixtures and is
shown in Figure 5-1. A blend ratio for the three aggregate stockpiles and the pond fines was
calculated such that the resultant gradation was close to the target gradation and within all the
control points.
5.1.2 Asphalt Binder
The mixing and compaction temperatures for the hot mix asphalt were provided by
NCDOT for the 9.5 B mix. The mixing and compaction temperatures for PG 64-22 were 163°C
(325°F) and 149°C (300°F), respectively.
Per NCHRP Report 714 [47], mixing and compaction temperatures of WMA mixtures
cannot be calculated based on rotational viscosity test results and hence the temperatures
Foamer have mixing and compaction values around 135°C (275°F) and 120°C (248°F)
respectively, these values were selected as the mixing and compaction temperatures in this
study.
Figure 5-1 Design aggregate gradation for the mixtures
5.1.3 Air Void Calculation
The theoretical maximum specific gravity (Gmm) was calculated according to AASTO
T 209 - 05, “Standard Method of Test for Theoretical Maximum Specific Gravity and Density
Bulk Specific Gravity and Density of Compacted Asphalt Mixtures Using Automatic Vacuum
Sealing Method,” [49] was used to calculate the bulk specific gravity (Gmb) of the compacted
asphalt mixture specimens. A CoreLok® device manufactured by InstroTek Inc. was used to
vacuum seal the compacted asphalt mixtures for measuring the bulk specific gravity.
The percentage air voids were calculated using the calculated Gmm and Gmb values as
per the following equation.
% 𝐴𝑖𝑟 𝑉𝑜𝑖𝑑𝑠 = 𝐺𝑚𝑚− 𝐺𝑚𝑏
𝐺𝑚𝑚
The Gmm, Gmb, and the percent air void values for the mixtures with their asphalt content
are given in Table 5-1.
Table 5-1 Air void content, Gmb, and Gmm for the mixtures
Mixture Type Average Gmm Measured
Gmb
Air void content
Optimum Asphalt Content
HMA 2.425 2.330 3.9 6.0
FOAM 2.410 2.316 3.9 6.0
Crabtree w/LOF 2.430 2.331 4.1 6.4
Crabtree w/o LOF 2.430 2.326 4.3 6.4
5.1.4 Volumetric Properties
Volumetric properties required for the Superpave mix design were calculated for the
HMA using the asphalt content as per the NCDOT QMS Manual. The calculated properties
were checked with the design requirements specified in Superpave. The design limits for
as specified in the JMF. All volumetric properties were within the limits. Per NCHRP Report
691 [50], the mix design process for WMA mixtures is same as that of HMA mixtures.
Therefore, the volumetric properties requirements for WMA are same as that of HMA. The
volumetric properties of all the four mixtures were within the design limits.
The volumetric properties of all the mixtures are summarized in Table 5-2.
Table 5-2 Summary of Volumetric Properties
Mix Properties at Ndesign
Asphalt Concrete Mix Technology
Volumetric Requirements
HMA FOAM Crabtree w/LOF
Crabtree no LOF Gmb @ Ndesign 2.330 2.316 2.331 2.326
Max. Specific Gravity, Gmm 2.425 2.410 2.430 2.430
% VTM 3.9 3.9 4.1 4.3 4.0 ± 0.5
% VMA 17.0 17.5 18.45 18.28 > 15.0%
% VFA 64.8 65.8 76.80 77.92 65-78%
% Gmm at Nini (7) 89.5 89.5 89.2 88.1 ≤ 89.0%
Chapter 6.
Tensile Strength Ratio Test
This section details the mixtures for which the Tensile Strength Ratio (TSR) was measured.
The test was performed per the guidelines specified by NCDOT, which is a modification of
the AASHTO T 283, “Standard Method of Test for Resistance of Compacted Hot Mix Asphalt
(HMA) to Moisture-Induced Damage.” TSR test is the standard test used by various
Transportation agencies including NCDOT to evaluate moisture sensitivity. Therefore, it was
used as a basis to compare with the results from other moisture susceptibility tests – boil test
and impact resonance test.
6.1 Specimen Preparation
The TSR test requires two sets of specimens for every mixture. One set was tested dry,
while the other set was saturated before testing. Five specimens were prepared for each set and
hence 10 specimens were prepared for each mixture. The specimens were prepared as per the
standard specifications and were compacted to a target air void content of 7 ± 0.5%. The
standard specimen dimensions were 150 mm diameter and 95 ± 5 mm height. The specimens
were prepared using the same aggregate gradation that was used for mix design and the
optimum asphalt content using the Superpave mix design.
As per standard specifications, the loose mixtures were prepared at their respective
mixing temperatures (163°C for HMA and 136°C for WMA). After mixing, the mixtures were
for WMA) and then compacted to a height of 95 ± 5 mm using the Superpave gyratory
compactor.
6.2 Test Procedure
Two specimens whose air voids had the most deviation from the targeted value of 7.0%
were eliminated from the 10 specimens for each mixture. The 8 specimens for each mixture
were divided randomly into two sets of 4 specimens each. One set was kept dry and tested at
room temperature i.e. 25 °C (77 °F), while the other set was moisture conditioned before
testing. As per the NCDOT specifications, the set of specimens that were to be moisture
saturated were first vacuum-saturated with water to a saturation level of 70 – 80% and then
conditioned in a water bath at 60°C for 24 hours. After the 24 hours of conditioning, they were
cooled for two hours in a water bath at 25 °C (77 °F).
The specimens were set up in a loading jig and load was applied diametrically using a
Marshall Loader. They were loaded at a rate of 50.8 mm (2 in.) per minute and the peak load
vs deflection data was recorded in a graph. The peak load for each specimen was noted and the
indirect tensile strength of the specimen was calculated using the peak load. The median value
of the indirect tensile strengths of each set of specimens (conditioned and unconditioned) was
taken as the representative indirect tensile strength value of that set. The tensile strength ratio
was then calculated for each mixture by taking the ratio of the average indirect tensile strength
𝑇𝑆𝑅 = 𝐼𝑇𝑆𝑐𝑜𝑛𝑑𝑖𝑡𝑖𝑜𝑛𝑒𝑑 𝐼𝑇𝑆𝑢𝑛𝑐𝑜𝑛𝑑𝑖𝑡𝑖𝑜𝑛𝑒𝑑
NCDOT requires all its mixtures to pass a minimum TSR value of 85%.
6.3 Mixtures
The TSR test was done on five different mixtures. Three mixtures were prepared using
the materials from the Garner Quarry and two mixtures were prepared using materials from
Crabtree Quarry. The five mixtures are detailed in Table 6-1. Mixtures HMA 1, HMA 2 and
HMA 3 were prepared using the materials from Garner Quarry. Crabtree 1 and Crabtree 2 were
prepared using the materials from Crabtree Quarry.
Table 6-1 Summary of mixtures used for TSR Test
Mixture Additive Type Additive Dosage (%)
Conditioning Time (hours)
HMA 1 None None 24, 36, 48
HMA 2 LOF6500 0.75 24
FOAM None None 24
Crabtree 1 LOF6500 0.75 24
Crabtree 2 None None 24
6.4 Test Results and Interpretation
The peak load for a specimen was calculated using the correction factors for the Marshall
loader and the peak load reading from the graph. This peak load was used to calculate the ITS
value using the following equation.
where,
ITS = Indirect Tensile Strength (kPa or psi)
P = Peak Load (kg or lbs)
d = diameter of the specimen (mm or in)
h = height of the specimen (mm or in)
The ITS values for all the specimens were calculated and tabulated.
Tables 6-2 to 6-8 show the TSR test results for all the mixtures.
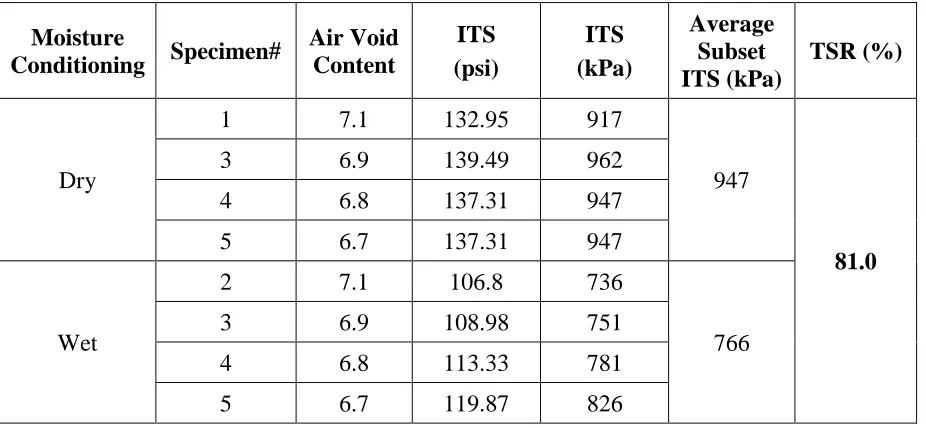
Table 6-2 Tensile Strength Values for HMA 1 Mixture 24-hour conditioning
Moisture
Conditioning Specimen#
Air Void Content
ITS (psi)
ITS (kPa)
Average Subset ITS (kPa)
TSR (%)
Dry
1 7.1 132.95 917
947
81.0
3 6.9 139.49 962
4 6.8 137.31 947
5 6.7 137.31 947
Wet
2 7.1 106.8 736
766
3 6.9 108.98 751
4 6.8 113.33 781
Table 6-3 Tensile Strength Values for HMA 1 Mixture 36-hour conditioning Moisture Conditioning Specimen# Air Void Content ITS (psi) ITS (kPa) Average Subset ITS (kPa) TSR (%) Dry
1 7.1 132.95 917
947
50.8
3 6.9 139.49 962
4 6.8 137.31 947
5 6.7 137.31 947
Wet
1 6.6 78.46 541
481
2 6.6 65.39 451
4 6.5 69.74 481
5 6.7 69.74 481
Table 6-4 Tensile Strength Values for HMA 1 Mixture 48-hour conditioning
Moisture Conditioning Specimen# Air Void Content ITS (psi) ITS (kPa) Average Subset ITS (kPa) TSR (%) Dry
1 7.1 132.95 917
947
31.7
3 6.9 139.49 962
4 6.8 137.31 947
5 6.7 137.31 947
Wet
1 6.9 47.95 331
301
2 6.8 45.77 316
3 6.9 41.41 286
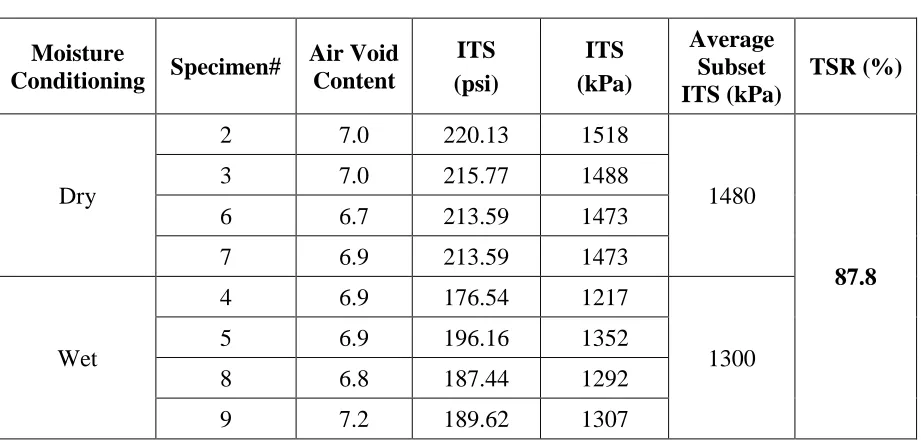
Table 6-5 Tensile Strength Values for HMA 2 Mixture Moisture Conditioning Specimen# Air Void Content ITS (psi) ITS (kPa) Average Subset ITS (kPa) TSR (%) Dry
2 7.0 220.13 1518
1480
87.8
3 7.0 215.77 1488
6 6.7 213.59 1473
7 6.9 213.59 1473
Wet
4 6.9 176.54 1217
1300
5 6.9 196.16 1352
8 6.8 187.44 1292
9 7.2 189.62 1307
Table 6-6 Tensile Strength Values for FOAM Mixture 24-hour conditioning
Moisture Conditioning Specimen# Air Void Content ITS (psi) ITS (kPa) Average Subset ITS (kPa) TSR (%) Dry
2 6.7 193.98 1337
1345
36.3
3 6.6 185.26 1277
7 6.6 196.16 1352
8 6.6 196.16 1352
Wet
1 6.6 71.92 496
488
4 6.6 71.92 496
5 6.5 69.74 481
Table 6-7 Tensile Strength Values for Crabtree 1 Mixture Moisture Conditioning Specimen# Air Void Content ITS (psi) ITS (kPa) Average Subset ITS (kPa) TSR (%) Dry
2 6.9 178.72 1232
1172
92
3 6.9 180.90 1247
5 6.9 152.57 1052
6 7.0 161.28 1112
Wet
1 6.9 161.28 1112
1082
4 6.8 137.31 947
7 6.9 159.10 1097
8 6.9 154.75 1067
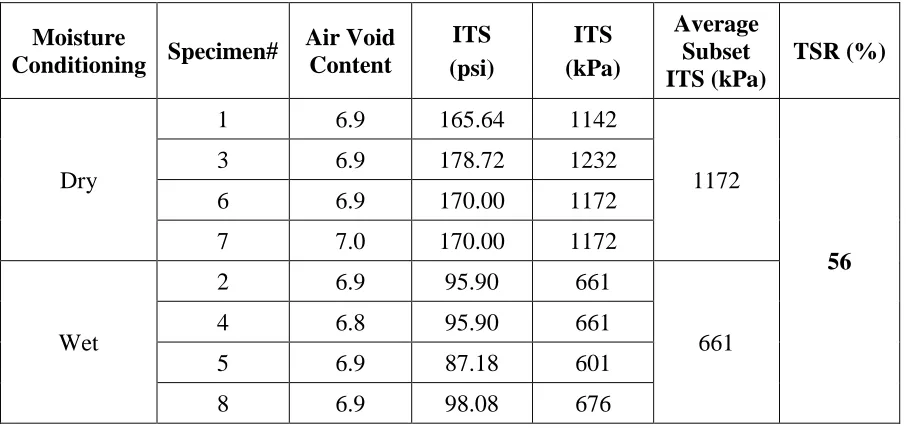
Table 6-8 Tensile Strength Values for Crabtree 2 Mixture
Moisture Conditioning Specimen# Air Void Content ITS (psi) ITS (kPa) Average Subset ITS (kPa) TSR (%) Dry
1 6.9 165.64 1142
1172
56
3 6.9 178.72 1232
6 6.9 170.00 1172
7 7.0 170.00 1172
Wet
2 6.9 95.90 661
661
4 6.8 95.90 661
5 6.9 87.18 601
8 6.9 98.08 676
Very low TSR values for FOAM mixture and Crabtree mixture without LOF 6500 antistrip
additive indicate that they both are highly moisture susceptible mixtures. When antistrip is
mixture without LOF 6500 antistrip additive) is not highly moisture susceptible when moisture
conditioned to 24 hours. However, as the conditioning time increases from 34 to 48 hours, the
Chapter 7.
Boil Test
The boil test is a test method used to determine the stripping potential in asphalt
concrete mixtures and predominantly measures the loss of adhesion between the aggregate and
asphalt cement. It is a simple test and requires less testing and personnel time, and material.
Loose asphalt mixture is boiled in distilled water for a certain amount of time, generally 10
minutes per ASTM D3625 [51] and Tex 520-C method [52]. Boiling of loose asphalt mixture
leads to the stripping of asphalt from the aggregates if the mixture is moisture sensitive. The
stripping of asphalt may expose the aggregates, it may emulsify and change color, and thus
there can be a visible color change and in some cases complete loss of asphalt cement for
highly moisture sensitive mixtures. This color change and/or exposed aggregate surface can be
used to visually estimate the amount of stripping. The current procedure uses a visual chart
such as that developed for Texas Boil test by Kennedy, et al. [53], shown in Figure 7-1 to
categorize the boiled asphalt mixture based on the amount of asphalt retained. The
disadvantage of using this process is that the evaluation of stripping is done visually and
qualitatively, and not quantitatively. Therefore, the interpretation of results may vary based on
Figure 7-1 Texas Boiling Test Rating Board (Kennedy, et al. 1984)
The colorimeter device used in this study allows quantitative determination of more
precise changes in color in Boil Test in a very short time frame (10 to 15 minutes) removing
the operator bias for visual assessment. The idea behind the development of the loss of
adhesion due to moisture sensitivity between asphalt and aggregate in Boil Test is depicted in
In Figure 7-2, the asphalt mixture before boiling is shown on the left, and the virgin
aggregate blend is shown on the right. The difference in the color index between the two
represents a complete 100% asphalt stripping. This color index of the asphalt mixture and the
virgin aggregate blend can be easily and precisely obtained using the colorimeter device in a
matter of minutes. Once the asphalt mixture is boiled using any standard method, the color
index of the boiled asphalt mixture can then be obtained. The results can then be interpreted in
a couple of ways as damage ratios that are reflective of the loss of adhesion vis-à-vis moisture
susceptibility. The damage ratios are defined in Eqs 7-1 and 7-2. Eq 7-1 can be used if the
colorimeter readings on virgin aggregate blend are not available for the mixture. Eq 7-2 can be
used when the colorimeter reading on virgin aggregate is available. In the formulae below, L* refers to colorimeter readings. L*R is the damage ratio in percent relative to the original loose
mixture. CD*R is the colorimeter damage ratio in percent relative to the virgin aggregate blend.
If colored aggregates and/or asphalt binder is used, then the L* readings can be replaced by C*
(ASTM E284-13b) in Eqs 7-1, and 7-2.
L∗R= (Boiled L∗−Unboiled L∗)∗100
Unboiled L∗ Equation 7-1
CDR∗ =(Boiled L∗−Unboiled L∗)∗100
7.1 Boil Test Mixtures
The following mixtures were tested and are represented in Table 7-1.
1. HMA 1 mixture was used to show how colorimeter device can be used to determine
the antistrip dosage for the asphalt mixture. The antistrip additive used for this mixture
was a proprietary product and the actual dosage used is masked by an arbitrary
multiplier.
2. HMA 2 mixture used had 0.75% LOF6500 antistrip additive and the boiling times used
were 10 and 60 minutes.
3. HMA 3 mixture had no antistrip additive and the boiling times used were 10, 20 and
30 minutes to investigate the effect of boiling time and the sensitivity of the colorimeter
readings.
4. A high moisture sensitive aggregate referred to as Crabtree mixture with and without
antistrip additive was used for verification of the test approach.
It should be noted that the aggregates and asphalt binder used for the HMA 1 mixtures
are not the same as HMA 2 and 3 mixtures. In total, therefore, 5 mixtures were used with and
Table 7-1 Summary of the mixtures used for Boil Test
Mixture Additive Type Additive Dosage
*
(%)
Boiling Times (minutes)
HMA 1 Proprietary 0, 1.5, 2.5, 3.5 60
HMA 2 LOF6500** 0.75 10, and 60
HMA 3 None None 10, 20, and 30
Crabtree 1 LOF6500** 0.75 10
Crabtree 2 None None 10
7.1.1 HMA 1 Loose Mixture
Boil Test was used to determine the optimum amount of antistrip additive that should
be used to effectively minimize the moisture sensitivity of an asphalt mixture. In this particular
case, the antistrip additive is a proprietary product and the percentages actually used are
multiplied by an arbitrary number to protect client confidentiality. Asphalt mixtures were
prepared using four different doses of antistrip additive - 0 (control), 1.5, 2.5, and 3.5% by the
weight of asphalt binder. The colorimeter readings, L*, were obtained for loose mixtures before
and after boil test and are presented in Table 7-2. At the same time, colorimeter reading on
virgin aggregate (source and gradation unknown) supplied was also determined.
Figure 7-3 shows the visual differences in the boil test results for the HMA 1 mixture
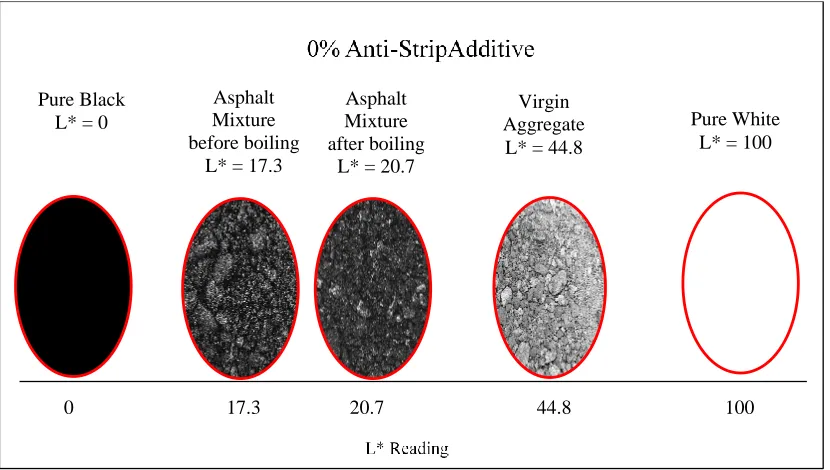
with varying amounts of antistrip additives. Figure 7-4 shows a visual representation of
mixture with 0% antistrip along with the colorimeter readings as to how to interpret the damage
ratio. In Figure 7-4, on the far left is a visual of a perfectly black color; whereas the far right
shows the visual of a perfectly white color. For the colorimeter used in this research, a perfectly
of L* of 100. Any color (gray scale) between these two will have a reading in the range of 0 to
100.
Table 7-2 L* values from colorimeter test on dry and boiled HMA 1 mixture
Additive Content Unboiled L* Boiled L* 𝐋
𝐑𝐁
∗ (%) 𝐂𝐃
𝐑𝐁 ∗ (%)
0 17.29 20.68 19.6 12.4
1.5 16.84 20.03 18.9 11.4
2.5 16.69 19.58 17.3 10.3
3.5 17.64 18.01 2.1 1.4
Virgin Aggregate 44.77 NA
Figure 7-3 Visual stripping due to Boil Test in asphalt mixtures with different additive content. The top pictures are of dry asphalt mixtures and the bottom ones are of boiled asphalt mixtures. (L to R): No antistrip additive, 1.5% antistrip additive, 2.5% antistrip
additive, 3.5% antistrip additive
Using Eqs 7-1 and 7-2, the damage (moisture sensitivity), i.e., loss of adhesion between
used to determine the antistrip additive dosage that should be used for the asphalt mixture. The
inflection point in these graphs was determined as the antistrip additive dosage for the asphalt
mixture. It is interesting to note that what would have been in the past a visual qualitative boil
test is now a quantitative test capable of showing the loss of adh