THE EFFECTS OF STREAM CHANNELIZATION ON THE DISTRIBUTION OF NUTRIENTS AND METALS
by
C h a r l e s W. O'Rear, Jr. Department of Biology E a s t C a r o l i n a U n i v e r s i t y G r e e n v i l l e , North C a r o l i n a 27834
The work upon which t h e p u b l i c a t i o n i s based was s u p p o r t e d i n p a r t by f u n d s p r o v i d e d by t h e O f f i c e of Water Research and Technology, Department of t h e I n t e r i o r , t h r o u g h the Water Resources Research I n s t i t u t e of The U n i v e r s i t y of North C a r o l i n a as a u t h o r i z e d under t h e Water Resources R e s e a r c h Act of 1964, a s amended.
P r o j e c t No. ; A-080-NC
TABLE OF CONTENTS
Page ACKNOWLEGDENTS
. . .
iii. . .
ABSTRACT
.
LIST OF FIGURES
. . .
vii. . .
LISTOFTABLES viii
. . .
CONCLUSIONSAND
RECOMMENDATIONS. . .
INTRODUCTION
METHODS . . . a .
. . .
Studyareas
. . .
Discharge measurements. . .
Water sample analysis. . .
Metalanalysis. . .
Sediment analysisRESULTS
AND
DISCUSSION. e e e.
.
. . .
Discharge. . .
Temperature. . .
Dissolved oxygen. . .
Conductivity. . .
pH. . .
Nutrients-NitrogenNutrients-Phosphorus . . . a s . . . . .
. . .
Nutrients-Chicod Creek
. . .
Dissolved MetalsMetals-Sediment . . . m e . . . e
Metals-Insects and benthic organisms
. . . .
Aquatic Plants.Nitrogen. Phosphorus. and Metals.
. . .
Meta1,pFis.hACKNOWLEDGEMENTS
The f a c u l t y of t h e Biology Department have c o n t r i b u t e d t o t h i s p r o j e c t by t h e i r s u g g e s t i o n s , c r i t i c i s m , r e v i e w , and t h e i r a b i l i t y t o l i s t e n . With- o u t t h e i r s u p p o r t t h e accomplishment of t h i s s t u d y would n o t have been
p o s s i b l e .
The g r a d u a t e s t u d e n t s a s s o c i a t e d w i t h t h i s s t u d y ; J a y Chapin, Ed Grune, D a r r e l l Vodopich, and Dan Kornegay, were r e s p o n s i b l e f o r most of t h e f i e l d work and t h e i r a t t e n t i o n t o d e t a i l and d e d i c a t i o n was o u t s t a n d i n g .
ABSTRACT
The p r o j e c t was d e s i g n e d t o d e t e r m i n e t h e d i s t r i b u t i o n p a t t e r n s of
n u t r i e n t s and m e t a l s i n c h a n n e l i z e d and u n c h a n n e l i z e d s t r e a m segments and t o d e t e r m i n e i f m o d i f i c a t i o n s o c c u r i n t h e d i s t r i b u t i o n of n u t r i e n t s . A d j a c e n t segments of S w i f t Creek, P i t t County, North C a r o l i n a were u s e d a s t h e s i t e s . An upstream segment c h a n n e l i z e d i n 1937 was used a s a r e p r e s e n t a t i v e n a t u r a l s t r e a m w h i l e a segment a p p r o x i m a t e l y one k i l o m e t e r downstream, c h a n n e l i z e d i n 1965, was u s e d a s a r e p r e s e n t a t i v e c h a n n e l i z e d s t r e a m . Sampling was performed from September, 1973, t h r o u g h November, 1974.
Flows i n t h e s t r e a m segment show a t y p i c a l p a t t e r n f o r e a s t e r n North C a r o l i n a w i t h h i g h f l o w p e r i o d s from J a n u a r y through A p r i l and August t h r o u g h September. The h i g h e s t f l o w s r e c o r d e d were d u r i n g A p r i l , 1974. Low f l o w p e r i o d s o c c u r r e d d u r i n g May t h r o u g h J u l y and October t h r o u g h December. The l o w e s t f l o w s were r e c o r d e d d u r i n g November, 1973. The median f l o w observed d u r i n g t h e s t u d y p e r i o d was 0.65 c u b i c m e t e r s p e r second (CMS), w i t h 75% of t h e f l o w s observed l e s s t h a n 4.0 CMS.
Water t e m p e r a t u r e s i n t h e n a t u r a l segment t e n d e d t o b e lower t h a n i n t h e c h a n n e l i z e d segment due t o a g r e a t e r canopy c o v e r i n t h e n a t u r a l segment. Average t e m p e r a t u r e s d u r i n g b o t h t h e w i n t e r and summer h i g h f l o w p e r i o d s , 12OC and 23°C r e s p e c t i v e l y , s t a y e d t o g e t h e r r a t h e r c o n s i s t a n t l y e x c e p t f o r a l a r g e d i u r n a l v a r i a t i o n d u r i n g t h e summer p e r i o d . During t h e low flow p e r i o d s o f e a r l y summer and l a t e f a l l a v e r a g e d i f f e r e n c e s i n t h e n a t u r a l and c h a n n e l i z e d segment exceeded 1.5OC and i n some i n d i v i d u a l measurements t h e d i f f e r e n c e s exceeded 4OC.
Most of the nitrogen and phosphorus moved through both stream segments during the high flow periods. The highest concentrations were observed during the low flow period of October through December. Ammonia-N accounted for most of the increased nitrogen concentrations while particulate phos- phorus accounted for the rise in total phosphorus. Nutrient concentrations in Chicod Creek were lower than the unchannelized segment of Swift Creek. Modification of the nutrient distribution patterns could not be directly
determined from the measured nutrient concentrations and flows. Other observations, such as longer times of travel in the unchannelized segment and the large amount of plant biomass produced in the channelized segment, still support the contention that nutrient modification could take place in natural segments and has in the channelized segment by conversion to plant biomass.
I
feel that it would be better to compare ratios of the nutrient fractions from similar watersheds so that longer stream segments could be used.Dissolved metal concentrations between the two segments showed no significant differences. The highest c o n c e n t r a t i o n s o c c u r r e d d u r i n g the
LIST OF FIGURES
Page Fig
.
Fig
.
Fig.
Fig.
Fig.
Fig
.
Fig
.
Fig.
Fig.
Fig.
Fig.
Fig. Fig.
Fig.
. . .
Location map of study areas
Seasonal stream flow pattern-Swift Creek
.
Seasonal water temperature pattern-Swift Creek Seasonal dissolved oxygen pattern-Swift Creek.
Diurnal percent saturation pattern. June-. . .
Swift Creek
Diurnal percent saturation pattern. October-
. . .
Swift CreekSeasonal conductivity pattern-Swift Creek
. .
. . .
Seasonal pH pattern-Swift Creek. . . .
Seasonal pattern. NH3-N-Swift Creek
Seasonal pattern. N02-N-Swift Creek
. . . .
. . . .
Seasonal pattern. N03-N-Swift Creek
. . .
Seasonal pattern. TON-Swift Creek
. . .
Seasonal pattern. DIP-Swift CreekLIST OF TABLES
Page T a b l e 1. Land u s a g e p a t t e r n s i n Chicod Creek and S w i f t Creek
Watersheds.
. . .
.
. . .
5T a b l e 2 . Y e a r l y summary of d i s c h a r g e measurements i n S w i f t
Creek.
. .
.
.
.
. .
.
.
.
. .
. .
.
.
.
8Table 3. S e a s o n a l summary o f d i s c h a r g e i n S w i f t Creek and
Chicod Creek.
. . . .
.
.
,.
. . . .
.
10Table
4.
Times of t r a v e l .. .
.
. . . .
.
. .
.
. . .
11T a b l e 5. S e a s o n a l summary of w a t e r t e m p e r a t u r e - S w i f t Creek
.
. . .
1 2 T a b l e 6. S e a s o n a l summary of d i s s o l v e d oxygen-Swift Creek.. .
.
.
1 3 T a b l e 7. D i u r n a l oxygen-temperature measurements.. .
.
.
. .
.
17 T a b l e 8. S e a s o n a l summary of c o n d u c t i v i t y - S w i f t Creek.
. .
. . .
1 9 T a b l e 9. R e l a t i o n s h i p of d i s c h a r g e and c o n d u c t i v i t y -S w i f t C r e e k .
.
.
. . .
.
. .
. .
.
.
.
.
1 9Table 10. S e a s o n a l summary of pH-Swift Creek.
. . . . .
. .
.
2 1T a b l e 11. D i u r n a l pH changes, June-October-Swift Creek.
. .
.
. .
21 T a b l e 1 2 , S e a s o n a l summary of n i t r o g e n , u n c h a n n e l i z e d a r e a -S w i f t C r e e k .
. .
,. .
.
,. . .
,. . .
23T a b l e 13. S e a s o n a l summary of n i t r o g e n , c h a n n e l i z e d a r e a -
S w i f t C r e e k .
. .
. .
. .
*. .
. . .
. .
.
2 3T a b l e 14. S e a s o n a l r e l a t i o n s h i p of f l o w t o n i t r o g e n d i s t r i b u t i o n -
S w i f t C r e e k .
.
. .
.
,. . .
.
*.
. .
. .
* 26T a b l e 15. R e l a t i o n s h i p of f l o w t o n i t r o g e n d i s t r i b u t i o n -
S w i f t C r e e k .
. . .
. .
. . .
. . . .
. .
. .
2 6 T a b l e 16. S e a s o n a l summary of phosphorus-Swift Creek. . . .
.
.
2 9 Table 17. R e l a t i o n s h i p of f l o w t o phosphorus d i s t r i b u t i o n -S w i f t C r e e k .
.
.
. .
.
.
,.
.
.
.
. .
.
.
2 9Table 18. Summary of f i e l d o b s e r v a t i o n s - C h i c o d Creek
. .
.
.
32 T a b l e 19. Summary of n i t r o g e n and phosphorus l e v e l s -Chicod Creek, June-August, 1974.
.
. .
.
. . .
32T a b l e 20. S e a s o n a l summary o f d i s s o l v e d m e t a l s , c h a n n e l i z e d
a r e a - S w i f t Creek.
.
. . . .
. .
. .
. . .
35Page Table 21. Seasonal summary of dissolved metals, unchannelized
area-Swift Creek,
. . . .
.
.
.
. .
.
. . . .
35Table 2 2 . Cumulative metal content in ppm of sediments in channel-
ized and unchannelized stream segments
. . . .
.
.
37
Table
23.
Percentage ratios of exchangeable and extractablemetals to total metals.
. .
.
. .
.
. .
. .
.
.
37Table 2 4 . Description of sediments-Swift Creek.
.
. .
. .
.
.
.
3 8Table 2 5 . Percentage by weight of sediments below 4 phi
and percent weight loss on combustion.
.
. . . .
.
..
3 9Table 2 6 . Metal Content of insects and benthic organisms.
. . .
..
41 Table 2 7 . Concentration ratios of benthic orgnaisms.. .
.
.
.
.
42Table 2 8 . Concentrations of nitrogen, phosphorus, and metals
found in rooted plants,
. . . .
. . .
. . .
43Table 2 9 . Metal Content of fish found in channelized and
unchannelized segments-Swift Creek.
.
.
,. . .
4 5Table 3 0 , Metal content of fish found in unchannelized
segment only.
.
. .
. . . .
.
,. . . . . . .
4 6Table 31. Comparison of some of Odum's ecosystem attributes
CONCLUSIONS
AND
RECOMMENDATIONSConclusions
1. During the period; September, 1973-December, 1974; high flows occurred during the months of January-April, August, and September while low flows occurred during the remaining months. The median observed flow was 0.65 CMS. During low flow periods, the flow characteristics of the channelized and unchannelized area differ; the channelized area having higher velocities and shallower depths.
2 . The lack of canopy and shallow water depths in the channelized area caused a significant rise in the water temperature.
3 .
A
greater water velocity and the large amount of plants and algaein the channelized segment caused significantly more dissolved oxygen in this area. Diurnal saturation values in the channelized segment varied as much as
90%.
4.
The short segments used with a lack of precision in flow and chemical measurements prevented the determination of within-segment changes in nutrient or metal distributions.5. No significant differences were found between the channelized and unchannelized segments in nitrogen or phosphorus levels. Seasonal differences noted are the result of runoff and dilution during high flow periods.
6.
Nutrient levels in Chicod Creek are significantly lower than those in Swift Creek due to the presence of waste treatment facilities in the Swift Creek watershed.During low f l o w p e r i o d s , m e t a l s v s . f l o w a r e n e g a t i v e l y c o r r e l a t e d and d u r i n g h i g h f l o w p e r i o d s t h e r e i s a p o s i t i v e c o r r e l a t i o n . The p r e s e n c e of a r e d u c i n g environment d u r i n g t h e l o w e s t f l o w s would f r e e m e t a l s t o t h e w a t e r column t h e n a s f l o w s i n c r e a s e t h e r e d u c i n g environment would be l o s t . A t h i g h e r f l o w s d i s s o l v e d m e t a l s would come i n t o t h e s t r e a m w i t h s u r f a c e r u n o f f .
8. The u n c h a n n e l i z e d s t r e a m segment t e n d s t o have g r e a t e r c o n c e n t r a t i o n s of s e d i m e n t r y m e t a l s , e x c e p t f o r g r e a t e r amounts o f z i n c . The
s o u r c e of t h e l a r g e r c o n c e n t r a t i o n of z i n c i n t h e c h a n n e l i z e d segment p r o b a b l y r e s u l t s from t h e e f f u l e n t o f an a d j a c e n t p i g farm. The h i g h e r p e r c e n t a g e of o r g a n i c m a t e r i a l i n t h e sediment o f t h e u n c h a n n e l i z e d a r e a p r o b a b l y a c c o u n t s f o r t h e h i g h e r c o n c e n t r a t i o n of t h e o t h e r m e t a l s .
9. Rooted a q u a t i c p l a n t s i n t h e c h a n n e l i z e d segment s e r v e a s a concen- t r a t i o n mechanism f o r n u t r i e n t s and m e t a l s d u r i n g t h e summer low f l o w p e r i o d c o n s e q u e n t l y t h e normal p a t t e r n of n u t r i e n t and m e t a l movement downstream i s a l t e r e d .
10. No d i f f e r e n c e s i n m e t a l c o n c e n t r a t i o n s f o r two s p e c i e s o f f i s h w i t h d i f f e r e n t f e e d i n g h a b i t s i n t h e two s t r e a m segments were found. D i f f e r e n c e s were found between largemouth b a s s and s u c k e r s i n t h e u n c h a n n e l i z e d segment f o r c o n c e n t r a t i o n s o f i r o n , z i n c and c o p p e r . 11. No q u a n t i t a t i v e judgement can be made from t h i s s t u d y on t h e d i r e c t
e f f e c t o f c h a n n e l i z a t i o n on n u t r i e n t and m e t a l d i s t r i b u t i o n , b u t q u a l i t a t i v e e v i d e n c e i s p r e s e n t e d t h a t shows c h a n n e l i z a t i o n can a l t e r t h e s e a s o n a l p a t t e r n o f n u t r i e n t and m e t a l movemnet t o r e c e i v i n g w a t e r s .
Recommendations I
1. A move d e f i n a t i v e s t u d y be made on t h e d i r e c t comparisons of p a r t -
2 . M o d i f i c a t i o n s be made i n t h e d e s i g n of c h a n n e l s s o t h a t canopy i s
p r o v i d e d t o p r e v e n t t h e b u i l d u p of p l a n t m a t e r i a l d u r i n g low f l o w p e r i o d s .
3 . M o d i f i c a t i o n s b e made i n t h e d e s i g n of channels s o t h a t a g r e a t e r
d e p t h of w a t e r w i t h s l o w e r t r a v e l t i m e s can be m a i n t a i n e d d u r i n g low f l o w p e r i o d s . These m o d i f i c a t i o n s would have t o i n c l u d e p r o v i s i o n s f o r m a i n t a i n i n g canopy c o v e r t o p r e v e n t a q u a t i c p l a n t b u i l d u p d u r i n g t h e spring-summer p e r i o d t h u s p r o v i d i n g a more n a t u r a l ecosystem.
x i i
-INTRODUCTION
The t r a n s p o r t o f m a t e r i a l s by North C a r o l i n a C o a s t a l P l a i n s s t r e a m s from t h e t e r r e s t r i a l p o r t i o n s o f t h e i r w a t e r s h e d s i s a n i m p o r t a n t l i n k i n u n d e r s t a n d i n g t h e c a u s e s and e f f e c t s of e u t r o p h i c a t i o n i n E a s t e r n North C a r o l i n a e s t u a r i e s . These s t r e a m s , i n t h e i r o r i g i n a l s t a t e , c o u l d be c o n s i d e r e d components o f mature ecosystems w i t h a low o u t p u t of n i t r i e n t s and m i n e r a l s b e c a u s e of i n t e r n a l c y c l i n g . Man's i n f l u e n c e on t h e s e e c o s y s - tems h a s c o n s i s t e d of p o i n t d i s c h a r g e s of d o m e s t i c and i n d u s t r i a l w a s t e s , p o i n t d i s c h a r g e s of w a s t e s from l i v e s t o c k and p o u l t r y o p e r a t i o n s , and t h e non-point, d i f f u s e d i s c h a r g e s r e s u l t i n g from a g r i c u l t u r a l o p e r a t i o n s and u r b a n i z a t i o n . A s l o n g a s t h e s t r e a m s y s t e m i s p a r t of a mature ecosystem and i t s a b i l i t y t o a s s i m i l a t e m a t e r i a l i s n o t exceeded, i t s n u t r i e n t and m i n e r a l o u t p u t s h o u l d remain low. An a d d i t i o n a l s t r e s s h a s been p l a c e d on many o f t h e s e s t r e a m s i n t h e l a s t twenty y e a r s , c h a n n e l i z a t i o n .
A l t e r a t i o n of t h e s e s t r e a m s by c h a n n e l i z a t i o n t h e o r e t i c a l l y s h i f t s t h e s e s t r e a m s from a m a t u r e system t o e a r l i e r s t a g e s where n u t r i e n t and m i n e r a l o u t p u t i s h i g h w i t h t h e a s s o c i a t e d open c y c l e s f o r m i n e r a l s and n u t r i e n t s .
There i s an o b v i o u s d i f f e r e n c e i n t h e p h y s i c a l c h a r a c t e r of c h a n n e l i z e d and u n c h a n n e l i z e d s t r e a m s . The u n c h a n n e l i z e d s t r e a m i s g e n e r a l l y a s e r i e s of p o o l s and s h a l l o w a r e a s i n t e r r u p t e d by d e b r i s w i t h a h i g h p e r c e n t a g e of
canopy c o v e r . The t i m e o f t r a v e l f o r a w a t e r mass i s g e n e r a l l y s l o w w i t h low v e l o c i t i e s . The c h a n n e l i z e d s t r e a m u s u a l l y h a s a u n i f o r m bed w i t h p o o l s becomming a p p a r e n t o n l y a t v e r y low f l o w s . The c h a n n e l becomes t h e f l o o d p l a i n d u r i n g low flows. There i s v e r y l i t t l e canopy s i n c e c l e a r i n g t h e s i d e s o f v e g e t a t i o n i s t h e common p r a c t i c e , t h i s a l l o w s t h e b u i l d up o f v e g e t a t i o n i n t h e s t r e a m bed.
can provide environments for the mineralization of organic material and for changes in the distribution of nutrients. Since the possibility exists for the differential modification of water quality by channelized and unchannelized streams, this study was initiated to determine if these modifications could be documented in adjacent channelized and unchannelized stream segments. The specific objectives were:
1. To evaluate and compare modifications of dissolved nitrate and dissolved phosphate levels in natural stream segments and in channelized stream segments.
2 . To evaluate and compare modifications in dissolved essential micronutrient elements (iron, zinc, copper) and dissolved toxic elements (zinc, copper, lead) in
the two stream segments.
3. To compare distribution patterns of the metals in fish, bottom fauna, rooted aquatic plants, and sediments in the two stream segments.
MATERIAL
AND
METHODSS t u d y A r e a s
The s t u d y a r e a s a r e l o c a t e d i n P i t t County, N o r t h C a r o l i n a . The
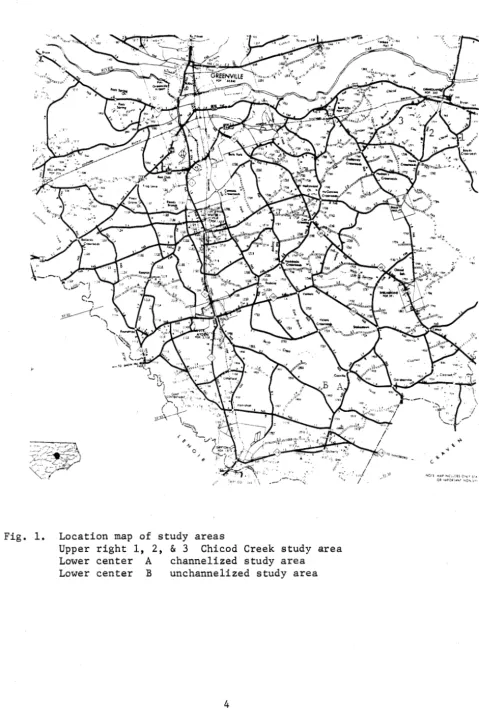
u n c h a n n e l i z e d and c h a n n e l i z e d s t r e a m s e g m e n t s a r e on S w i f t C r e e k , s o u t h e a s t of Ayden, N . C. ( F i g u r e 1 ) . The c h a n n e l i z e d s t r e a m segment i s l o c a t e d up- s t r e a m from County Road # I 7 5 3 (Area A). The u n c h a n n e l i z e d s t r e a m segment i s l o c a t e d a p p r o x i m a t e l y 1 . 2 k i l o m e t e r s ( 0 . 7 5 m i l e ) u p s t r e a m from County Road ill753 (Area B ) . Each segment was a p p r o x i m a t e l y 460 m e t e r s (1500 f e e t ) l o n g . N e i t h e r o f t h e s t r e a m s e g m e n t s had plowed c r o p l a n d a d j a c e n t t o t h e s t r e a m .
The u n c h a n n e l i z e d s t r e a m segment was c l e a r e d and d i t c h e d d u r i n g t h e l a t e 1 9 3 0 ' s . No s t r e a m improvement work h a s o c c u r r e d i n t h e main c h a n n e l s i n c e t h a t t i m e a c c o r d i n g t o d r a i n a g e d i s t r i c t r e c o r d s a n d t h e l o c a l S o i l C o n s e r v a t i o n S e r v i c e O f f i c e . T h i s a p p e a r s t o b e a t y p i c a l s t r e a m improvem,ent h i s t o r y o f many streams i n E a s t e r n N o r t h C a r o l i n a . The b a n k s of t h i s s t r e a m segment a r e r e l a t i v e l y s t a b l e a n d s t r a i g h t s i d e d w i t h a few a r e a s showing e r o s i o n . The stream b e d , e x c e p t i n low e n e r g y e n v i r o n m e n t s a r o u n d d e b r i s and i n p o o l s a s w e l l as t h e l o w e r two t h i r d s of t h e bank i s a g r a y s i l t y c l a y . The d e p t h o f t h e c h a n n e l f r o m t h e s u r r o u n d i n g f o r e s t f l o o r was a p p r o x i m a t e l y
4 m e t e r s . The o l d s p o i l b a n k s w e r e d i s c e r n a b l e t h r o u g h most o f t h e a r e a and had b e e n b r e a c h e d by h i g h f l o w s i n s e v e r a l p l a c e s . I n s e v e r a l l o c a t i o n s t h e s p o i l b a n k s a c t a s a dam, h o l d i n g s u r f a c e water and f l o o d w a t e r i n t h e swamp a l l o w i n g i t t o r e t u r n t o t h e s t r e a m a t a s l o w r a t e . The canopy c o v e r o f t h i s s t r e a m segment was e s t i m a t e d t o b e 75 t o 8 5 p e r c e n t .
Fig. 1. Location map of study areas
Upper right 1, 2, & 3 Chicod Creek study area
Lower center
A
channelized study areaconstruction was completed. The stream bed of the channelized segment varied from 15 to 20 meters wide. During low flow conditions the stream meandered through the bed. Approximately 50 percent of the stream bed was covered with rooted vegetation during low flow periods. Trees on the southwest bank provided afternoon shade of the channelized segment but there was no overhead canopy. Erosion had exposed the gray clay in several areas along the banks of the channelized area but not in the stream bed.
The Chicod Creek segment used for cmmparision is located south of
Grimesland, Pitt Co.,
N.
C. Sampling locations where bridges at the crossing of County Roads /I1565 (1 on Fig. l), ill777 (2 on Fig. l), ill760 (3 on Fig. 1).A
comparison of land-usage patterns in the two watersheds is shown in Table 1. There were no discernable instances of recent ditching in the area of sampling, but in several cases plowed farmlandcamewithin 20 meters of the streamchannel. There was a well-defined channel with a silty bottom composed primarily of fine sand and organic material. Canopy cover was estimated to be 60% to 70%.
Table 1
Land Usage Patterns in Chicod Creek and Swift Creek Watersheds* Swift Creek Chicod Creek Total acreage 51,640 (25,5976 hectares) 35,100 (17,364 hectares)
Cropland-percent 46.3
44.4
Pasture-percent
1.4
1.0Woodland-percent 43.5 44.3
Miscellaneous-percent 10.3 8.8
Discharge Measurements
Stream discharge was measured by the use of standard techniques with a current meter. A rating curve was established at the downstream end of both the channelized and unchannelized stream segments. A minimum of ten discharge measurements at each point was used to establish the rating curves. The rating curves were used primarily for establishing flows above 1 (one) cubic meter/ second (cms). Most low flow measurements were made with the current meter. Visual time of travel measurements were made during low flow over the entire length of each stream segment.
Water Sample Analysis
Field measurements of dissolved ozygen, pH, and conductivity were made using standard instruments: YSI Model 51A for dissolved oxygen, YSI Model
33
Conductivity Meter, and Fisher pH meter, Model 150. The above measurements were made at each water sample collection site.
Water samples for laboratory analysis were collected in plastic bottles and stored on ice. Upon return to the laboratory, samples for dissolved fractions were filtered using Gelman type E glass filters or Metricel type GA filters. All samples were refrigerated at 4OC. until analyzed, which was usually less than
24
hours. If samples were kept longer before analysis, they were frozen.Total organic nitrogen was determined by Kjeldal digestion and measure- ment of the resulting ammonia-N with an ammonia probe. Ammonia-N in the
water was also measured with the probe. Nitrite-N and nitrate-N were measured by the diazotation and brucine methods respectively (EPA, 1971). Total
Metal A n a l y s i s
A l l r a e t a l s were measured by t h e u s e of atomic a b s o r p t i o n s p e c t r o p h o t o m e t r y . Water samples used f o r d i s s o l v e d m e t a l a n a l y s i s were a c i d i f i e d w i t h 1 m l 0 . 1 N HN03 p e r 100 m l sample and r e f r i g e r a t e d u n t i l a n a l y z e d . Organisms, b o t h p l a n t and a n i m a l , were wet d i g e s t e d w i t h a n i t r i c - p e r c h l o r i c a c i d m i x t u r e and t h e n a n a l y z e d f o r m e t a l s .
Sediment A n a l y s i s
RESULTS & DISCUSSION
Discharge
The summary of discharge data for the study areas in Swift Creek is shown in Table 2. Discharge measurements were taken in Swift Creek from September, 1973, through November, 1974. Chicod Creek was sampled from June, 1974, through August, 1974. The U. S.
G.
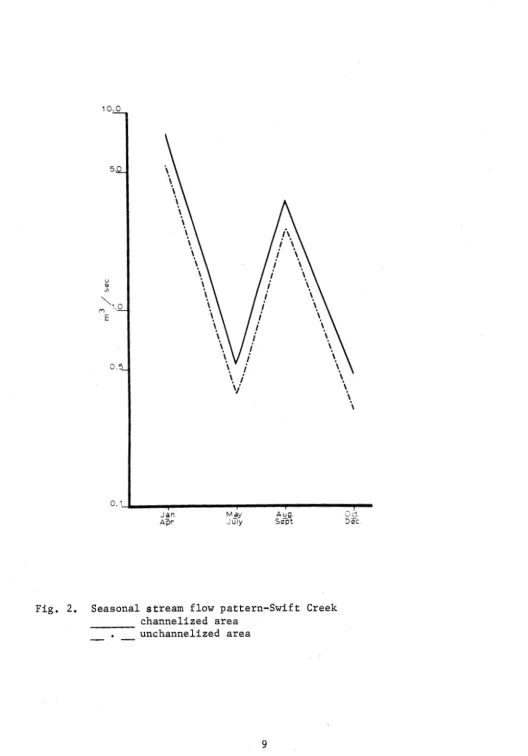
S. estimated 7 day110 year low flow for the Swift Creek Study area is 0.001-0.0014 CMS (0.04-0.05 CFS). No 7 day110 year low flow estimate was available for Chicod Creek.The seasonal pattern of streamflow for the Swift Creek Study area is shown in Figure 2 and Table
3.
The pattern shown appears to be typical of streamflows in this area when compared to the U. S. G. S. gaging stations on Creeping Swamp, unchannelized, a tributary of Swift Creek, and 19.6 Km (12.2 mi) downstream from the study area.Table 2
Yearly Summary of Discharge Measurements in Swift Creek Units are Cubic Meters Per Second (CMS)
Swift Creek
Mean
7 Median Range
-
N
Fig. 2. Seasonal stream flow pattern-Swift Creek channelized area
.
unchannelized areaThere a r e two t r i b u t a r i e s e n t e r i n g S w i f t Creek between t h e c h a n n e l i z e d and u n c h a n n e l i z e d stream segments, one i s a n a t u r a l t r i b u t a r y and t h e o t h e r i s t h e e f f l u e n t from a waste t r e a t m e n t lagoon f o r a hog farming o p e r a t i o n . The n a t u r a l t r i b u t a r y showed a c o n s i s t a n t p a t t e r n of d i s c h a r g e l i k e t h a t of t h e u n c h a n n e l i z e d s t r e a m segment. The e f f l u e n t from t h e p i g o p e r a t i o n c o u l d n o t be measured a d e q u a t e l y b u t was e s t i m a t e d by measuring t h e l e n g t h of t i m e i t t o o k t o f i l l a one l i t e r sample b o t t l e , u s i n g t h i s method t h e d i s c h a r g e
?.
was n e v e r g r e a t e r t h a n 0 . 1 l i t e r p e r second.
S e a s o n a l Summary of D i s c h a r g e i n S w i f t Creek and Chicod Creek U n i t s a r e i n CMS
S w i f t Creek
Channelized
P e r i o d Me an Median Range N
Jan-Apr 9.4 6.7 0.8
-
1 8 . 8 14May-July 0.6 0.3 0.2
-
1.6 25Aug-Sep t 4.5 2.7 0.6
-
7.9 16Oc t-Dec 0.9 0.6 0 . 1
-
2.2 1 8Unchannelized Jan-Apr 8.2 6 . 5 0.8
-
1 8 . 8 1 2May-July 0.4 0.2 0 . 1
-
1.0 1 4Aug-Sep t 3.6 2.1 0.5
-
5 . 1 7Oct-Dec 0.5 0.4 0.1
-
1.54 1 4Chicod Creek
June-Aug
This effect was apparent during the high flow periods of August and September.
Chapin (1975), in a tributary of Swift Creek, Creeping Swamp, found that
macro benthic biomass in the unchannelized swamp increased during high flows
while the same biomass measurements in the channelized segment decreased dur-
ing high flows. High dominance and low diversity indices characterized the
channelized stream while the reverse was characteristic of the unchannelized
stream. Chapin attributed these characteristics of the benthic invertebrate
population to the relative instability of the channelized stream substrate
during high flow periods.
There appeared to be no distinct differences in the flow pattern of
Swift and Chicod Creeks. The major difference noted in the three areas was
the water velocity as measured by times of travel (Table
4).
All measurements
for Swift Creek were made the same day usually within
ssix hour time period.
Time of travel measurements were made during June, July, and October.
Table
4
Times of
ravel-~eters/Minute
Discharge
Swift Creek
Unchannelized
Channelized
Temperature
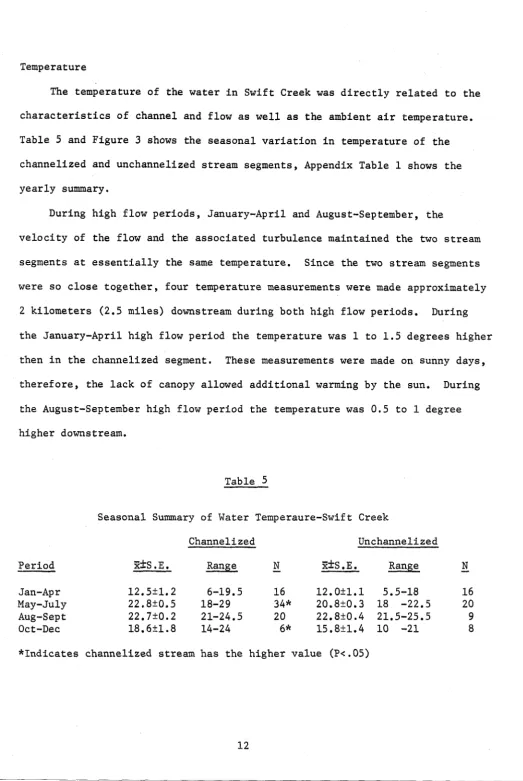
The temperature of the water in Swift Creek was directly related to the
characteristics of channel and flow as well as the ambient air temperature.
Table 5 and Figure 3 shows the seasonal variation in temperature of the
channelized and unchannelized stream segments, Appendix Table 1 shows the
yearly summary.
During high flow periods, January-April and August-September, the
velocity of the flow and the associated turbulence maintained the two stream
segments at essentially the same temperature. Since the two stream segments
were so close together, four temperature measurements were made approximately
2 kilometers (2.5 miles) downstream during both high flow periods. During
the January-April high flow period the temperature was 1 to 1.5 degrees higher
then in the channelized segment. These measurements were made on sunny days,
therefore, the lack of canopy allowed additional warming by the sun. During
the August-September high flow period the temperature was 0.5 to 1 degree
higher downstream.
Table 5
Seasonal Summary of Water Temperaure-Swift Creek
Channelized
Unchannelized
Period
%*s .E.
Range
-
N
Z2s.E.
Range
-
N
Jan-Ap
r
12.5k1.2
6-19.5
16
12.021.1
5.5-18
16
May-July
22.8k0.5
18-29
34*
20.8k0.3
18 -22.5
2
0
Aug-Sep
t22.7k0.2
21-24.5
20
22.8k0.4
21.5-25.5
9
Oc
t-Dec
18.6+1. 8
14-24
6*
15.8+1.4
10 -21
8
During the low flow periods there was a statistically significant rise
in the water temperature between the channelized and unchannelized stream
segments. This rise in temperature can be attributed to the lack of canopy
in the channelized stream segment and the shallow water depth. Daylight
measurements of temperature during June indicate a difference of 2.g°C
between the downstream stations of the unchannelized and the channelized
stream segments. Daylight measurements during October show a 1.4OC differ-
ence between the two stream segments.
The observed differences in temperature in the channelized segment do
not appear to exceed known limits for the organisms known to be present in
this stream system. The temperature variations do contribute to a general
pattern of instability
inthe channelized stream segment.
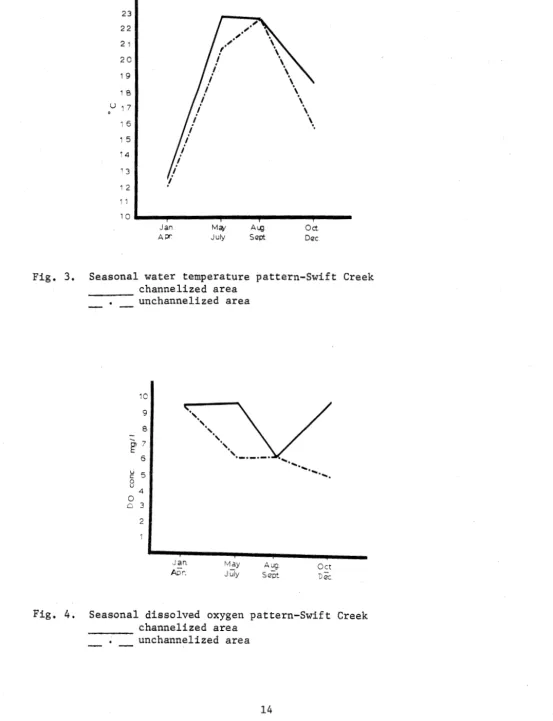
Dissolved Oxygen
Dissolved oxygen concentrations in the two stream segments is related to
flow and the characteristics of the stream channel. The yearly summary of
oxygen concentrations is found in Appendix Table 1. The seasonal pattern is
shown in Figure 4 and Table 6.
Seasonal Summary of Dissolved Oxygen-Swift Creek
Channelized
Unchannelized
Period
W5S.E.
Range
-
N
I+S.E.
Range
-
N
Jan-Ap
r
9.5C0.8
2.8-14.8
16
9.550.8
4.0-15
16
May-
July
9.7+0.5*
5.4-16.3
32
6.2t0.2
4.6- 8.2
18
Aug-Sept
6.4k0.1
5.3- 7.2
20
6.3k0.2
5.2- 7.2
9
Oct-Dec
9.9+1.2*
5.6-14.8
6
5.1k1.2
1.8-10.2
8
Jan MW A L ~ Oct
A P r July Sopt Doc
Fig.
3.
Seasonal water temperature pattern-Swift Creekchannelized area
.
unchannelized area- -
Fig.
4.
Seasonal dissolved oxygen pattern-Swift Creekchannelized area
.
unchannelized areaNo s i g n i f i c a n t d i f f e r e n c e s were found i n oxygen c o n c e n t r a t i o n s between t h e c h a n n e l i z e d and u n c h a n n e l i z e d s t r e a m segments d u r i n g h i g h f l o w p e r i o d s
(Jan.-Apr. and Aug.-Sept.). The d i f f e r e n c e s n o t e d i n t h e d i s s o l v e d oxygen c o n c e n t r a t i o n between t h e w i n t e r and l a t e summer h i g h f l o w p e r i o d s was r e l a t e d t o t e m p e r a t u r e d i f f e r e n c e s , t h e r e were no s t a t i s t i c a l d i f f e r e n c e s i n t h e p e r c e n t s a t u r a t i o n v a l u e s f o r t h e two t i m e p e r i o d s .
During low f l o w p e r i o d s (May-July and 0ct.-Dec.), t h e r e was a s i g n i f i - c n a t d i f f e r e n c e i n t h e oxygen c o n c e n t r a t i o n i n t h e two s t r e a m segments. P e r c e n t s a t u r a t i o n i n t h e c h a n n e l i z e d s t r e a m approached 100% f o r most
o b s e r v a t i o n s , and s e v e r a l t i m e s exceeded 100%. I n t h e u n c h a n n e l i z e d segment t h e p e r c e n t s a t u r a t i o n was between 50 and 75. A l l of t h e oxygen determina- t i o n s d i s c u s s e d h e r e were made between 1 1 : O O AM and 3:00 PM.
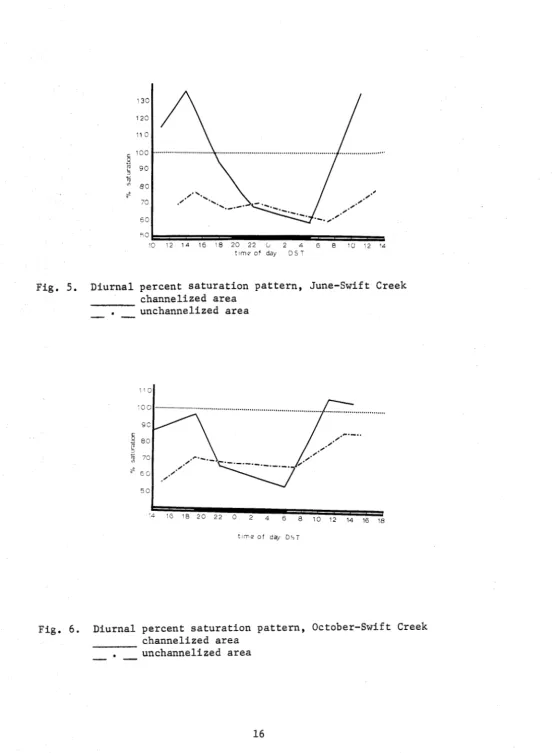
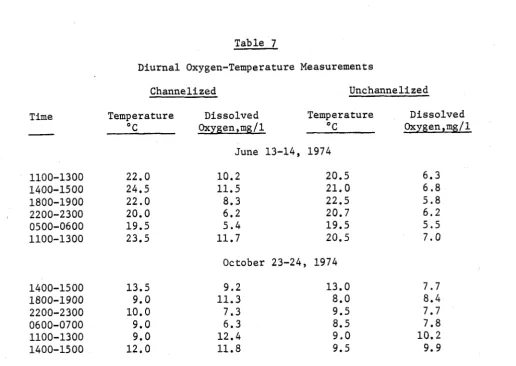
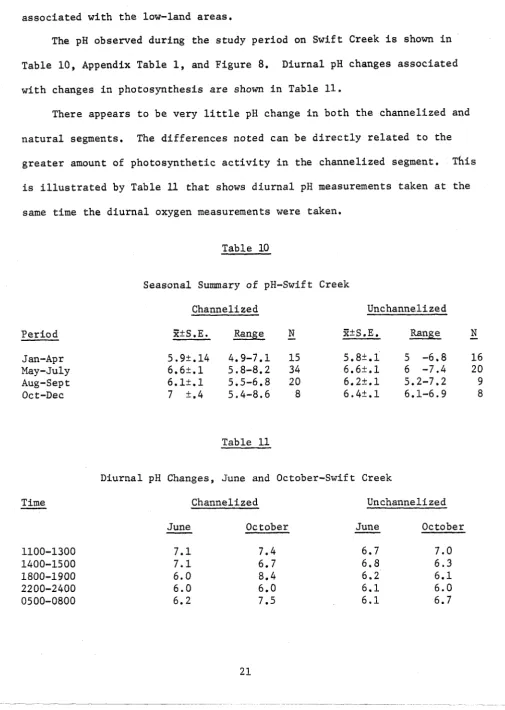
D i u r n a l oxygen measurements were made d u r i n g J u n e and October. The r e s u l t s of t h e s e s t u d i e s i s shown i n Table
7
and F i g u r e s 5 and 6.S e v e r a l oxygen measurements were made a t n i g h t d u r i n g h i g h f l o w p e r i o d s t o d e t e r m i n e i f changes due t o b i o l o g i c a l a c t i v i t y could be d e t e c t e d . No changes were d e t e c t e d t h a t c o u l d n o t be a t t r i b u t e d t o i n c r e a s e d s o l u b i l i t y due t o lower n i g h t t e m p e r a t u r e s .
10 12 1 4 16 18 2 0 2 2 ii 2 4 6 e 1 0 12 '4 t t m e o f day D S T
Fig. 5. Diurnal percent saturation pattern, June-Swift Creek
channelized area
.
unchannelized area-
-
t l m e o f day D \ l
Fig. 6. Diurnal percent saturation pattern, October-Swift Creek
channelized area
.
unchannelized areaTable
7
Diurnal Oxygen-Temperature Measurements
Channelized
Unchannelized
Time
-
Temperature
O CDissolved
Temperature
Oxygen,mg/l
OC
June 13-14, 1974
October 23-24, 1974
Dissolved
Oxygen,mg/l
The channelized stream bed during low flows provides an environment for
the establishment of rooted aquatic plants, diatoms, and algae that is not
present except in isolated areas of the natural segment. Swicegood and Kriz
(1973) reported that aquatic weeds were a major problem in other coastal
plains streams so the situation with regard to the establishment of plant
communities in the stream bed is not unique to Swift Creek but appears to be
typical of channelized coastal plains streams.
The character of the plant communities in the channelized stream bed
changes from the summer to late fall low flow periods. During the summer low
flow periods, thirty to forty percent of the stream bed is covered with
emergent and underwater beds of rooted aquatic plants, the rest of the stream
bed including damp sand, is covered by algal mats and brown material. The
brown material was examined microscopically several times from different
locations and was composed of diatoms. After the late summer high flow period,
t h e r o o t e d a q u a t i c p l a n t s were swept downstream o r were i n a decomposed s t a t e ; a l g a l mats and d i a t o m s were r e e s t a b l i s h e d by t h e end o f October.
The oxygen regime i n t h e c h a n n e l i z e d segment of S w i f t Creek d u r i n g t h e low f l o w p e r i o d s n e e d s t o be c o n s i d e r e d i n d e t e r m i n i n g w a t e r q u a l i t y c r i t e r i a f o r oxygen. During low f l o w p e r i o d s , t h e r e i s a l a r g e d i u r n a l f l u c t i o n i n t h e amount of oxygen a v a i l a b l e f o r a q u a t i c organisms, t h i s combined w i t h t h e h i g h t e m p e r a t u r e s a s s o c i a t e d w i t h t h e uncanopied c h a n n e l i z e d segment could r e s u l t i n s t r e s s c o n d i t i o n s t o organisms i n t h e e a r l y morning h o u r s . T h i s
\
s t u d y e x t e n d s H a l l ' s (1971) s i m i l a r comments on piedmont North C a r o l i n a s t r e a m s t o c o a s t a l p l a i n s s t r e a m s .
C o n d u c t i v i t y
The c o n d u c t i v i t y of w a t e r i s an i n d i c a t i o n of t h e amount o f i o n i z e d d i s s o l v e d m a t e r i a l . G e n e r a l l y , c o n d u c t i v i t y h a s a n i n v e r s e r e l a t i o n s h i p w i t h flow i n r e l a t i v e l y n o n - p o l l u t e d s t r e a m s (Hem, 1 9 7 1 ) .
The s e a s o n a l summaries f o r S w i f t Creek a r e shown i n T a b l e 8 and F i g u r e 7 .
Y e a r l y summaries a r e shown i n Appendix Table 1. C o o r e l a t i o n a n a l y s i s was used t o t e s t f o r r e l a t i o n s h i p s of c o n d u c t i v i t y and f l o w . Table
9
shows t h e r e l a t i o n - s h i p s t e s t e d and t h e r e s u l t s . The low c o r r e l a t i o n s o b t a i n e d r e f l e c t t h e g e n e r a l p a t t e r n mentioned e a r l i e r and show t h e wide v a r i a t i o n t h a t i s c h a r a c t e r i s t i c of s t r e a m s i n t h e c o a s t a l p l a i n (Sherwani, 1971).Table 8
Seasonal Summary of Conductivity*-Swift Creek
Channelized
Unchannelized
Period
Z+S
.E.
Range
-
N
3S.E.
Range
-
N
Jan-Ap
r
May-
July
Aug-Sept
Oct-Dec
*Units are umhos
Table
9Relationship of Discharge and Conductivity-Swift Creek
Relationships*
Channelized-flows by season
Unchannelized-flows by season
Channelized-all flows
Unchannelized-all flows
Channelized-flows<4.O crns
Unchannelized-flows<4.0 crns
Channelized-flows<O.65 crns
Unchannelized-flows<0.65
crns
All flows, channelized
&unchannelized
All flows, channelized
&unchannelized
Flows<4.0 cms-channelized
&unchannelized
Flows<0.65 cms-channelized
&unchannelized
Correlation
Significance
Coefficient
Level
NS
*Both raw flows and log (base 10) flows were tested. The correlations
obtained were from log-transformed flows.
The pH of a natural water system is generally controlled by chemical
equilibria associated with the material dissolved in it and in poorly buffered
systems or highly productive systems by photosynthesis. The pH and buffering
capacity of most coastal plains creeks is generally low due to the low quantity
Jan M ~ Y A!g O c t I
AFr July Sept D&
Fig. 8. Seasonal conductivity pattern-Swift Creek
channelized area
.
unchannelized area-
-
Fig.
7.
Seasonal conductivity pattern-Swift Creekchannelized area
.
unchannelized areaof d i s s o l v e d m a t e r i a l s and t h e r e l a t i v e l y l a r g e amount of o r g a n i c m a t e r i a l a s s o c i a t e d w i t h t h e low-land a r e a s .
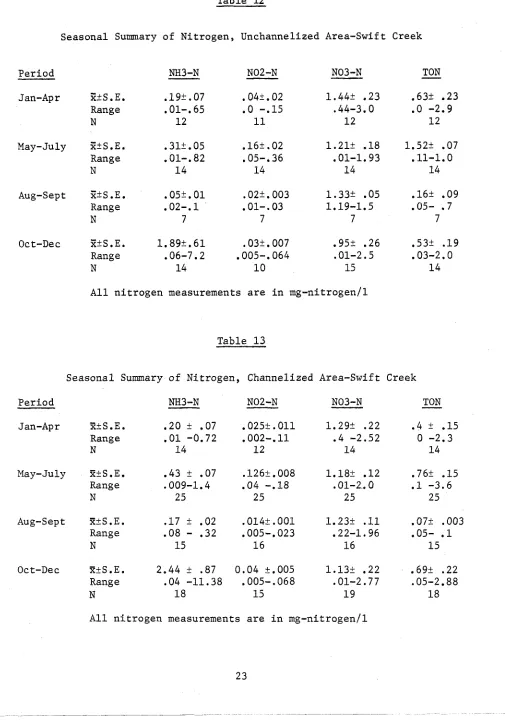
The pH observed d u r i n g t h e s t u d y p e r i o d on S w i f t Creek i s shown i n T a b l e 1 0 , Appendix T a b l e 1, and F i g u r e 8. D i u r n a l pH changes a s s o c i a t e d w i t h changes i n p h o t o s y n t h e s i s a r e shown i n T a b l e 11.
There a p p e a r s t o b e v e r y l i t t l e pH change i n b o t h t h e c h a n n e l i z e d and n a t u r a l segments. The d i f f e r e n c e s n o t e d c a n be d i r e c t l y r e l a t e d t o t h e g r e a t e r amount of p h o t o s y n t h e t i c a c t i v i t y i n t h e c h a n n e l i z e d segment. T h i s i s i l l u s t r a t e d by T a b l e 11 t h a t shows d i u r n a l pH measurements t a k e n a t t h e same t i m e t h e d i u r n a l oxygen measurements were taken.
P e r i o d Jan-Apr May- J u l y Aug-Sep t Oc t -Dec
Time
-
S e a s o n a l Summary o f pH-Swift Creek
Channelized Unchannelized
2 S . E . Range
N
ZtS.E. Range-
NTable 11
D i u r n a l pH Changes, June and October-Swift Creek
Channelized Unchannelized
June
N u t r i e n t s - N i t r o g e n
The n i t r o g e n c y c l e i n n a t u r a l w a t e r s i s a l m o s t always r e l a t e d t o t h e b i o c h e m i c a l a c t i v i t y of t h e organisms i n t h e a q u a t i c community ( B r e z o n i k ,
1973). I n c o a s t a l p l a i n s s t r e a m s of North C a r o l i n a , c u l t u r a l a d d i t i o n s of n i t r o g e n t o n a t u r a l w a t e r s u s u a l l y t a k e s p l a c e i n t h e form of p o i n t and non-point d i s c h a r g e s from w a s t e t r e a t m e n t f a c i l i t i e s and s p e c t i c t a n k s , run- o f f and d r a i n a g e from a g r i c u l t u r a l o p e r a t i o n s , and r u n o f f from u r b a n a r e a s
(Howells, 1974; WRRI, 1969). The S w i f t Creek s t u d y a r e a s have a l l of t h e s e s o u r c e s o f n i t r o g e n l o c a t e d i n t h e w a t e r s h e d .
The s e a s o n a l summary and v a r i a t i o n i n n i t r o g e n i s shown i n T a b l e s 1 2 , and 1 3 , and F i g u r e s 9, 1 0 , 11, and 12. The y e a r l y summary i s shown i n Appendix T a b l e 2. The f o l l o w i n g a b b r e v i a t i o n s w i l l be u s e d t o d e n o t e t h e s p e c i e s of n i t r o g e n measured and d i s c u s s e d :
S p e c i e s Ammonia
-
N N i t r i t e-
N N i t r a t e-
N P a r t i c u l a t e andd i s s o l v e d o r g a n i c
-
NA b b r e v i a t i o n
TON
C o r r e l a t i o n c o e f f i c i e n t s were used t o e s t a b l i s h t h e p a t t e r n s o f n i t r o g e n d i s t r i b u t i o n w i t h flows. The c o r r e l a t i o n c o e f f i c i e n t s a r e shown i n T a b l e s 1 4 , and 15. A t t e m p t s were made t o u s e mass b a l a n c e t e c h n i q u e s t o d e t e r m i n e upstream- downstream changes i n e a c h segment. Lack of p r e c i s i o n and a c c u r a c y i n b o t h
f l o w d e t e r m i n a t i o n s and chemical a n a l y s i s of t h e w a t e r p r e v e n t e d t h e u s e o f mass b a l a n c e t o d e t e c t w i t h i n s t r e a m segment changes i n n i t r o g e n d i s t r i b u t i o n .
No s i g n i f i c a n t d i f f e r e n c e s were found between t h e c h a n n e l i z e d and unchannel- i z e d s t r e a m segments on a y e a r l y o r a s e a s o n a l b a s i s . The g r e a t e s t v a r i a t i o n was found from s e a s o n t o s e a s o n i n b o t h segments. The o r i g i n a l j u s t i f i c a t i o n f o r d i v i d i n g t h e s e a s o n s was t h e d i s c h a r g e p a t t e r n ( s e e F i g . 2 ) , b u t t h e f l o w
Table 12
Seasonal Summary of Nitrogen, Unchannelized Area-Swift Creek
Period
Jan-Apr
May-
July
Aug-Sept
Oct-Dec
3S.E.
.19+.07
.
041. 02
1.44+ .23
Range
.01-. 65
.O
-.I5
.44-3.0
N
12
11
12
E2S.E.
.31+.
05
.
16+.
02
1.212 .18
Range
.01-. 82
.05-. 36
.01-1.93
N
14
14
14
ZtS
.E.
.05+.
01
.02+.
003
1.332 .05
Range
.02-. 1
.01- .03
1.19-1.5
N
7
7
7
Z2S.E.
1.89t.61
.
03+.
007
.95t .26
Range
.06-7.2
.005-. 064
.01-2.5
N
14
10
15
TON
-
.63+ .23
.o
-2.9
12
1.52+ .07
.11-1.0
14
.16+ ,09
.05- - 7
7
.53t .19
.03-2.0
14
All nitrogen measurements are in mg-nitrogen11
Table 13
Seasonal Summary
ofNitrogen, Channelized Area-Swift Creek
Period
Jan-Apr
May-
July
Aug-Sept
Oct-Dec
't2S.E.
Range
N
E2S.E.
Range
N
E2S.E.
Range
N
B2S.E.
Range
N
All ni
en measuremen
~ t s
are in mg-nitrogen11
TON
-
.4
+
.15
0 -2.3
14
.76+ -15
.1 -3.6
25
.07? ,003
.05- .1
15
.69+ .22
.05-2.88
Fig. 10. Seasonal pattern, N02-N-Swift Creek channelized area
.
unchannelized area-
-
J an MW A 9 Ost
A-F July Sept Doc
Fig. 9. Seasonal pattern, NH3-N-Swift Creek
channelized area
.
unchannelized areaFig. 12. Seasonal pattern, TON-Swift Creek channelized area
.
unchannelized area-
-
I
Jan M"Y Aug. O c t.
A 6r J U ' ) 9 5 t D%C
Fig. 11. Seasonal pattern, N03-N-Swift Creek
channelized area
.
unchannelized areaTable 14
Seasonal Relationships of Flow to Nitrogen Distribution-Swift Creek*
Period NH3 -N N02-N N03-N
-
-
TON Jan-Apr
Channelized-.
82-.
6 4 N S-.
54Unchannelized
-.
71 -.61 NS NS May-July Channelized-.
21-.
86N
S N S Unchannelized NS-.
62 NS NS Aug-Sept Channelized NS NS NS NS Unchannelized NS NS -.78 NS Oct-Dec Channelized -.53 NS NS .78Unchannelized
-.
60N
S NS .63 *All correlation coefficients are significantly different from 0 at the.05
level. All flows used were log-transformed.Table 15
Relationship of Flow to Nitrogen Distribution-Swift Creek
Flow
-
A1 1
Less than 0.65 CMS
More than 0.65 CMS
Area
-
Channelized &
Unchanneli zed Channelized only Unchannelized only
Channelized &
Unchannelized Channelized only Unchannelized only
Channelized &
Unchannelized Channelized only Unchannelized only TON
-
-.37-.
39-.
42-.
43
-.
39NS
-.
37-.
46Ammonia-N a p p e a r e d t o f o l l o w t h e most c o n s i s t a n t r e l a t i o n s h i p w i t h f l o w (Table 1 5 ) on a y e a r l y b a s i s . S e a s o n a l r e l a t i o n s h i p s t o f l o w were l e s s
c o n s i s t a n t (Table
1 4 ) .
The d i f f e r e n c e between t h e c h a n n e l i z e d and u n c h a n n e l i z e d s t r e a m segments i n ammonia-N c o n c e n t r a t i o n d u r i n g t h e August-September h i g h d i s c h a r g e p e r i o d i s d i r e c t l y r e l a t e d t o e f f u l e n t from t h e p i g farming o p e r a t i o n . Three ammonia and d i s c h a r g e measurements were made of t h i s e f f u l e n t d u r i n g t h e August-September p e r i o d . Ammonia-N measurements a v e r a g e d 8.6 mg/l and d i s c h a r g e averaged 0.01 cms. D i f f e r e n c e s n o t e d i n t h e c o n c e n t r a t i o n of ammonia between t h e low f l o w p e r i o d of e a r l y summer and t h e low f l o w p e r i o d of l a t e f a l l i s p r o b a b l y r e l a t e d t o t h e amount of o r g a n i c m a t e r i a l a v a i l a b l e f o r decomposition. S i n c e most of t h e o r g a n i c m a t e r i a l i n t h e w a t e r s h e d was f l u s e d by w i n t e r and s p r i n g r a i n s . The h i g h ammonia c o n c e n t r a t i o n s d u r i n g l a t e f a l l c o u l d t h e n r e s u l t from t h e decomposition of o r g a n i c m a t e r i a l f l u s e d i n t o t h e s t r e a m by t h e l a t e summer r a i n s and l e a f f a l l d u r i n g t h i s p e r i o d .N i t r i t e - N d i s t r i b u t i o n w i t h f l o w s on a y e a r l y b a s i s do n o t show a
c o n s i s t a n t p a t t e r n e x c e p t when f l o w s a r e h i g h e r t h a n 0,65 crns (median f l o w ) . On a s e a s o n a l b a s i s a c o n s i s t a n t p a t t e r n was shown o n l y d u r i n g t h e January- A p r i l h i g h f l o w p e r i o d and t h e May-July low flow p e r i o d w i t h c o n c e n t r a t i o n s n e g a t i v e l y c o r r e l a t e d w i t h f l o w s a s would be e x p e c t e d .
(Gambrel1 e t a l , 1 9 7 4 ) , s i n c e most of t h e f l o w s g r e a t e r t h a n 0.65 cms would o c c u r d u r i n g f e r t i l i z e r a p p l i c a t i o n s i n t h e s p r i n g and t h e plowing u n d e r of
c r o p r e s i d u e s d u r i n g t h e August-September h i g h f l o w p e r i o d s .
T o t a l o r g a n i c n i t r o g e n on a y e a r l y b a s i s f o l l o w s a r e l a t i v e l y c o n s i s t a n t p a t t e r n (Table 1 5 ) w i t h flow b u t does n o t on a s e a s o n a l b a s i s (Table 1 4 ) . The r e l a t i v e l y h i g h p o s i t i v e c o r r e l a t i o n s found d u r i n g t h e October-December were unexpected. T h i s r e l a t i o n s h i p of t o t a l o r g a n i c n i t r o g e n t o f l o w i s p r o b a b l y r e l a t e d t o l e a f f a l l d u r i n g t h i s time p e r i o d and t o a g r i c u l t u r a l p r a c t i c e s i n t h i s a r e a . D i s c u s s i o n s w i t h f a r m e r s i n t h e a r e a and P i t t County A g r i c u l t u r a l E x t e n s i o n p e r s o n n e l e s t a b l i s h e d t h a t c r o p r e s i d u e s a r e most common i n t h e f i e l d s d u r i n g September and October, t h i s a c t i v i t y coupled w i t h t h e thunder- s t o r m a c t i v i t y d u r i n g t h i s p e r i o d and t h e l e a f f a l l would p r o v i d e i n c r e a s i n g amounts o f p a r t i c u l a t e m a t e r i a l w i t h i n c r e a s i n g d i s c h a r g e .
Nutrients-Phosphorus
The c u l t u r a l s o u r c e s of phosphorus i n t h e S w i f t Creek w a t e r s h e d a r e t h e same a s t h o s e of n i t r o g e n . An a d d i t i o n a l s o u r c e of phosphorus i n t h e c a s e o f b o t h r e c e n t l y c h a n n e l i z e d and t h e o l d c h a n n e l i z e d streams i s t h e e x p o s u r e t o
l e a c h i n g of Yorktown Formation s h e l l beds. T h i s f o r m a t i o n forms t h e s t r e a m bed and i s exposed on t h e bank of t h e u n c h a n n e l i z e d ( c h a n n e l i z e d 1937) s t u d y a r e a . T h i s same f o r m a t i o n p r o b a b l y forms t h e impervious l a y e r u n d e r t h e s a n d s e d i m e n t and s p o i l banks o f t h e c h a n n e l i z e d s t u d y a r e a .
Table 16
Seasonal Sumnary of Phosphorus-Swift Creek
Period
Jan-Apr
Channelized
Unchannelized
D.I.P.
T.P.P.
D.I.P.
T.P.P.
.24+.06
,21+.03
.15+.
03
.24+.
03
Range
.003-.
8
,01-. 38
.02-.
3
.12-.
41
N
12
14
10
12
May-July
Z+S
.E.
.43+.
04
.46+.
03
.41+.06
.46+
.04
Range
.13--99
.19-.68
$04-.
7
.22-.
68
N
25
25
14
14
Aug-Sep
t3S.E.
.41k.
24
.19+.
01
1.11+. 91
.454.19
Range
.06-4.0
.08-. 26
,045-6.5
.
17k1.
58
N
16
1 57
7
Oct-Dec
jZ2S.E.
.92+.28
2.19t.7
.79+.31
1.85 .6
Range
.07-4.2
.16-8.6
.l-4.0
.1 -6.8
N
20
20
15
16
All phosphorus measurements are in mg phosphorus/l.
Table 17
Relationship of Flow to Phosphorus Distribution-Swift Creek
Seasonal
Period
Jan-Apr
DIP
TPP
May-July
DIP
TPP
Aug-Sept
DIP
TPP
Oct-Dec
DIP
TPP
Channelized
Unchannelized
NS*
NS
Flow
-
Channelized
Unchannelized
All flows
DIP
NSN
S
TPP
Flows less
DIP
than 0.65 CMS
TPP
Flows greater
DIP
than 0.65 CMS
TPP
Fig. 14. Seasonal pattern, TPP-Swift Creek channelized area
.
unchannelized area- -
Fig. 13. seasonal pat tern, DIP-Swif t Creek
channelized area
.
unchannelized areaAugust-September h i g h f l o w p e r i o d i n t o t a l p a r t i c u l a t e phosphate. T h i s r e s u l t e d from two measurements made d u r i n g r i s i n g f l o w s r e s u l t i n g from thundershowers i n t h e upper r e a c h e s of t h e w a t e r s h e d and t h e phosphorus b e i n g d i l u t e d by low p h o s p h a t e w a t e r from a t r i b u t a r y b e f o r e r e a c h i n g t h e c h a n n e l i z e d segment. T h i s was a l s o r e s p o n s i b l e f o r t h e l a r g e d i f f e r e n c e i n t h e means of d i s s o l v e d i n o r g a n i c p h o s p h a t e i n t h e two s t r e a m segment,
The g r e a t e s t s e a s o n a l movement of b o t h d i s s o l v e d i n o r g a n i c and p a r t i c u l a t e p h o s p h a t e o c c u r s d u r i n g t h e J a n u a r y - A p r i l p e r i o d . S i g n i f i c a n t amounts would a l s o b e t r a n s p o r t e d d u r i n g t h e August-September h i g h f l o w p e r i o d . The August- September movement of phosphorus may be t h e most s i g n i f i c a n t i n terms of
e s t u a r y e u t r o p h i c a t i o n . Hobbie e t a 1 (1972) r e p o r t e d t h a t t o t a l phosphorus c o n c e n t r a t i o n s i n t h e Pamlico R i v e r show i n c r e a s e s d u r i n g t h e August-September p e r i o d . S i n c e phosphorus i n t h e Pamlico i s n o t l i m i t i n g t h i s s e a s o n a l change i n phosphorus i n p u t h a s l i t t l e i m p o r t a n c e i n t h i s p a r t i c u l a r system. I n o t h e r North C a r o l i n a e s t u a r i e s where phosphorus i s l i m i t i n g t h i s s e a s o n a l i n p u t of phosphorus c o u l d p r o v i d e t h e n e c e s s a r y n u t r i e n t s f o r n u i s a n c e a l g a e blooms.
C o r r e l a t i o n s w i t h flow on b o t h a s e a s o n a l and y e a r l y b a s i s were c o n s i s t a n t w i t h what was e x p e c t e d , n e g a t i v e c o r r e l a t i o n s w i t h flow. The e x c e p t i o n was a p o s i t i v e c o r r e l a t i o n o f t o t a l p a r t i c u l a t e phosphorus w i t h f l o w d u r i n g t h e J a n u a r y - A p r i l p e r i o d .
Nutrients-Chicod Creek
Table 18
Summary of Field Observations
Chicod Creek, Pitt CO., N. C.
June, 1974-August, 1974
Dissolved
Water
Oxygen
Temperature
pH
Conductivity
-
Flow
jL7S.E.
5.7550.33
6.220.04
0.05 (median)
Range
1.0 -7.9
19-24
5.7-6.7
54-150
0.01-2.8
N
33
83
2
7
, 8No significant correlation was found between conductivities and flow in
Chicod Creek. Several oxygen determinations were made during pre-dawn hours
to determine if photosynthesis was contributing to day-time oxygen levels. The
average difference for three pre-dawn and three early afternoon oxygen determi-
nations was 0.9 mg/l. This indicates the similarity of primary production in
the unchannelized Swift Creek area and Chicod Creek.
The summary of nitrogen and phosphorus determinations is shown in Table 19.
Total particulate phosphorus was the only significant nutrient correlation with
flow. This value was -.54. All of the nutrient concentrations in Chicod Creek
are significantly different at the .05 level from those in Swift Creek during
Table 19
Summary of Nitrogen and Phosphorus Levels-Chicod Creek,
June-August, 1974
NH3-N
N02-N
N03-N
-
TON
-
DIP
-
TPP
3S.E.
.17*. 07
.02
6+. 007
.36+.
07
.04+.008
.204 .04
.27k.05
Range
.01-
.9
-005-.
074
-06-.95
.014-.11
.014- .57
.09-.88
D i s s o l v e d M e t a l s
Heavy m e t a l s i n an ecosystem have two a s p e c t s o f b i o l o g i c a l i m p o r t a n c e , t h e y a r e e s s e n t i a l p a r t s of b i o c h e m i c a l p r o c e s s e s i n an organism and t h e y can b e t o x i c i n e x c e s s i v e amounts. I n some c a s e s f o r a p a r t i c u l a r m e t a l t h e r e i s o n l y a s m a l l d i f f e r e n c e s e p a r a t i n g t h e e s s e n t i a l r e q u i r e m e n t and a t o x i c amount. I r o n , z i n c , c o p p e r , and l e a d were chosen a s r e p r e s e n t a t i v e of heavy m e t a l s i n t h i s s t u d y b e c a u s e o f t h e e s s e n t i a l r e q u i r e m e n t s o f t h e f i r s t t h r e e and t h e d e c r e a s i n g amounts r e q u i r e d f o r t o x i c e f f e c t s .
The s e a s o n a l summaries of t h e i r c o n c e n t r a t i o n s i s found i n T a b l e s 2 0 , and 21. The y e a r l y summary i s found i n Appendix Table 3. There were no s i g n i f i c - a n t d i f f e r e n c e s found between t h e c h a n n e l i z e d a r e a and t h e u n c h a n n e l i z e d a r e a e i t h e r on a s e a s o n a l o r y e a r l y b a s i s . The o n l y s i g n i f i c a n t d i f f e r e n c e n o t e d between s e a s o n s i n e i t h e r segment was t h e low f l o w p e r i o d of October-December. None o f t h e l e v e l s o f c o n c e n t r a t i o n found i n S w i f t Creek a r e c o n s i d e r e d t o x i c .
C o r r e l a t i o n c o e f f i c i e n t s t o t e s t f o r t h e r e l a t i o n s h i p of f l o w t o t h e d i s s o l v e d m e t a l s on a s e a s o n a l b a s i s were d e t e r m i n e d f o r i r o n and z i n c o n l y . Copper and l e a d were n o t t e s t e d b e c a u s e o f t h e i r e x t r e m e low l e v e l s . The o n l y s i g n i f i c a n t c o r r e l a t i o n f o r i r o n v s . f l o w , -.68, was found d u r i n g t h e low f l o w p e r i o d of May-July. The c o r r e l a t i o n c o e f f i c i e n t f o r z i n c was n e g a t i v e , t h e c o r r e l a t i o n c o e f f i c i e n t f o r i r o n d u r i n g t h e October-December low f l o w p e r i o d was a l s o n e g a t i v e . Even though t h e s e c o r r e l a t i o n c o e f f i c i e n t s were n o t s t a t i s t i c a l l y s i g n i f i c a n t t h e r e a p p e a r s t o b e a n i n v e r s e r e l a t i o n s h i p o f t h e d i s s o l v e d m e t a l s t o f l o w d u r i n g low f l o w p e r i o d s . S i g n i f i c a n t c o r r e l a t i o n c o e f f i c i e n t s f o r z i n c v s . f l o w were found d u r i n g t h e h i g h f l o w p e r i o d s o f J a n u a r y - A p r i l and August-September