Designing Autonomous and Dynamic
Algorithm for Intelligent Public
Transportation Management System
Sarita Deshpande[1], Shreyas Karne[2], Karan Pandya[3], Purva Tapre[4]
Professor, Dept. of I.T., P.E.S MCOE, Savitribai Phule University, Pune, Maharshtra, India[1]
B.E, Dept. of I.T., P.E.S MCOE, Savitribai Phule University, Pune, Maharshtra, India[2,3,4]
ABSTRACT: The foremost issue that exists in the implementation of smart city is the revision of the bus routes. In the existing system, each depot has predefined routes and predefined number of buses running on that route after fixed interval of time. This results in passenger inconvenience, resource underutilization, and decreasing revenues. This can be improved by an autonomous route suggestion algorithm by considering minimal data input using android application, which can be utilized at regular intervals for allocating buses to a route as per the need. After the reallocation of buses, the timetable will be dynamically updated and made available for passengers for better passenger convenience.
KEYWORDS:Autonomous Multithreading algorithm; Allocation of routes; Android application; Dynamic timetable.
I. INTRODUCTION
Public transport is a shared passenger-transport service which is available for use by the general public. Public transport modes include city buses,trolleybuses,trams and passenger trains,rapid transit like metro, subways, undergrounds, and ferries. As public transport is available for people of all age groups, is less prone to accidents, and is much cheaper mode of transport, it is preferred by most of the people in cities.
Pune is 9th most populated city in India.There are around 2,400 buses with the PMPML in which, 1,267 are PMPML-owned, 200 are on Public-Private Partnership basis, 377 on rental basis and 205 on contract. In the existing PMT system, the routes for buses are pre-decided and the number of buses that will run on that route are also fixed. The frequency of buses for each route is also fixed. Around 550 buses are always kept off road because of repairs. This creates shortage of buses on some routes which results in passenger inconvenience [4]. In the peak hours of traffic, the time between two buses of same route goes on increasing due to traffic on road, which disturbs the bus timetable severely. It is commonly seen that on some routes bus don’t appear for a prolonged period and then multiple buses arrive one after the other. In this situation, the first one or two bus go crowded while other go empty. This adversely affects the revenue of PMPML. In addition to this PMT faces a daily loss of Rs.9000 on account of repairs and maintenance. Revenue is main concern of PMPML today. According to officials of PMPML, there is no shortage of resources but they are not smartly utilized.
Mobile Ad Hoc Networks (MANETs) consists of a collection of mobile nodes which are not bounded in any infrastructure. Nodes in MANET can communicate with each other and can move anywhere without restriction. This non-restricted mobility and easy deployment characteristics of MANETs make them very popular and highly suitable for emergencies, natural disaster and military operations.
II. RELATEDWORK
Public transport control systems received rapid promotion with the development of mobile technologies and a lot of countriesinvesting this sector. In this section we will summarize the work being done for intelligent systems being used in public transport for better resource utilization.
A. Dynamic Bus Route Allocation
A heat-map is provided with population description depicted by three colors, red, orange and yellow, respectively depicting dense population, mild population and sparse population. Depending upon the heat map generated, Aditya Agrawal and PreetiNagrath [1] have proposed three strategies for dynamic route allocation of buses:
Strategy 1:
The first strategy uses population density as primary criterion. The algorithm for this strategy is designed to provide maximum coverage of the routes, increasing connectivity to areas of high population density. This will provide viable access to densely populated areas.
Pros:
Provides improved connectivity to densely populated areas. Converges most of the routes around the populated hubs of a city. Cons:
Amplifies traffic congestion in already traffic-prone areas.
Escalates pollution levels around the densely populated regions of the city.
Strategy 2:
The second strategy uses lowest population density as the deterministic factor. This strategy suggests that the bus stands existing in the most densely populated regions to be used the least, instead the nearby bus stands, of low population density, should be promoted. And thus, the existing routes would be reorganized to facilitate routes which provide ease in traffic movement across the city.
Pros:
Improves the traffic scenario across the whole city.
Mitigation of pernicious pollution caused by buses in the populated regions of the city. Cons:
The average commuter would need to travel more for the ‘boarding point’.
Might cause a stir during implementation due to exclusion of ‘heavily boarded’ bus stands.
Strategy 3:
The third strategy uses average ticket collection at every bus stop as the deterministic factor. It also takes into account the traffic status of various areas at timings of our consideration. The collection percentage generated by data analysis and collection, is used to allocate the same percentage of buses to the respective routes. As the collection percentage differs, different allocation percentage would also exist.
Pros:
Cons:
Minimal savings of resources or mitigation of empty bus travels.
Minimum as well as Maximum criterion would exist, to provide limits to which allocation is done. Thus ramification would be traffic congestion or profligate usage of resources.
B. Dynamic Bus Tracking using Android and IOT
Asimple Android and IOT based approach is proposed by Shiv. H. Sutar, RohanKoul, Rajani Suryavanshi [3] that provides dynamic bus tracking information to the bus-stops as well as the commuters in an efficient manner. An android phone is equipped on the bus which is used to track the position of the bus using the inbuilt GPS of the phone. The collected location information is then sent to a server using 3G network of the phone. The received data is used to extract meaningful information which is then used to service various queries. A SMS based system is used by computers to track the location of the bus in real-time as well as plan their journeys in advance. Installation of static QR codes on each bus-stop which proves to be an effective measure to provide information to passengers regarding the buses going through that bus-stop.
Pros:
Location of bus is easily tracked
Estimated Time Arrival of bus is available to users Cons:
Resources underutilized
In case of network failure, the whole system crashes Revenue problem remains unsolved
III. PROPOSEDSYSTEM
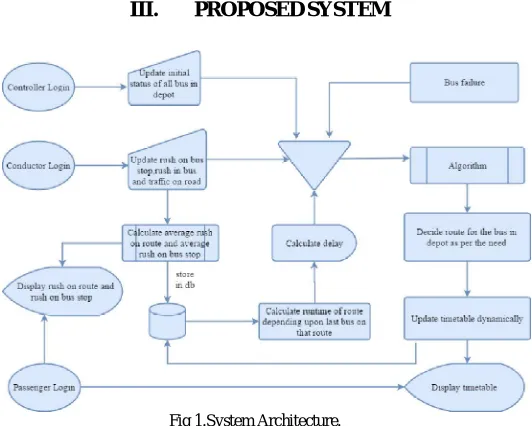
Fig 1.System Architecture.
An android application is provided to conductor and passenger, while a web page is provided to controller in the system[7][8]. At the start of the day, the controller will update the number of buses that are out of service or are still in reparation. The data for these buses will be updated in database as out of service. The conductor will login from android application and update the following data using radio buttons: low, medium, high, on pre-decided main bus stops only:
Traffic on road
On each route, as per the pre-decided timetable, buses are sent. The data will be stored in database and as soon as bus will complete its round journey, the average rush on route, average rush on each bus stop will be calculated. The conductor will also have an option to report problem in case of bus failure, or stuck in heavy traffic. Delay for a bus will be calculated depending upon runtime taken by the latest bus on same route, which will be then saved in database.
The number of working buses, the average rush on each route, and delay on each route will be provided as input to algorithm. The algorithm will then compute the route which needs the bus, and will indicate about the same to controller. The output hence generated will be displayed to controller of the hub, who will take final decision and report about the same to conductor and driver of the bus.Once the decision is taken, the bus along with timing will be updated in database. Thus passengers can have an access to dynamic timetable. The passengers can also view the status of bus as updated by conductor.
When a passenger will login using android application, and enter his source and destination, he will be provided with all possible routes. Once he selects the route, he will be notified with the rush on the route and rush on source bus stop. The passenger login will be used as counter for analysing number of people on willing to travel on that route, which will be an useful additive for better algorithmic decision.
This system will help in avoiding multiple buses running one after the other on same route, where few initial bus go full while remaining have go almost empty. Also on some route if there is bus failure, the system will immediately route available bus in depot on that route to avoid congestion and provide better passenger convenience. Also some routes have high people getting on bus during peak times. In this scenario, using this system, more buses can be provided on such route so that to grab most passengers. The status of bus and dynamic timetable will help passengers get latest update of bus on the route they wish to travel increasing passenger convenience greatly.
IV. PSEUDOCODE
// Dynamic_Allocation_of_Bus
// Let R = Number of routes on hub H such that Ri = ith route on hub H 1 ≤ i ≥ R // Let N = Number of buses on hub H such that Nij = jth bus on ith route
// Let ∆Ni = Delay between buses on route i
// Let FTi = Time interval after which bus send on route i // Let Rushi = Rush on route i
// Let LBi = Time taken by latest bus on route i
Step 1. Send bus Nij on route Ri after the route’s FTi.
Step 2. When bus Nij completed its journey at returns to hub H, calculate its round time. Step 3. Calculate
ß= (LBi-FTi) for each route.
Step 4. Send bus Nij to route having maximum ß. Step 5 .If ßmax is same for two or more routes
Then,
Send bus Nij to route having maximum (Rushi)
V. COMPARISIONANDTRADITIONALANDPROPOSEDSYSTEM
In the existing system, the buses run on the pre-defined routes, a delay occurs between two buses of same route. As the time passes, the delay goes on increasing. To illustrate the same, we have developed a simulation of traditional method. In the proposed system dynamic route allocation system for buses is used, using the concept of multithreading in parallel[5]. Each route has its own thread for execution and all threads work simultaneously, giving a real time
Rushi =∑ RushoneachstopofRoutei
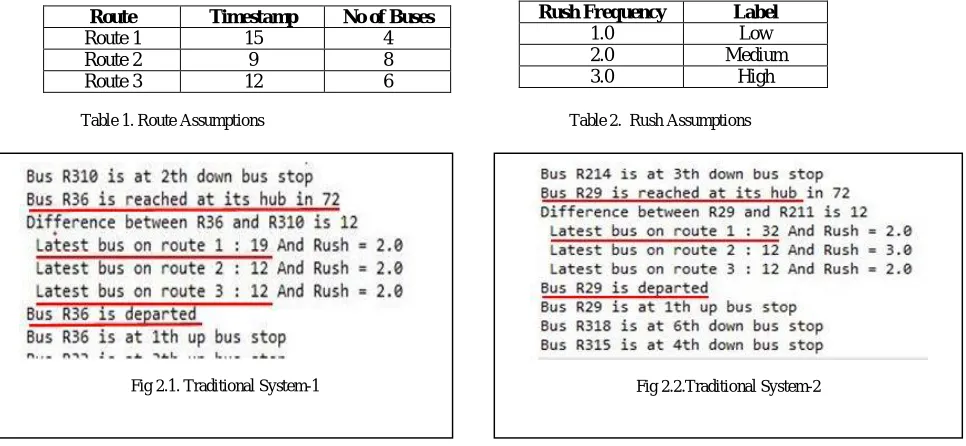
simulation. The route assumption, table 1 and rush assumptions, table 2 are same as traditional method. Following are the assumptions used:
Route Timestamp No of Buses
Route 1 15 4
Route 2 9 8
Route 3 12 6
Table 1. Route Assumptions Table 2. Rush Assumptions
In figure (2.1), it can be observed that delay on route 1 is 19-15=4 and rush is 2 i.e. medium, whereas on route 3 is 12-12=0 and rush is 2 i.e. medium. Although there is no delay or high rush on route 3, the bus R36 is again sent on its pre-decided route 3 itself. In figure (2.2), it can be observed that delay on route 1increases up to 32-15=17, on route 2 delay is 12-9=3 while on route 3 is 12-12=0. Although delay on route 1 is much higher than delay on route 2, the bus R29 is still sent on its pre-decided route 2 itself. The delay on route 1 is 17, which is more than its frequency and will create a major problem in working of the system, but in traditional method it is not considered.
In figure (2.3), it can be observed that on route 2 delay is 9=3 and rush is 3 i.e. high while on route 3 is 12-12=0 and rush is 2 i.e. medium. Although there is higher rush on route 2, the bus R35 is again sent on its pre-decided route 3 itself. The revenue gets highly affected because of not considering rush in traditional method.
Rush Frequency Label
1.0 Low
2.0 Medium 3.0 High
Fig 2.1. Traditional System-1 Fig 2.2.Traditional System-2
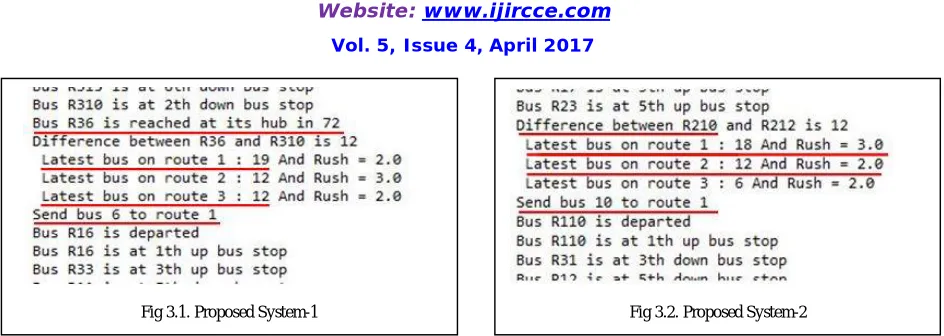
In figure (3.1), it can be observed that delay on route 1 is 19-15=4 and rush is 2 i.e. medium, on route 2 delay is 12-9=3 and rush is 3 i.e. high while on route 3 is 12-12=0 and rush is 2 i.e. medium. Unlike traditional method, the bus is sent to route 1 where there is maximum delay, using the algorithm.In figure (3.2), it can be observed that delay on route 1 is 18-15=3 and rush is 3 i.e. high, on route 2 delay is 12-9=3 and rush is 2 i.e. medium. Unlike traditional method, ref figure 3, the bus 10 is sent to route 1 where there is maximum rush as delay on route 1 and route 2 is same i.e. 3, using the algorithm. Hence rush is targeted and revenue won’t be adversely affected.
VI. ANALYSISRESULT
A. Delay on route
In existing system, delay between two buses on same route is:
.
Using algorithm, the delay between two buses is reduced. The delay using algorithm is:
Where,
UBi = Time taken by previous bus to reach hub – Time taken by current bus from hub on route i
Where,
R = Total number of route
∆ = Error factor
The delay on route is distributed among all the routes of hub.
As the number of routes increase the delay is highly distributed and thus delay decreases.
B. Revenue Generation
In traditional method, buses travel on their pre-defined routes irrespective of the rush on routes. Depending upon the time slot of day, day of week, or even season, the rush on a route may change. It may be low, medium or high ,whose ranges are as given in table 3 ,depending upon various factors mentioned above.Consider, the following ranges for rush:
Label Range Low 0-30% Medium 30-70%
High 70-100%
Table 3: Range assumptions for range
In ideal conditions, we consider that there is medium rush on a route.
Fig 3.1. Proposed System-1 Fig 3.2. Proposed System-2
Di = ∆Ni - FTi.
Di = MIN (UBi).
∴ Di= [(∆Ni - FTi) / R] ± ∆.
∴Di α 1/R.
Using algorithm, route for a bus is selected depending upon rush on routes. Mainly the routes having highest rush are selected. In worst condition, the minimum of high range will be the rush on route.
On comparing traditional way with the new proposed way, it can be observed that, the rush targeted in traditional method i.e. 50 % goes up to 70% in proposed way. Hence, the almost 20% more rush can be targeted using algorithm.
VII. CONCLUSIONANDFUTUREWORK
From the above analysis, it can be clearly stated that dynamic allocation of routes for buses can greatly help PMPML for using the resources to an optimal level. As at least 20% more rush is targeted, the revenue problem which is a main issue faced by PMPML can be easily solved. As seen above, bus failure is a major out looked drawback of PMPML. The delay caused due to bus failure as well as due to traffic hours, is efficiently managed using this algorithm. This system will not only be beneficial for PMPML but also for the passenger as they can live update of route and bus they wish to travel with.
REFERENCES
1. Aditya Agrawal and PreetiNagrath, “Analyzing and Designing Automated and Dynamic Bus Route Allocation - Bus Transport Optimization
Technique” IEEE, Information and Communication Technologies, 978-1-5090-0082, March 2016.
2. Denis M. Manumbu, Egbert Mujuni, “Mathematical Formulation model for school bus Routing Problem with small instance data”,
IISTE, Vol 4, pg no 121-132, 2014.
3. Shiv. H. Sutar, RohanKoul, Rajani Suryavanshi, “Integration of Smart Phone and IOT for development of Smart Public Transportation
System” 2016 International Conference on Internet of Things and Applications (IOTA), IEEE, pp73-78,2016.
4. Number of buses with PMPML: http://www.sakaaltimes.com/newsdetails.aspx?newsid=5491865063366115224
5. Multithreading: https://www.javatpoint.com/multithreading-in-java
6. “Java The Complete Reference Ninth Edition” by Herbert Schildt.
7. Android app deveoplemt: https://www.tutorialspoint.com/android/
8. PMMPL info : https://www.pmpml.org
9. Web page development:https://www.tutorialspoint.com/internet_technologies/websites_development.htm
10. Amudapuram Mohan Rao, KalagaRamachandraRao, “Measuring Urban Traffic Congestion – a Review”International Journal for Traffic and
Transport Engineering, 2(4): 286 – 305,2012
BIOGRAPHY
1. Prof. S. D. Deshpande is a Professor in Information Technology Department, P.E.S Modern College of Engineering, SavitribaiPhule Pune University.
2. Shreyas Karne is a student pursuing Bachelor of Engineering degree in Information Technology from P.E.S Modern College of Engineering, SavitribaiPhule Pune University.
3. Karan Pandya is a student pursuing Bachelor of Engineering degree in Information Technology from P.E.S Modern College of Engineering, SavitribaiPhule Pune University.
4. Purva Tapre is a student pursuing Bachelor of Engineering degree in Information Technology from P.E.S Modern College of Engineering, SavitribaiPhule Pune University.