University of Windsor University of Windsor
Scholarship at UWindsor
Scholarship at UWindsor
Electronic Theses and Dissertations Theses, Dissertations, and Major Papers
2016
Development of Communication Link Perception for Decision
Development of Communication Link Perception for Decision
Making in Mobile Agents
Making in Mobile Agents
George Michael Pantelimon University of Windsor
Follow this and additional works at: https://scholar.uwindsor.ca/etd
Recommended Citation Recommended Citation
Pantelimon, George Michael, "Development of Communication Link Perception for Decision Making in Mobile Agents" (2016). Electronic Theses and Dissertations. 5757.
https://scholar.uwindsor.ca/etd/5757
This online database contains the full-text of PhD dissertations and Masters’ theses of University of Windsor students from 1954 forward. These documents are made available for personal study and research purposes only, in accordance with the Canadian Copyright Act and the Creative Commons license—CC BY-NC-ND (Attribution, Non-Commercial, No Derivative Works). Under this license, works must always be attributed to the copyright holder (original author), cannot be used for any commercial purposes, and may not be altered. Any other use would require the permission of the copyright holder. Students may inquire about withdrawing their dissertation and/or thesis from this database. For additional inquiries, please contact the repository administrator via email
Development of Communication Link Perception for
Decision Making in Mobile Agents
By
George Michael Pantelimon
A Thesis
Submitted to the Faculty of Graduate Studies
through the Department of Electrical and Computer Engineering in Partial Fulfillment of the Requirements for
the Degree of Master of Applied Science at the University of Windsor
Windsor, Ontario, Canada
2016
Development of Communication Link Perception for
Decision Making in Mobile Agents
George Michael Pantelimon
APPROVED BY:
______________________________________________ Dr. J. Defoe
Mechanical, Automotive, and Materials Engineering
______________________________________________ Dr. E. Abdel-Raheem
Electrical and Computer Engineering
______________________________________________ Dr. R. Carriveau
Civil and Environmental Engineering
______________________________________________ Dr. K. Tepe, Advisor
Electrical and Computer Engineering
iii
AUTHOR`S DELCARATION OF ORIGINIALITY
I hereby certify that I am the sole author of this thesis and that no part of
this thesis has been published or submitted for publication.
I certify that, to the best of my knowledge, my thesis does not infringe
upon anyone’s copyright nor violate any proprietary rights and that any ideas,
techniques, quotations, or any other material from the work of other people
included in my thesis, published or otherwise, are fully acknowledged in
accordance with the standard referencing practices. Furthermore, to the extent that
I have included copyrighted material that surpasses the bounds of fair dealing
within the meaning of the Canada Copyright Act, I certify that I have obtained a
written permission from the copyright owner(s) to include such material(s) in my
thesis and have included copies of such copyright clearances to my appendix.
I declare that this is a true copy of my thesis, including any final revisions,
as approved by my thesis committee and the Graduate Studies office, and that this
thesis has not been submitted for a higher degree to any other University or
iv
ABSTRACT
Examination and comparison of Packet Error Rate (PER), Error Burstiness (EB),
and Receive Signal Strength Indicator (RSSI) as communication connectivity
management metrics for multi-agent mobile robot networks are explored in this
thesis. Assessment Accuracy (AA) and Time To Process (TTP) are used as
parameters for the comparison of metrics given that mobile robots are required to
make critical decisions rapidly. The initial investigations are done with a mobile
unit making PER, EB, and RSSI measurements at an increasing distance from a
base station. A relatively linear relationship between PER and EB was discovered
with a R2 value of .967. Strong correlations between EB and PER were observed in
areas between 0% and 50% PER. A communication aware algorithm was
developed using both EB and PER to allow the mobile agent to assess the Link
Quality (LQ) faster in scenarios of communication loss by scanning for error
bursts.
v
DEDICATION
To my parents Ion and Camelia Pantelimon who have helped and supported me
over the years. I am truly thankful for your dedication towards me.
To Wayne and Purita Bristow, whose generous scholarship and support have
vi
ACKNOWLEDGEMENTS
I would like to thank my supervisor and co-supervisor, Dr. Tepe and Dr. Carriveau
who have been my mentors and have lead me on the pathway to success.
Additionally I would like to thank the rest of my committee Dr. Abdel-Raheem
and Dr. Defoe for their useful feedback and assistance.
Finally I would like to thank the rest of team members in the WICIP Lab for their
support and positivity.
vii
TABLE OF CONTENTS
AUTHOR`S DELCARATION OF ORIGINIALITY ... iii
ABSTRACT ... iv
DEDICATION...v
ACKNOWLEDGEMENTS ... vi
LIST OF TABLES ... ix
LIST OF FIGURES ...x
LIST OF ABBREVIATIONS/SYMBOLS ... xii
CHAPTER 1 INTRODUCTION ...1
1.1 Problem Statement ... 2
1.2 Main Contribution ... 2
1.3 Organization of the thesis ... 4
CHAPTER 2 SURVEY OF MULTI-AGENT COMMUNICATION STRATEGIES ...5
2.1 Communication Strategies for Mission Control ... 6
2.2 Communication Strategies for Formation Control ... 8
2.3 Multi-agent drone applications with communication strategies ... 9
2.3.1 Centralized Base Stations ... 10
2.3.2 Centralized Leader-Follower ... 12
2.3.3 Centralized Virtual Structure ... 13
2.3.4 Decentralized and Virtual Structure ... 13
2.3.5 Decentralized Leader-Follower ... 14
2.4 Common Communication Hardware Used ... 16
2.5 Conclusions ... 18
CHAPTER 3 ANALYSIS OF PER, EB, AND RSSI AS LINK QUALITY METRICS FOR CONNECTIVITY MANAGMENT ...19
3.1 Background ... 21
viii
3.1.2 Packet Error Rate ... 21
3.1.3 Error Burstiness ... 22
3.2 Examination of RSSI, PER, and EB at communication link limits ... 22
3.2.1 Methodology ... 22
3.2.2 Packet Error Rate ... 22
3.2.3 RSSI ... 24
3.2.4 Error Burstiness ... 25
3.2.5 Error Burstiness in Correlation to Packet Error Rate ... 28
3.3 Error Burstiness Based Connectivity Management ... 29
3.3.1 Design of EB Experiments ... 30
3.3.2 Hardware ... 31
3.3.3 Experimental Results ... 31
3.4 Conclusion ... 34
CHAPTER 4 COMMUNICATION LINK PERCEPTION FOR MOBILE AGENTS ...35
4.1 PER Metric ... 35
4.2 EB Metric ... 36
4.3 Integration of PER and EB for the Development of a Communication Perceptive Algorithm for UVs. ... 37
4.3.1 Methodology ... 37
4.3.2 Link Quality Classification from Results ... 37
4.3.3 Development and Implementation of Communication Aware Algorithm ... 39
4.3.4 Flexibility of Different Window Sizes ... 41
4.4 Conclusions ... 41
CHAPTER 5 CONCLUSIONS ...43
REFERENCES/BIBLIOGRAPHY ...44
ix
LIST OF TABLES
Table 2-1: Major advantages and disadvantages of centralized and decentralized
control architectures ... 7
Table 2-2: Communication implications for different formation architecture ... 9
Table 2-3: Popular communication hardware used in drone communication ... 17
Table 3-1: Error burstiness counting algorithm ... 26
Table 3-2: Experimental results for different error bursts ... 32
Table 3-3: Experimental results for EB in different directions ... 33
Table 4-1: EB and PER algorithm ... 40
x
LIST OF FIGURES
Figure 2.1: Centralized Communication Strategy ... 6
Figure 2.2: Decentralized Communication Strategy ... 7
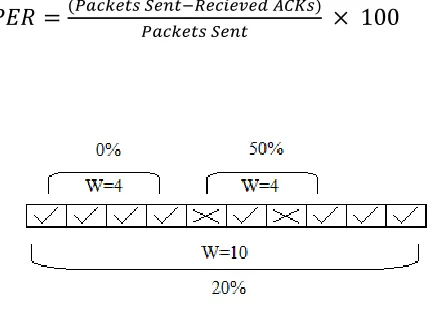
Figure 3.1: A smaller window size provides a unstable PER reading, while a larger window provides a much more accurate reading at the expense of more time. .... 23
Figure 3.2: A window size of 5 shows a much larger PER then a window size of 20, where W=20 shows a much more stable PER. ... 24
Figure 3.3: Packet Error Rate versus Distance ... 24
Figure 3.4: RSSI versus Distance ... 25
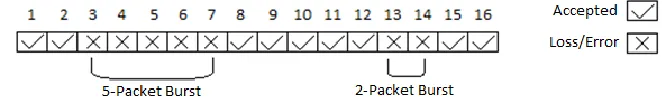
Figure 3.5: In this examination of 16 transmitted packets two separate bursts are illustrated... 25
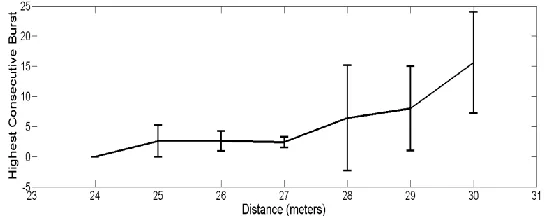
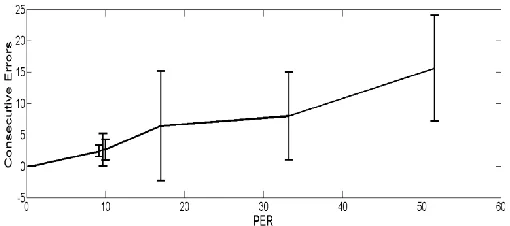
Figure 3.6The highest consecutive loss is graphed against distance. ... 27
Figure 3.7: The second highest consecutive loss is graphed against distance ... 27
Figure 3.8: The third highest consecutive loss is graphed against distance ... 27
Figure 3.9: Burstiness versus Packet Error Rate R2=.967 ... 28
Figure 3.10: Burstiness versus Packet Error Rate R2=.945 ... 28
Figure 3.11: Burstiness versus Packet Error Rate R2=.850 ... 28
Figure 3.12: Visualization of the Decision Making Process... 29
Figure 3.13: The procedure followed to collect data ... 30
Figure 3.14: Visualization of the Experimental Setup ... 31
xi
Figure 3.16: Visualization of 5 consecutive error stopping distances to test out
boundaries in two directions ... 34
Figure 4.1: Two different data streams with the same PER but with different EBs ... 36
Figure 4.2: Moving PER with a window size of 20 ... 38
Figure 4.3: Probability of two consecutive errors occurring ... 38
Figure 4.4: Probability of five consecutive errors occurring ... 39
xii
LIST OF ABBREVIATIONS/SYMBOLS
Abbreviation Definition
AA Assessment Accuracy
ACKS Acknowledgements
AUV Aquatic Unmanned Vehicles
BS Base Station
CoCoRo Collective Cognitive Robots
CPU Central Processing Unit
EB Error Burstiness
GPRS General Packet Radio System
GPS Global Positioning System
GSM Global System for Mobile
Communications
LQ Link Quality
NMEA National Marine Electronics
Association
PER Packet Error Rate
PWM Pulse Width Modulation
RSSI Received Signal Strength Indicator
SMS Short message Service
SSDL Scalable Data Delivery Layer
TTP Time to Process
TCP/IP Transmission Control Protocol/ Internet
Protocol
UAV Unmanned Aerial Vehicles
UGV Unmanned Ground Vehicles
UV Unmanned Vehicles
xiii
Symbol Definition
Decision making time for PER
Decision making time for EB
Transmission time of a packet
Time taken to receive an
acknowledgement
Maximum allowed EB
Average transmission and
acknowledgment receive time
Desired decision making time
1
CHAPTER 1
INTRODUCTION
Expeditious improvements in UV (Unmanned Vehicle) technology have led to an
increased popularity of their use for research purposes, particularly in the data acquisition
sector. Multiple UVs can be networked to create UV swarms which are capable of
working collectively to fulfill and accomplish mission requirements. UV agents working
in unison are capable of collecting data more efficiently and can act as sensor networks
As most current sensor networks are stationary the use of UVs improves research
capabilities through more dynamic data collection.
Different communications and formation structures exist, however they all rely on
a communication link. Competent information transfer between UVs as well as between
UV and Base Station (BS) is a fundamental step to providing a robust and efficient
communication link. Consequently, an unreliable communication link can fail to provide
essential information such as navigational or sensor data, which can result in an
unsuccessful mission. Therefore maintenance and understanding of this link is pivotal to
advancements in information processing through a stable connection link for UVs.
The intention of UV swarms is full autonomy, therefore each UV should be
perceptive of its link quality (LQ) and be able to make individual decisions.
Understanding of its link quality allows a UV to make corrections if it senses a poor
connection with the BS, and allow it to avoid losing connection and the loss of critical
information. Requirements of LQ perception are speed to contend with agile moving UVs
and accuracy in order to avoid over and under correction. In practice a tradeoff between
these requirements is needed. Generally the examination of the ratio of successful packets
to lost packets can give some insight of the quality of the communication link.
Furthermore a large sample size of this ratio will lead to an increased accuracy of LQ,
but since each additional transmitted packet requires a certain transmission and receive
2
1.1 Problem Statement
Communication LQ in small radios implemented on robotic systems are
negatively affected by two major components: range and line-of-sight. To optimally
acquire a good communication link a transmitter/receiver pair must be within a certain
distance threshold which is based on the constraints of the hardware; this is defined as its
range. As a radio moves further it is affected by a reduction in power density which is
due to path-loss effects. Furthermore the transmitter/receiver pair must not be inhibited
by any objects which do not allow the penetration of radio waves or do not allow a direct
line-of-sight. The focus of this work is to combat the range limitations of hardware by
examining LQ as it goes from good to poor.
Currently in multi-agent systems the primary focus is on control and navigation
with limited work focused around communication management. Limitations in this field
are due to the novelty of autonomous unmanned systems. Other issues include
indentifying popular communication hardware used in current UV swarms which will
help establish appropriate metrics for communication management. Accuracy and
decision making time are the major criteria for these metrics in order to contend with the
rapid movements of UVs. Finally for the development of autonomous multi-agent
systems a classification of LQ should be developed.
1.2 Main Contribution
An assessment and classification is done for current multi-agent robotic
communication systems used for sensor networking. Major communication structures are
categorized as centralized and decentralized. Additionally two major formation control
systems are identified as leader-follower and virtual structure. WiFi and XBee were
found to be the most popular packet transmission communication used in current
research. Through the analysis of previous literature communication was identified as an
integral part of multi-agent robotic networks. An understanding of how to improve and
maintain the communication link is imperative to multi-agent robotics systems. The
3
able to monitor its own connection. An increase in the separation distance between agents
will increase the chance of communication deterioration because of path-loss effects. An
agent equipped with a communication link perception algorithm can monitor its link and
have the capability to correct this link in order to avoid losing connection.
Three potential metrics were identified: Packet Error Rate (PER), Received
Signal Strength (RSSI), and Error Burstiness (EB). Each metric was individually tested
on a moving mobile platform while recording packet transmission data. The mobile agent
was programmed to transmit and to tabulate successful and failed transmission by
keeping track of received acknowledgements (ACKS). This received data is referred to
as the packet stream, where successful transmissions were given the value one and lost or
unsuccessful transmitted packets were given the value zero. Analysis of this stream was
done with PER and EB at increasing distances from the BS. EB was shown to have a
linear relation to PER and was able to estimate the LQ faster.
Finally, the assessment of LQ was done through a combination of PER and EB
values. PER in this work is the ratio of lost packets to the number of sent packets
considered in a moving window. Window size optimization is also discussed in order to
provide as close to real-time analysis of LQ as is practical. EB in this thesis is represented
as consecutive lost/error packets. Larger consecutive errors are shown to yield a less
reliable LQ. The combination of these two metrics allows for a communication aware
system that can bridge the gap between accuracy and decision making time, which are
trade-offs because accuracy increases with more data points at the cost of time. LQ is
classified as one of three regions: good, tolerable, and unreliable. Good regions are ones
which provide stable and constant LQ with zero PER, tolerable regions are susceptive to
some loss but with .10 PER or less, and unreliable are regions with a volatile PER over
.10 , they are also prone to EB of size two. Since multi-agent robotics are deployed with
data collection as a primary focus, connectivity management is designed as a secondary
process. The system developed is light-weight computationally and will not take away
from mission objectives. Additionally the system is flexible to work on different robotic
4
1.3 Organization of the thesis
Chapter 2 reviews popular multi-agent systems used in applications and
categorizes them based on communication structure and formational control. Advantages
and disadvantages are listed for both centralized and decentralized communication
structures. Additionally both leader-follower and virtual structure formation control
systems are also compared. Different multi-agent systems with experimental results are
summarized and their success and failures are highlighted. Finally the most used
communication hardware systems are compared by five different parameters.
Comparison of PER, EB, and RSSI is done in Chapter 3 by examining the change
of each in respect to distance moved away from the BS. Analysis is primarily focused
around the examination of the change in LQ. A close relation between PER and EB is
demonstrated. Experiments were conducted to test different values of EB stopping
thresholds for the mobile agent. It is shown that each EB threshold corresponds with a
different stopping distance and PER.
Chapter 4 details the perception algorithm developed from the hybrid of PER and
EB. Window size optimization is discussed as different radios have different transmission
speeds. A window size is chosen which was optimized for our hardware. A moving
average PER was implemented through the use of this window and a maximum allowable
EB threshold was chosen, which was determined through experimentation to improve
LQ.
Future works and improvements are considered in Chapter 5 alongside the
5
CHAPTER 2
SURVEY OF MULTI-AGENT COMMUNICATION STRATEGIES
Ground, sea, and airborne drones have become flexible tools for research and
commercial applications in the military, agriculture, forest fires, chemical sensing,
meteorological sensing and countless other rapidly evolving areas [1,2,3,4,5]. Their
popularity has increased with the development of longer run times, higher payload
capacities, improved stability, and increasingly accessible pricing [6]. Concurrently, the
broad spectrum of communication and sensing technologies available for a wide variety
of applications has been reduced in size and complexity to enable easier integration into
robotic systems. Subsequently these advancements in individual drone performance have
since better enabled the utilization of coordinated groups of drones or ‘agents’ [7].
Multi-agent deployments can increase both the diversity of sensory data possible and the spatial
extent over which sensing can be deployed. Entire data fields can be harvested as
opposed to single point sampling. Having multiple agents also promotes mission
robustness through individual agent redundancy. While team deployments have many
merits, some fundamental challenges remain that include determining the optimal control
and/or coordination strategy [8]. Underpinning the success of the control philosophy and
the coordination of the data collection is the requirement for a robust and efficient
communication strategy [9]. In this paper our major focus is on the principal aspects of
communications strategies critical to multi-agent drone formation architectures, mission
planning, and communication hardware selection.
Multi-agent control and communication strategies often fall into one of two
categories: centralized or decentralized architectures. The following sections will
describe and compare these architectures and the sub-classes within them. Then, specific
applications of these approaches will be discussed. Finally, we will offer commentary
6
2.1 Communication Strategies for Mission Control
Presently there are two primary ways of routing information in a multi-agent
system for mission planning, namely centralized and decentralized, where the following
section will examine the strengths and weaknesses of each communication strategy. In
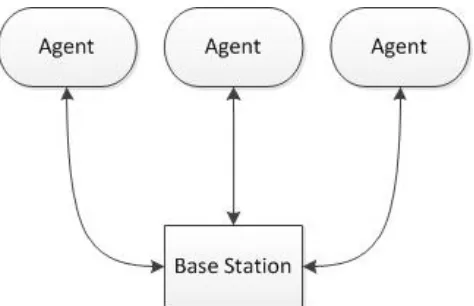
the centralized approach a base station is utilized; the communication system can be
described as point to multi-point as seen in Fig 2.1. In this configuration all computations
and critical decisions are made at a central base, depending on the sensory data gathered
[10,11]. The base station is able to communicate with each agent and exercise control
over it. This affords a central location for human intervention in drone team operation
should it be required. Further, having the central command centre bear the burden of
control and communications tasks, the agents can have increased capacity for sensory
infrastructure, payload, etc.. In this approach, each agent will communicate with the base
station exclusively, not with other agents.
Fig. 2.1 Centralized Communication Strategy
In a decentralized approach as in Fig 2.2, communications are accomplished
through direct agent-to-agent interaction, which can be described as a mesh
communication strategy [12,13]. Each agent is capable of making decisions, which will
ultimately be governed by a hierarchy or algorithm to ensure order. Decisions will be
based on sensory data collected, and will vary based on the application. This approach
7
more autonomous mission development. A key advantage to this architecture is that the
multi-agent team is not limited by the communication range of the base station; further,
each unit can work as an individual or in a team. Table 1 highlights the critical
advantages and disadvantages of architectures.
Fig. 2.2 Decentralized Communication Strategy
TABLE2-1
Major advantages and disadvantages of centralized and decentralized control architectures
Centralized Advantages Disadvantages
Central authority responsible for critical decisions
Communications limited to base station range
No need for agent-to-agent communications
Complete reliance on base station availability
Single agent loss has minimal impact on mission objectives
Computational requirements increase with addition of agents
Decentralized
Individual agent autonomy Hierarchy or a coordination algorithm needs to be developed
Not limited to central base station range
Strong inter-agent dependency will reduce mission robustness
8
2.2 Communication Strategies for Formation Control
The two most common formation control strategies are leader-follower and virtual
structure. In leader-follower, a leader is chosen and the rest of the agents are assigned as
followers [14,15]. The group leader broadcasts its position information to the followers who then
begin to follow the leader at an offset. Position information such as Global Positioning System
(GPS) coordinates or National Marine Electronics Association (NMEA) strings can be broadcast
through multiple mediums such as Wireless Fidelity (WiFi) also known as IEEE 802.11 [16]
modules and/or Zigbee also known as IEEE 802.15.4 [17] radios. Each follower will have a
predetermined offset that they follow depending on the shape of the formation required. Another
option is to route the position information through a base station, which in turn would relay the
appropriate information to the follower agents. Subsequently, distance and course offsets have to
be chosen judiciously to avoid collisions. This system offers a simplified communications
framework which is balanced by the risk associated with a single critical point of failure in the
leader.
In virtual structure formations all the units are considered to be a rigid body and move as
one whole group [18]. All agent positions are established relative to the centroid of a virtual
body. To ensure proper orientation and collision avoidance, individual trajectories are constantly
calculated. Each agent will be transmitting and receiving position information frequently,
therefore a high speed and low latency system is critical. In addition to the previous
requirements, a robust and capable controller is also required. It follows that controller
complexity will scale with the addition of agents to the system. Further, it should be noted that
constant feedback is required by the controller for each agent; thus increasing the overall
communication requirement. This structure will provide a more robust result but it is reliant on
the design of a suitably complex controller. Table 2-2 highlights the critical advantages and
9 TABLE2-2
Communication implications for different formation architectures .
Leader-Follower Advantages Disadvantages
Simple communications: One-Way
Broadcast
Scalable to large group of followers
Single-Point of Failure (Leader)
Simple to implement
Virtual Structure
Each drone is given precise trajectories
Hierarchy or a coordination algorithm needs to be developed
More robust Strong inter-agent dependency will reduce mission robustness
Dependent on controller
2.3 Multi-agent drone applications with communication strategies
Given the relative novelty of the drone sector, and the explosive growth in drone
technology, few standards exist to serve as a basis of comparison among the great variety
of research efforts. The authors have here endeavoured to broadly categorize a number
of prominent multi-agent communication strategies from the literature in the context of
10
2.3.1 Centralized Base Stations
Bürkleetet al. [19] enhanced the ground station developed by Fraunhofer Institute
of Optronics, System Technologies and Image Exploitation [20] and utilized it as the
main control station to coordinate unmanned aerial vehicles (UAVs) and unmanned
ground vehicles (UGVs). In this system, smart cameras were installed on the UAVs,
which provided the operator with a real time view of agents, along with GPS coordinates
and altitude. This information was transmitted to the ground station through a tiny WiFi
module capable of network communication, which provided high data rates and long
range. The ground station had four types of communication channels: broadcast, control,
data, and co-op. The broadcast channel was used to reach all the UAVs at once with one
message from the ground station. The control channel provided an individual link
between a UAV and the base station; it was used to upload mission related information
and tasks to the UAV over the air. Communications between two UAVs were opened
through the co-op channel. Control among the multi-agents was hierarchical. Agents
were assigned as team leaders, copter, or sensors. Team leaders controlled groups of sub
agents and assigned tasks. Copter agents acted as data relays between groups of sensor
agents and the team leader. In addition to the prototype, a simulation tool was used to
assess different cooperation strategies and optimize different sensing techniques.
Another successful implementation of multiple UAVs through the use of a ground
station was described by Alex Kushleyev et al. [21]. The ground system used was a
Vicon motion capture system [22], which was capable of tracking each individual UAV.
The control system was developed in MATLAB [23] and all the commands were sent via
custom radio modules. Each UAV contained two independent Zigbee transceivers which
operated at 2.4GHz and 900MHz. Inter process communication was used for non-time
critical data sharing, as it was adjustable to different message passing and used
Transmission Control Protocol/Internet Protocol (TCP/IP) sockets to send data between
processes. The UAVs were split up in certain groups, and each group was controlled by
the ground station, but there was no communication between groups. A novel idea used
11
trajectory but with a time shift. Multiple drones were capable of navigating in various
formations while avoiding collisions. This effort was one of the most successful
implementations of an indoor centralized approach; the only limitation of the project
would be the challenges of applying the vision sensors in an outdoor environment. This is
primarily because the cameras function best with a white background for contrast to
easily identify the agents. The addition of environmental parameters such as wind could
also drastically affect the stability.
A system to manage and program UAV swarms, called Karma, was developed in
this research. Karma's goal was to create a hive-based system with a central controller
and avoid agent to agent communication [24]. By eliminating the infield communication,
the complexity of both hardware and software of each individual drone was reduced. All
the computations were done at the central computer, called the “hive.” This centralized
version has the advantage of collective intelligence and was be able to better allocate
resources. The hive determined how and where to send the UAVs, based on the mission
objectives. Then, it provided the drones with a specific task, after the drone completed
their objectives it returned to the base to recharge and drop off its data. A major
assumption in this work was that it was always possible to locate the UAVs in a region.
The hive itself had a central storage, called Datastore, which was updated as soon as the
drones returned from a mission. This information allowed the hive to see its progress and
if it could make different decisions to improve. A considerable advantage to the hive
model was its adaptability, especially to loss of a drone. The hive was capable of
understanding the loss of a drone and was able to reprogram and send other drones to that
area. It was able to notice if an area was gathering information at a slower rate and to
send more drones to increase the pace. In order to test the theory, a simulation
environment was created based on Jbullet [25] called Simbeeotic [26] where a mCX2 [27]
radio transmitter was modified to accept radio controller (RC) commands through a
universal serial bus (USB) port. The system was still in the early stages and undergoing
12
An agricultural irrigation application underpinned by aerial photos and ground
data loggers utilized a 900MHz Maxstream [28] modem for communications [29]. In
addition, a 20dB antenna was used to provide a range of 3 miles. Synchronization of the
transmitted images versus images logged on the UAV were sometimes problematic. CR
206 data loggers from Campbell Scientific [30] were used as ground communication
modules, they transmitted using a 915 megahertz (MHz) spread spectrum radio modem.
They were able to send information every 15 seconds if another module is detected. The
UAV was able to take pictures and collect data by following the certain predetermined
waypoints. The project’s major limitations included synchronization and lack of a more
robust flight control.
The Collective Cognitive Robots (CoCoRo) system is formed around a floating
marine base station and a terrestrial ground swarming the interest of conducting
coastal/marine monitoring and search [31]. The ground swarm was equipped with
accelerometers, compass, pressure sensors and energy sensors. For local optical
communication infrared data association quadrature amplitude modulation was examined
as it provided a communication rate of 119 kilo bit per second (kbps). In addition
acoustic communications were studied given that acoustic waves travel well under water
[32]. Underwater distance measurements were done considering the absorption properties
of water, which are the frequency/wave-length, salt concentration, pressure and other
parameters. The documented work was in early stages and preparation of a small-scale
experiment was planned.
2.3.2 Centralized Leader-Follower
A centralized leader-follower approach qualifies as a subcase of the centralized
base station architecture. Yun et al. developed a simulation to assess this particular
multi-agent control/communication technique [33]. The approach focused on maintaining a
formation while navigating a pair of UAVs to follow specified trajectories. The leader
would transfer velocity and position measurements to the base station through a
FreeWave wireless modem [34] which had a transmission rate of 115.2 kbps and a 20
13
operating system. An encroachment zone was designed for each UAV to ward off
collisions. UAVS were re-routed outside of one other's protected zones. The lead UAV
would send data such as position and velocity to the ground computer that would perform
the calculations and send it to the follower UAV. The flight simulation proved to be
successful and the tracking error was less than 4 meters.
2.3.3 Centralized Virtual Structure
Unlike leader follower, in a virtual structure, the entire system is considered as a
rigid body. There is no hierarchy in between agents, thus making it more robust then a
leader-follower method. However, this often comes with additional control complexity.
Sadowska et al. developed a virtual structure controller which could designed to offer
stability and formation control [35]. To simplify the complexity of the dynamics,
unicycle mobile robots were used. The simulation was done using two E-puck robots [36]
that were controlled through a wireless Bluetooth connection, which would send the
velocity for each motor. Position measurements were done using a camera and vision
software. The virtual centre moved in a circular motion; one robot was placed ahead and
one behind. The robots were able to reach their desired formations within 15 seconds.
Time to organize was dependent on the specific application.
2.3.4 Decentralized and Virtual Structure
Li and Liu [37] claim that a decentralized approach is more desirable than a
ground station based approach since it eliminates the communication overhead with the
ground station. In this paper the UAVs are considered individual access points and are
part of a self-configuring network. A GumStix computer [38] was programmed and
attached to the onboard auto-pilot to act as the controller. Communications were achieved
through the wireless Ethernet capability of the GumStix computer. The TCP/IP protocol
was used to enable agent to agent communications. Each UAV was equipped with an
autopilot system that tracked velocity, altitude, and heading. Reference trajectory, actual,
and desired positions of the vehicles were used as inputs in the controller; which gave the
new trajectories for each UAV. Flight tests were carried out with two UAVs and
14
mission accuracy. This system eliminated the requirement of a ground controller,
however, it also created a need for each UAV to be equipped with its own onboard
controller. Further research is needed to test the system for more than two agents, as
communications will become more complex.
2.3.5 Decentralized Leader-Follower
The creation of a small and inexpensive Aquatic Unmanned Vehicles (AUVs) that
can operate in a swarm are examined in this paper [39]. Each individual unit consisted of
a Beagle Bone [40] central CPU, along with a camera, triple axis accelerometer, triple
axis gyroscope, and pressure and temperature sensors, along with a motor controller.
Process algorithms were divided into three levels: controlling and sensor level, behaviour
level and task level. The first level requested data from the multiple sensors and adjusted
the motor speed. For external communication with the camera a 256 kbps serial interface
was used. The experimental setup engaged a leader-follower approach, with the follower
scanning and looking for a lead orange marker by way of the camera. At a range around 3
meters it was able to see and follow the leader. Challenges arose with the follower’s
inability to distinguish the leader front and back, which increased collision risk.
In another application of decentralized leader-follower, Varela et al. documented
their efforts to assess pollution emitting sources by using a team of autonomous UAVs
[41]. It focused on fixed-wing UAVs attached with chemical sensors that worked
individually at first then as a team to find the source. All the data was logged on each
individual agent, and was then retrieved upon landing. The coordination approach was
based on three phases of operation, after takeoff the planes began in a spread formation.
This allowed them to separate and cover the largest possible area to facilitate initial
pollutant detection. This was done by increasing the distance between agents while
remaining within a limited fixed radius of take-off origin. After completion of the
discovery phase, the planes moved into a monitoring phase. Once they obtained sufficient
data, they began to share the information with the other planes in the air. When a plane
15
stage; where planes would work together to find the source of the pollution. This was
done by comparing the averaged pollution values on the current plane versus its nearest
neighbours, and based on the values it could change its course to seek larger values. The
efficacy of the system is challenged by the tight response times required to match a
moving formation with a moving target. Further, with multiple agents collectively
seeking new positions based on a dynamic field of pollutant concentrations, the risk for
collision is significant. Effective communication and subsequent collision avoidance
systems will be necessary.
Increasingly, UAVs are being deployed by government agencies and police
organizations to monitor large events and gatherings [42]. A unique and pragmatic
element to the work of Oliveri and Endler was the use of existing cellular infrastructure
for agent to agent communication, which mitigated the need for the creation of an
entirely new communication network for the UAVs. Provided the agents were within cell
tower range, the network infrastructure was relatively robust given the well established
nature of current cellular networks. Each agent was equipped with smart phone
electronics in order to join the network. Having a smart phone could provide some issues
with smaller agents sensitive to payload weight. Requirements of the phone hardware
were GPS, compass, 2G/3G/4G internet connectivity and the ability to run Java. The
flight information that went to the phone would then be translated into pulse width
modulation(PWM)for the flight controller. The translation process was designed to be
quick enough so as not to affect agent flight controls. A communication middleware that
was created called Scalable Data Delivery Layer (SSDL) [43] was used to communicate
from UAV to UAV. The protocol used relied on the SSDL; which acted like a group
communication and management function. Each agent would be in either of two states:
Patrol mode or Swarm mode. Initially they all start in patrol mode and travel around an
area of interest with set parameters. Ground control was capable of choosing one to
become a leader and a number of UAVs to become slaves to it. The slaves would then
form in a circle of a specified radius around the leader. This afforded a wider view of the
area below for the cameras. The current focus of the work is the implementation and
16
The spraying of pesticides by UAVs in an agriculture setting was examined in a
paper by Costa et al. [44]. Feedback was given to the UAVs from on the ground wireless
sensors to determine the areas to be covered. Information such as position and amount of
chemical detected were given. This ensured that the UAVs would only spray designated
areas. The UAV would periodically send broadcast messages to sensors in the field
requesting chemical sensor readings and positions. The route would change if the
readings were not the recommended threshold for that specific chemical. Simulations
were carried out to test the management algorithm. Results were favourable with no
wind and offered still promising results with simulated wind. Tests were also conducted
with hardware to measure the communication time between a UAV and ground sensor
using the Xbee-Pro Series [45] as the communication module. Further work is needed to
explore the hardware and communication implication of using many sensors and multiple
UAVS.
2.4 Common Communication Hardware Used
The communications sector in the rapidly burgeoning field of multi-agent robotics
can be a challenging place, as developers attempt to balance factors like range,
bandwidth, speed, power requirements, payload weight, compatibility, and cost. The
most popular communication hardware is Wi-Fi modules, as they are routinely used in
many processes and can be easily implemented in most systems. Some drawbacks
include the overall size of the system and the required programming of ports to connect
to the system. Wi-Fi technology ranges can be on the order of 100 meters or greater
depending on the antenna used. Weight and cost can vary with each modem type but on
average they are slightly larger and more expensive than Bluetooth or XBEE [45] radios.
Complexity tends to be higher as more programming is required, and power requirements
are significant as there is no sleep cycle. Bluetooth devices are small and lightweight
products that can add 10m-100m of range functionality to a project. They have low
power requirements since they have a sleep cycle to conserve battery power. They can
17
point to point systems with minimal configuration requirements. Small omni-directional
XBEE radios have been also used in many projects as they come in many different
configurations. XBEE radios use the Zigbee protocol a simple low overhead system that
can be used in point to point, point to multi-point, and mesh systems. They can offer
ranges from 90m to a few kilometres depending on the model. They are low-power
systems that have a sleep mode for extended battery life. The modules currently range in
cost from 25-100 dollars. A less popular idea, but which holds some potential is the use
of existing cellular infrastructure. This approach would fare well in urban areas but lack
success in rural settings. Cellular technology can be lightweight (10 grams) and can
provide ranges of over 8km depending on location of towers. Current average module
costs are near 100 USD dollars; and they require roughly 700mA to 1000mA to operate.
The complexity varies depending on the protocol used, options include short message
service (SMS), Global System for Mobile Communications (GSM), General packet radio
system (GPRS), and TCP/IP. For underwater projects acoustic communications are the
best choice as RF signals would be heavily attenuated. Acoustic ranges may vary from 10
m to 1000+ depending, depending on cost. Further, these systems require a special
housing for at depths of 6000m that add to the weight of the system which can be over 1
kg. Power requirements increase with transmission distance and can range from 5.5W to
18W. Complexity varies from model to model, but popular models use wireless Ethernet
and RS-232 [46] communication protocols. Table 3 organizes the above mentioned
information in a table format
TABLE2-3
Popular communication hardware used in drone communications
Technology Range Weight Complexity Cost Power Requirements WI-FI [19,33] MED MED HIGH MED HIGH
ZIGBEE [21] MED-LONG LOW LOW LOW LOW
BLUETOOTH[35]
SHORT-MED LOW MED LOW LOW
CELLULAR[42] LONG LOW HIGH MED MED
ACOUSTIC[31]
18
2.5 Conclusions
In this review paper the most common communication and mission control
strategies for multi-agent drone deployments were examined. In addition, different agent
systems such as air, ground, and water vehicles were described to provide perspective on
the variety of applications currently being explored. A majority of the work in this field
remains in the simulation stage; some are nearing the implementation stage, as the
coordination of drones is a complex problem. Even those efforts that have demonstrated
success with multiple drones, have typically done so in an idealized, controlled
environment and would need significant adjustments for real-world deployment.
Each system was categorized under the two major headings of centralized or
decentralized. When considering centralized versus decentralized in a multi agent system,
the decision is largely based on application. One size does not fit all. An ideal solution
would be a hybrid of both systems, where the agents can act autonomously, still learn
from each other, and concurrently have a central operator for offloading complex
computational tasks as well as monitoring mission critical items like safety. Currently,
time sensitive missions where information needs near-real time monitoring will fare
better in a centralized architecture. While those less time sensitive applications may be
decentralized, with the information downloaded from individual agents and analyzed at a
later time.
The potential applications for coordinated, multi-agent drone deployments appear
nearly boundless. Fortunately, (or regrettably), the choices for communication and
coordination strategies seem to be nearly as unconfined. Developers must make their
choices based on a balance of variables like range, bandwidth, speed, power
requirements, payload weight, compatibility, and cost. The best balance will likely be
19
CHAPTER 3
ANALYSIS OF PER, EB, AND RSSI AS LINK QUALITY METRICS
FOR CONNECTIVITY MANAGMENT
The rapid evolution of Unmanned Vehicles (UVs) has created many new
possibilities for multi-agent sensor networks [47,48,49]. This enablement is largely
attributed to advancements in battery technology and payload capacity in UVs [50]. The
integration of specialized sensors on UV agents increases sampling abilities in three
dimensions [51], which is particularly advantageous in large missions. This becomes
increasingly powerful when multiple agents are used to create sensor arrays that may be
configured for simultaneous measurements of field quantities (temperature, pressure,
wind speed, chemical concentrations, etc.) [52]. Similar arrays of agents can also be used
to deploy signals or substances. Subsequently, segments like the military, agriculture, and
civic security are significantly engaged in this emerging field [53]. Coordination of
multiple unmanned robotic agent deployments is not a trivial pursuit. Many engineering
challenges remain to improve critical facets of multi agent arrays, specifically, formation
control, communication management, and communication strategies [54,55].
In the deployment of multiple agents for data collection missions, communication
management is pivotal for mission integrity and autonomy [56]. Errors in the transfer of
navigational or field sensor information could result in mission failure or a loss of UV
agents depending on the application. A robust communication link is necessary to ensure
the mission will be executed with minimal interruptions and full functionality [57,58].
Reliable multi-agent communication fosters a better ability to react and learn from the
operational environment, and enables agents to adjust as required to achieve mission
objectives.
Previous works in connectivity management have focused around managing
intermediate mobile units between a primary mobile and a Base Station (BS) based on
algebraic connectivity [59,60]. Other studies have worked on increasing the range and
maintaining connectivity outside the BS range by the use of multiple robots to extend the
20
examining multiple agent’s transmission to a BS and checking the bandwidth on the BS,
while also using RSSI for connectivity. Examination of throughput by repeated
transmission of an image versus signal strength is done in [63]. While in that study, the
focus is the optimization of multiple units’ positions; an effective end-to-end link
management algorithm is needed. In order to understand what constitutes as a good
communication link, metrics should be examined and compared for suitability as a Link
Quality (LQ) assessment tool.
This paper aims to examine popular measures of connectivity and compare them
based on Assessment Accuracy (AA) and Time To Process (TTP), which are essential in
multi-agent robotic systems. It is worth noting that AA and TTP are inversely
proportional, as accuracy tends to increase with more data points, but subsequently will
require a longer processing time to make a decision. Henceforth, the best metric will
provide an optimum balance between accuracy and TTP. In this context we define
assessment accuracy as how well the system can correctly assess the current connectivity
state it is in. Accuracy is a critical measure here as a poor assessment could lead to a UV
leaving the connection zone and becoming lost. Time to process is representative of the
total time the system needs to correctly judge the current connectivity state. Smaller times
to process will reduce the time required to correct a deteriorating communication scenario
and improve mission reliability.
The first objective of this paper was to provide a comprehensive study of LQ
metrics, namely Received Signal Strength Indicator (RSSI), Packet Error Rate (PER), and
Error Burstiness (EB) individually and then offer a comparison between each. In this
study, RSSI is the relative received signal strength in a wireless environment, typically
received as an analog value in arbitrary units. PER refers to a ratio, in percent, of the
number of communication link packets not successfully received to the total number of
packets sent. EB, in our application, was characterized by the amount of consecutive lost
packets in a communication link. In this comprehensive study, EB has been shown to
have a shorter TTP than the other metrics while maintaining similar assessment accuracy.
It was found that the use of EB can predict the link quality in a shorter time and
pre-emptively avoid a communication loss. To further examine how EB acts in a UV
21
as a communication link metric is investigated by using an experimental UV
communication link.
The remainder of the paper is organized as follows, Section 3.1 establishes a
background, Section 3.2 details the experiments, Section 3.3 discusses results and
analysis, and Section 3.4 contains concluding remarks.
3.1 Background
The publications summarized in the following subsections do offer insight into each of
RSSI, PER, and EB but do not specifically compare them against each other.
3.1.2 Received Signal Strength Indicator
RSSI has been largely investigated on localization systems in an attempt to correlate
distance to an RSSI value and develop a relationship between its value and the distance.
Authors in [67] and [68] draw the conclusion that RSSI cannot be mapped accurately to a
distance as there is too much variance. Further, RSSI values do not offer decimal
accuracy in packet based communication systems, which constrain the distance
resolution. Additional studies in [69,70,71] have developed correction schemes to
mitigate inaccuracies in distance estimation by using RSSI values. However,
improvements were small, these studies highlighted that the RSSI link based management
systems could work in certain applications where accuracy is not the primary goal.
3.1.2 Packet Error Rate
PER as an LQ metric has been used in a number of different applications [72-76],
where it was shown to be reliable to estimate LQ accurately. PER can also capture impact
of interference, multi-path fading, and weather conditions. Furthermore reported in [77],
the PER near the end of the reliable communication link showed time variance, this
section of the communication link was defined as a grey zone because of its
22
3.1.3 Error Burstiness
The examination of EB as a metric of LQ has been performed in [78]. Based on this
work a number of errors were bursty in the grey zone, which means they fluctuate
between good and bad LQ. Thus in [79], an algorithm to measure link EB was developed,
which allowed the system to pause transmission, if the LQ was bad. Using EB as a metric
allowed for the reduction of the average transmission cost by 15%. Wavelet analysis of
RSSI in [36] showed that errors in wireless links are bursty in nature.
3.2 Examination of RSSI, PER, and EB at communication link limits
This section describes experimental studies of PER, RSSI and EB as potential LQ
metrics for multi-agent UV deployments. The metrics were studied by changing the
distance between the mobile agent and BS.
3.2.1 Methodology
For this study, the communication zones were labeled as good, average, and poor.
PER was used in identifying these zones since it is generally believed to be the most
reliable of these three metrics. In the good zone, PER is under 10%, and communication
is very reliable. PER regions between 10% and 40% are considered average (i.e. grey
zone), while anything higher than 40% PER is considered poor. The most important
decision in mobile robotic applications is to identify the transition region from average to
poor. In this region the LQ can change very rapidly and the mobile unit must make a
rapid decision to maintain the communication link. Thus there is a paramount importance
of having an accurate and fast LQ metric. Subsequently this study focused on developing
such an LQ metric that can identify this transition region.
3.2.2 Packet Error Rate
PER was measured on a mobile agent by using received Acknowledgements
(ACKs) from transmitted packets to the BS. To get an accurate PER measurement, the
23
was obtained in the experiments. Loss of ACKs as well as erroneously received ACKs
constitute error packets and were included in the PER calculations. While PER is an
effective LQ estimator, the accuracy of PER depends on observation period, namely
window size. This is illustrated in Figs. 3.1 and 3.2, where Fig. 3.1 shows that a short
window size of 4 packets can drastically alter the PER metric and may not properly
realize LQ changes in fast moving flying robot network. When the window size is large
enough, accuracy of the PER metric increases and stabilizes, and allows it to be useful in
an accurate decision making algorithm. However, this increased window size increases
decision making time, this lag can be problematic when it is required to make fast LQ
assessments. When the mobile agent discovers that the LQ is deteriorating, it may be too
late to reverse course to a better communication region. Fig. 3.2 illustrates how PER
changes with varying window sizes in a grey zone. Two different window sizes were
tried, labeled as W=5 and W=20. In this region, LQ varies drastically because of a greater
likelihood of errors.
(1)
24
Fig. 3.2 A window size of 5 shows a much larger PER then a window size of 20, where W=20 shows a much more stable PER
Based on our early tests, each experiment was run for a window size of 200 packets to
provide a clearer characterization of the metric for this application. Fig. 3.3 provides PER
values vs. distances. As the distance increases between mobile agent and the BS, PER
gets increases and becomes less predictable, which is illustrated with confidence intervals
from five repeated experiments. In our experiments, it was observed that after 27 meters
separation between the mobile and the BS, PER became unreliable.
Fig. 3.3 Packet Error Rate versus Distance
3.2.3 RSSI
Most of the modern radio receivers provide RSSI values for each packet. This can be
retrieved using hardware control application program interfaces. In the experiments, an
average RSSI value was calculated using (2).
25
Fig. 3.4 illustrates RSSI values vs. distance, where increased distance decreases received
signal power. In addition to this, the figure shows the natural instability of RSSI values
due to multi-path fading. This suggests that RSSI may not be the best LQ metric in
packet communication networks. However RSSI can be valuable as a secondary metric to
help confirm estimations made by other LQ metrics.
Fig. 3.4 RSSI versus Distance.
3.2.4 Error Burstiness
EB can be visualized by using Fig. 3.5. The EB metric is calculated by counting
consecutive packet losses, which is done by counting missed ACKs as well as timeouts.
Large consecutive losses indicate an unreliable communication link which makes EB a
good candidate as a viable LQ metric. EB studied in [33] concluded that errors in links
tend to occur in bursts rather than as singular stochastic events.
26
Table I provides the EB counting algorithm used in this study. The counting
process examines the current packet versus the last packet and checks to see if they have
both failed. Continuous failures increase the burst counter, while continuous successes
are not counted. Moving from a lost packet to a success resets the counter and saves the
burst value. Conversely, moving from a successful packet to a lost packet initializes the
burst counter. This algorithm is used to count consecutive errors in a stream of packets.
In order to examine EB, in the experiments, the three largest error burst counts were
stored. This allowed us to examine and identify bursts, and later develop the LQ
management algorithm based on EB.
TABLE3-1
Error burstiness counting algorithm
Last Packet
Current Packet
Outcome
Do nothing
Save last EB counter and reset
Initialize new EB counter
Increase EB counter
Figs. 3.6, 3.7, and 3.8 show that the number of consecutive losses are influenced
by increasing distance. Data was collected on a mobile agent at an initial distance of 24
meters (m) from the BS since distances shorter than 24 m did not have connectivity
issues. Measurements were then taken every meter thereafter until PER reached 50%. A
stream of 200 packets was transmitted at each distance, the mobile agent remained
stationary and the packet stream was recorded. These experiments were then repeated
five times for each distance, averages of these experiments and variations were reported
in Figs. 3.6, 3.7, 3.8. The first three largest error bursts were recorded after receiving 200
packets, this allowed for a better understanding of the EB metric. A large initial EB was
followed by proportionally larger secondary and tertiary bursts. This demonstrates that a
27
PER, the farther the mobile agent moves from the BS the larger the increase in
consecutive errors.
Another observation was that in a grey zone where connectivity issues arise, no
hard-line guarantees can be made for LQ. Predictions for LQ become less accurate and
unstable the farther the mobile agent moves in an unreliable connection. In mobile agent
robotics, it is important to identify LQ issues as fast as possible because the agent can
quickly move into a less reliable link region. Once in such a region, re-connection could
pose an issue.
Fig. 3.6 The highest consecutive loss is graphed against distance.
Fig. 3.7 The second highest consecutive loss is graphed against distance.
28
3.2.5 Error Burstiness in Correlation to Packet Error Rate
Analysis of Fig. 3.3 versus Figs. 3.6, 3.7, 3.8 shows that good correlations exist
between PER and EB metrics. Goodness of fit between EB and PER is determined from
the experiments. Goodness of fit values for PER and EB are 0.967, 0.945, 0.850 for
results presented in Figs. 3.9, 3.10, and 3.11. This close fit between EB and PER can be
exploited in link connection management by using EB as the LQ metric.
Fig. 3.9 Burstiness versus Packet Error Rate R2=.967
Fig. 3.10 Burstiness versus Packet Error Rate R2=.945
29
EB can determine deterioration in the link faster than the PER metric since it can
assess link quality based on a smaller amount of packets. This leads to faster decision
making to mitigate the loss of communication connection between units. Fig. 3.12 is
provided to help illustrate EB’s temporal advantage in LQ decision making. The decision
making time if PER is used is , where is window size, is
transmission time, and is the ACK time as given in (3). However, if EB is used, the time is , where is the maximum consecutive errors, as given in (4). Since , then the decision making time is
reduced significantly.
Fig. 3.12 Visualization of the Decision Making Process
3.3 Error Burstiness Based Connectivity Management
In this section, an EB based LQ metric and connection management algorithm for
mobile robot networks is developed and investigated. In the previous section, we
30
has been shown to be a reliable LQ metric, obtaining a stable PER requires a larger TTP
than EB. Hence it delays the decision making in the connection management algorithm.
Replacing PER with EB will allow a mobile robot network to measure LQ faster. In order
to test and verify the effectiveness of EB metric, an experimental network consisting of a
BS and a mobile robot receiver were constructed using off-the-shelf hardware. In the
experiments, EB and PER metrics were both utilized in the LQ management process.
3.3.1 Design of EB Experiments
Two experiments were developed to test the effectiveness of EB metric for LQ
assessment in an open field. In the first experiment, the vehicle would travel along a
straight line until a preprogrammed EB threshold value was reached, then stop. Three
different thresholds of 5, 7 and 10 consecutive errors were chosen, then the experiment
was repeated 10 times for each threshold. The vehicle’s electronic controller was
triggered to stop the vehicle when the EB count exceeded the predetermined EB
threshold. Once the vehicle stopped, the distance between vehicle and BS was measured.
The algorithm and experimental setup can be seen in Figs. 3.13 and 3.14. The second
experiment was developed to investigate the symmetry of the EB metric to assess its
sensitivity to direction.