R e si s t a n c e t r a i ni n g vol u m e lo a d
wi t h a n d wi t h o u t e x e r ci s e
d i s pl a c e m e n t
H o r n s by, WG, G e n tl e s , JA, C o mf o r t , P, S u c h o m e l, TJ, Miz u g u c hi, S
a n d S t o n e , M H
h t t p :// dx. d oi.o r g / 1 0 . 3 3 9 0 / s p o r t s 6 0 4 0 1 3 7
T i t l e
R e si s t a n c e t r ai ni n g vol u m e lo a d wi t h a n d wi t h o u t e x e r ci s e
d i s pl a c e m e n t
A u t h o r s
H o r n s by, WG, G e n tl e s , JA, C o mf o r t , P, S u c h o m e l, TJ,
Miz u g u c h i, S a n d S t o n e , M H
Typ e
Ar ticl e
U RL
T hi s v e r si o n is a v ail a bl e a t :
h t t p :// u sir. s alfo r d . a c . u k /i d/ e p ri n t/ 4 9 0 0 0 /
P u b l i s h e d D a t e
2 0 1 8
U S IR is a d i gi t al c oll e c ti o n of t h e r e s e a r c h o u t p u t of t h e U n iv e r si ty of S alfo r d .
W h e r e c o p y ri g h t p e r m i t s , f ull t e x t m a t e r i al h el d i n t h e r e p o si t o r y is m a d e
f r e ely a v ail a bl e o nli n e a n d c a n b e r e a d , d o w nl o a d e d a n d c o pi e d fo r n o
n-c o m m e r n-ci al p r iv a t e s t u d y o r r e s e a r n-c h p u r p o s e s . Pl e a s e n-c h e n-c k t h e m a n u s n-c ri p t
fo r a n y f u r t h e r c o p y ri g h t r e s t r i c ti o n s .
sports
Article
Resistance Training Volume Load with and without
Exercise Displacement
W. Guy Hornsby1,* , Jeremy A. Gentles2, Paul Comfort3 , Timothy J. Suchomel4, Satoshi Mizuguchi2and Michael H. Stone2
1 Athletic Coaching Education, College of Physical Activity and Sport Sciences, West Virginia University,
Morgantown, WV 26505, USA
2 Center of Excellence for Sport Science and Coach Education, Department of Sport, Exercise, Recreation and
Kinesiology, East Tennessee State University, Johnson City, TN 37614, USA;
[email protected] (J.A.G.); [email protected] (S.M.); [email protected] (M.H.S.)
3 Directorate of Sport, Exercise and Physiotherapy, University of Salford, Salford,
Greater Manchester M5 4WT, UK; [email protected]
4 Department of Human Movement Sciences, Carroll University, Waukesha, WI 53186, USA;
* Correspondence: [email protected]; Tel.: +1-304-293-0851
Received: 10 September 2018; Accepted: 31 October 2018; Published: 3 November 2018
Abstract: Monitoring the resistance training volume load (VL) (sets× reps× load) is essential to managing resistance training and the recovery–adaptation process. Subjects: Eight trained weightlifters, seven of which were at national level, participated in the study. Methods: VL was measured both with (VLwD) and without (VL) the inclusion of barbell displacement, across twenty weeks of training, in order to allow for comparisons to be made of these VL calculating methods. This consisted of recording the load, repetition count, and barbell displacement for every set executed. Comparisons were made between VL and VLwD for individual blocks of training, select training weeks, and select training days. Results: Strong, statistically significant correlations (r≥ 0.78,
p< 0.001) were observed between VL and VLwD between all training periods analyzed. t-tests revealed statistically significant (p≤0.018) differences between VL and VLwD in four of the seven training periods analyzed. Conclusion: The very strong relationship between VL and VLwD suggest that a coach with time constraints and a large number of athletes can potentially spare the addition of displacement. However, differences in percent change indicate that coaches with ample time should include displacement in VL calculations, in an effort to acquire more precise workload totals.
Keywords:volume load; athlete monitoring; exercise displacement; resistance training
1. Introduction
Appropriate quantification of resistance training volume is believed to be a necessary step in understanding the link between training and the associated adaptations. Detailed resistance training studies report estimates of work from all resistance training sessions, allowing their studies to be reproducible [1–4], and coaches commonly track the volume of their exercise prescriptions. Acute and prolonged physiological responses to stress derived from resistance training can include hormonal alterations [5,6], increased energy expenditure [7], and neuromuscular fatigue [8]. Häkkinen [8] demonstrated that the greater the amount of resistance training work performed during a single training session, the greater the physiological disturbance [8]. Thus, more accurate estimations of work (training volume) could be beneficial in associating training volume with potential fatigue and recovery resulting from the disturbance of homeostasis. Monitoring resistance training volume can be critical for several reasons:
1. It allows coaches to monitor whether or not the pre-planned training volume closely matches the volume actually performed in training;
2. It allows coaches to better achieve targeted volume ranges for specific phases of training that involve a targeted objective (e.g., a strength endurance phase requires a greater training volume than a power phase);
3. It allows superior management of training volume from one phase (e.g., block) of training to the next (e.g., a desired drop in training volume);
4. It allows long term monitoring (e.g., when an athlete returns to a similar block of training, are they performing more work?).
Exercise displacement is calculated by the distance covered for a given movement task, and for free weight barbell exercises, displacement can be assessed as the distance the barbell travels during the concentric (vertical) portion of a resistance exercise for a single repetition. In a review on quantifying workloads in resistance training, Haff [9] explains that the mechanical work performed by an athlete can be quantified by multiplying the athlete’s force times displacement for each repetition. From a study by McBride et al. [10], in which four different volume assessment protocols were compared using force plate assessments, the authors stated that “total work” (TW) (force (N)×displacement (m)) was the “most valid” of the four resistance training quantification protocols examined. This was based upon TW being a direct measure of mechanical work and the other three volume estimations (reps×load, time under tension, and repetitions×(body mass−shank mass + external load)) each having specific limitations, as noted by the investigators [10].
Volume load (VL) (repetitions×load) has been reported in long-term resistance training studies for the past several decades. Haff [9] explains that displacement can be added to VL, the most common resistance training volume calculation, thus resulting in VLwD (repetitions×load×displacement). This may be warranted, because, for a practitioner, measuring the forces generated for every repetition is impractical. In 1987, Stone et al. [11] published a descriptive study on high repetitions (sets of 10) of back squats and an individual’s physiological response. To the authors knowledge this study was the first to include displacement in VL calculations. Over the last several years, Stone and colleagues have begun to use VLwD as an estimate of work in resistance training studies, for example, Bazyler et al. 2017 [4], Bayzler et al. 2018 [12], Caroll et al. [13], and Hornsby et al. [14].
Over the course of a macrocycle, exercises can change based on the overall goals of a specific block of training. Thus, the tracking of training volume from one phase of training to the next is a common consideration for the management of resistance volume. Block periodization models commonly involve a transition across the macrocycle from periods of higher volume to periods of lower volume. Though changes in the number of overall repetitions plays a major role in resultant volume alterations (e.g., decreasing across a macrocycle), so too does the manipulation of training load, as well barbell displacement alterations, via changes in exercises. Exercises commonly change from one phase (block) to the next due to changes in the coaches’ adaption objective(s). For example, during the accumulation block, training may consist of a greater amount of large range of motion exercises, whereas during a realization block, with a taper, a greater amount of partial range of motion exercises may be included in the training program. Exercise intensity (i.e., external load for a given resistance exercise) is commonly factored into volume estimations (e.g., VL), and its impact on an individual’s acute physiological response (e.g., heavier or lighter loads) has been well examined [5].
Sports2018,6, 137 3 of 10
would be, for the coach or strength and conditioning specialist, to include displacement measures along with VL calculations; specifically, is it worth the additional time to collect? If differences exist between VL and VLwD it can be surmised that VLwD is a more accurate estimation of work performed. Thus, the aim of this study was to compare the VL and VLwD during individual blocks of training, select training weeks, and select training days to determine if there are meaningful differences between these methods. For example, if differences exist between VL and VLwD when changing from one specific training period to another, this would suggest that VLwD is worth the additional time. The authors hypothesized that the inclusion of barbell displacement would, for certain periods of training (e.g., when greater changes in volume occur), result in differences in reported workloads performed by the weightlifters. The authors considered it advantageous to observe training in athletes in an ecologically valid environment (i.e., normal training and coaching conditions) over a prolonged period, as this better mirrors real-world training situations.
2. Materials and Methods
2.1. Experimental Approach to the Problem
All of the training data was retrospective information collected, over the course of twenty weeks, by weightlifting coaches and sport scientists of the East Tennessee State University Designated Olympic Training Site as part of an ongoing athlete monitoring program. The training took place in the Exercise and Sport Science Laboratory weight room on the campus of East Tennessee State University. Data collected was approved to be utilized for the purposes of this study by East Tennessee State University’s Institutional Review Board.
Of particular interest was the comparison between various training phases (e.g., training blocks), training weeks (microcycles), and individual training days (intra-microcycles), and specifically for situations in which greater contrasts existed in terms of repetitions and/or training intensity. For example, sets of 10 repetitions compared to sets of five repetitions, or a heavier training day (90%–95%) compared to a lighter training day (70%–75%).
2.1.1. Athletes
[image:4.595.80.517.607.661.2]Data from eight well-trained weightlifters (Table1) were utilized in the study, across five months of training. Of the eight, seven were national level weightlifters (three U.S. National Championship qualifiers, one American Open qualifier, three National Collegiate Championship qualifiers) and one was a regional level weightlifter. Most likely due to the lifters being experienced, little variation existed in displacement within a particular exercise for the same weightlifter (SD < 0.05 m). The variability in body size (height = 174±8.4 cm, body mass = 88.4±22.7 kg) were of important consideration as this heavily influences the exercise displacements.
Table 1.Descriptive weightlifters’ data.
Sex N Height (cm)
Body Mass (kg)
RT Age (years)
WL Age
(years) Snatch (kg)
Clean and Jerk (kg)
Males 5 178±6.9 103.1±13.7 9.8±5.1 5.1±5.0 107.4±27.6 135±32.9 Females 3 166.2±4.6 64.8±2.9 5.3±2.5 3.0±1.4 55.3±6.4 69±8.5
RT = resistance training, WL = weightlifting.
2.1.2. Procedures
emitting towers, interfaced with a computer, detect the ultrasound beam. Through a triangulation method, accurate measurements of displacement and barbell path can be made [14,15].
V-scope methods utilized were based on Stone et al. [15]. Displacement measurements took place before the five months of training began, and the mean was taken from three trials for each exercise for each weightlifter. High intra-class correlations coefficients (ICCs > 0.9) were displayed for displacement during each exercise. Reliability and validity of the V-scope (frequency: 66 Hz) was assessed by moving the V-scope cap by hand, vertically, along a straight edge, across a pre-determined distance (50 cm). The total displacement difference between trials was less than 1 cm (<1%), and high ICCs were obtained (>0.99). Exercises involving two concentric portions involved measuring segments of the full movement and adding the segments together (e.g., clean = clean pull into the catch position + front squat out of the catch).
Mathematically, calculating VL times displacement (VLwD) entailed multiplying the displacement for the given exercise by the number of repetitions and the given load for each repetition (sets×
repetitions×load×displacement).
2.2. Training Prescription
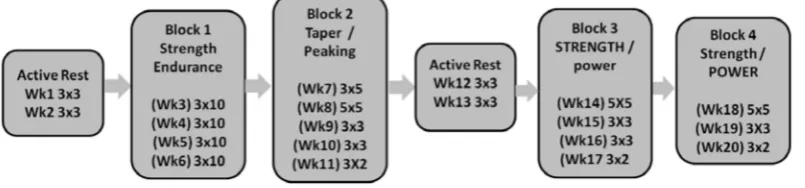
[image:5.595.99.502.446.540.2]The training prescription involved six distinct training blocks (active rest > strength endurance > taper > active rest > STRENGTH/power > strength/POWER) and was based on scientific literature and common training approaches in weightlifting [13,14,16,17]. Variation is a key component of periodized training prescription, which allows a coach to manage and guide training variables toward a specific adaptation goal [13,14]. Figure1displays the set and repetition scheme executed by the weightlifters, and demonstrates that different training blocks involved different set and repetition prescription. Table2displays the relative intensities for the 20 weeks of training. Relative intensities (e.g., percentage of set-rep best) allow for proper fatigue management and, along with the set and repetition scheme and the exercises, dictate the resistance training volume [14,17].
Figure 1.Sets and repetitions with corresponding training foci across the 20 weeks.
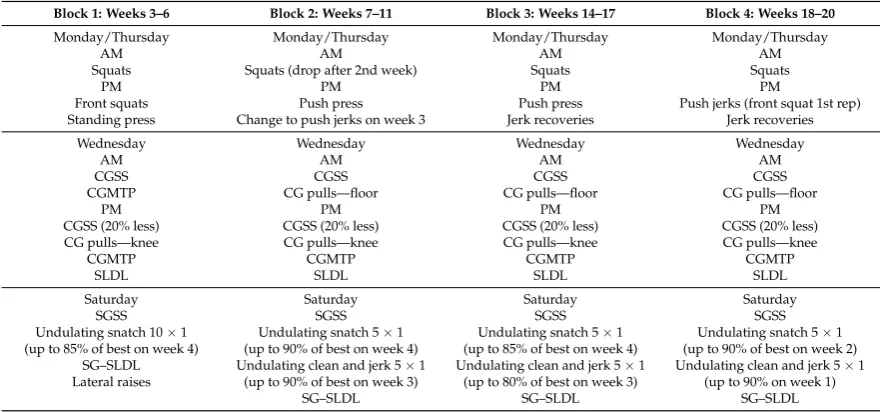
Table3displays all of the exercises the weightlifters performed during the 20 weeks, and Table4
Sports2018,6, 137 5 of 10
Table 2.Percentage of set-rep best across the 20 weeks of training.
Week Monday Wednesday Thursday Friday Saturday
1 60–65% 60–65%
2 60–65% 65–70% 65–70%
3 75–80% 70–75% 80–85% 80–85%
4 80–85% 70–75% 80–85% 85–90%
5 85–90% 70–75% 75–80% 90–95%
6 75–80% 70–75% 75–80% ≥95%
7 75–80% 70–75% 80–85% 80–85%
8 80–85% 75–80% 80–85% 85–90%
9 85–90% 75–80% 75–80% 90–95%
10 90–95% 80–85% 70–75% 90–95%
11 75–80% 70–75% 75–80% ≥95%
12 70–75% 70–75% 75–80%
13 75–80% 70–75% 70–75%
14 75–80% 70–75% 80–85% 80–85%
15 80–85% 75–80% 80–85% 85–90%
16 85–90% 75–80% 75–80% 90–95%
17 90–95% 80–85% 70–75% 90–95%
18 75–80% 75–80% 80–85% 80–85%
19 80–85% 75–80% 80–85% 85–90%
20 85–90% 80–85% 70–75% ≥95%
Note: Tuesdays and Sundays were always rest days.
Table 3.Exercises for each block of training.
Block 1: Weeks 3–6 Block 2: Weeks 7–11 Block 3: Weeks 14–17 Block 4: Weeks 18–20
Monday/Thursday Monday/Thursday Monday/Thursday Monday/Thursday
AM AM AM AM
Squats Squats (drop after 2nd week) Squats Squats
PM PM PM PM
Front squats Push press Push press Push jerks (front squat 1st rep) Standing press Change to push jerks on week 3 Jerk recoveries Jerk recoveries
Wednesday Wednesday Wednesday Wednesday
AM AM AM AM
CGSS CGSS CGSS CGSS
CGMTP CG pulls—floor CG pulls—floor CG pulls—floor
PM PM PM PM
CGSS (20% less) CGSS (20% less) CGSS (20% less) CGSS (20% less) CG pulls—knee CG pulls—knee CG pulls—knee CG pulls—knee
CGMTP CGMTP CGMTP CGMTP
SLDL SLDL SLDL SLDL
Saturday Saturday Saturday Saturday
SGSS SGSS SGSS SGSS
Undulating snatch 10×1 Undulating snatch 5×1 Undulating snatch 5×1 Undulating snatch 5×1 (up to 85% of best on week 4) (up to 90% of best on week 4) (up to 85% of best on week 4) (up to 90% of best on week 2)
SG–SLDL Undulating clean and jerk 5×1 Undulating clean and jerk 5×1 Undulating clean and jerk 5×1 Lateral raises (up to 90% of best on week 3) (up to 80% of best on week 3) (up to 90% on week 1)
SG–SLDL SG–SLDL SG–SLDL
SG: Snatch grip; CG: Clean grip; CGSS: Clean grip shoulder shrugs; CGMTP: Clean grip mid-thigh pull; SLDL: Stiff-legged deadlifts; SGSS: snatch grip shoulder shrugs.
2.3. Statistical Analyses
Statistical analyses involved the comparison of VL and VLwD (SPSS statistical analysis software version 19, Armonk, NY, USA), which was used to determine Pearson correlation coefficients (r =
[image:6.595.77.519.391.597.2]determine the magnitude of any observed differences, and classified as trivial (< 0.20), small (0.20–0.59), moderate (0.60–1.19), large (1.20–1.99). and very large (≥2.0) [19].
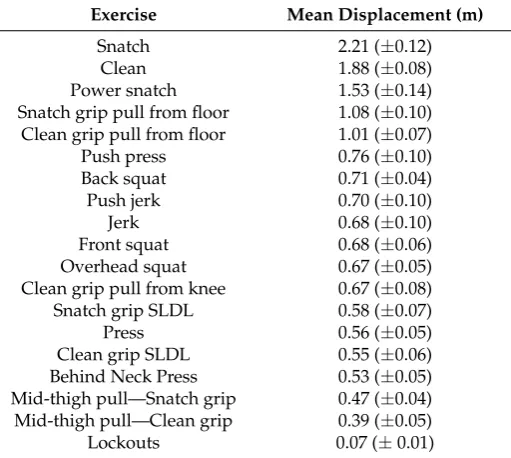
Table 4.The exercises executed during the weightlifters’ 20 weeks of training and the corresponding displacements.
Exercise Mean Displacement (m)
Snatch 2.21 (±0.12)
Clean 1.88 (±0.08)
Power snatch 1.53 (±0.14)
Snatch grip pull from floor 1.08 (±0.10) Clean grip pull from floor 1.01 (±0.07)
Push press 0.76 (±0.10)
Back squat 0.71 (±0.04)
Push jerk 0.70 (±0.10)
Jerk 0.68 (±0.10)
Front squat 0.68 (±0.06)
Overhead squat 0.67 (±0.05)
Clean grip pull from knee 0.67 (±0.08) Snatch grip SLDL 0.58 (±0.07)
Press 0.56 (±0.05)
Clean grip SLDL 0.55 (±0.06) Behind Neck Press 0.53 (±0.05) Mid-thigh pull—Snatch grip 0.47 (±0.04) Mid-thigh pull—Clean grip 0.39 (±0.05)
Lockouts 0.07 (±0.01)
Note: Exercises involving two concentric portions required the full movement segments to be measured, and then the segments were added together (e.g., snatch = snatch pull + overhead squat).
3. Results
3.1. Relationships
Volume load (VL) correlated strongly with VLwD for all training phases, weeks, and days analyzed (Table5). All of the correlations were large and significant (r > 0.78,p< 0.001).
Table 5. Comparison between volume load (VL) and volume load with displacement (VLwD) for various portions of the training prescription.
Description of Training Period Pearson’s r
Active rest one—2 weeks 0.99
Strength endurance—4 weeks 0.98
Taper—5 weeks 0.99
Active rest two—2 weeks 0.94
STRENGTH/power—4 weeks 0.98
strength/POWER—3 weeks 0.99
Week of 3×10 0.96
Week of 3×5 0.93
Training day—3×5, 90%–95% 0.96 Training day—3×5, 70%–75% 0.78
3.2. Percent Change
[image:7.595.182.417.526.657.2]Sports2018,6, 137 7 of 10
Table 6.Comparison between VL and VLwD.
Description of Training Period Change Measurement %∆AVG. pValue Cohen’sd Active rest to strength endurance VL 1303.1 (±495.0) 0.002 0.63
VLwD 1018.0 (±400.1)
Strength endurance to taper VL −38.5 (±5.0) 0.00 2.45 VLwD −27.9 (±3.6)
Taper to active rest VL −91.8 (±2.3) 0.105 0.27 VLwD −91.2 (±2.1)
Active rest to strength/POWER VL 1181.8 (±307.7) 0.003 0.93 VLwD 929.2 (±231.1)
STRENGTH/power to strength/POWER VL −20 (±11.4) 0.613 0.06 VLwD −20.6 (±10.4)
Week of 3×10 to week of 3×5 VL −30.2 (±10.1) 0.018 0.8 VLwD −21.1 (±12.2)
Heavier training day (90%–95%) to lighter
training day (70%–75%) VL −32.9 (±18.3) 0.089 0.77 VLwD −21.5 (±10.3)
3.3. Visual Representation
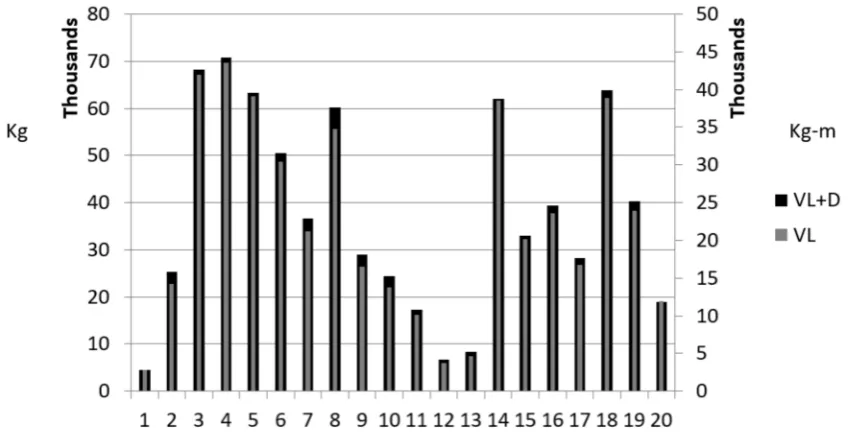
Coaches often “track” resistance training volumes via graphical representations [14,20]. Comparable to the percent change data, Figure2demonstrates that fluctuations for VL and VLwD were similar. Simply put, when VL rose, VLwD rose, and when VL decreased, so too did VLwD. However, the amount of space between VL and VLwD did fluctuate from week to week.
Figure 2.VL and VLwD changes across the 20 Weeks. 4. Discussion
Good fatigue management is paramount. Importantly, the percent changes for four of the seven time periods investigated demonstrated statistically significant differences. These differences were displayed when a comparison was made between high(er) and low(er) volume training blocks, in which there was a large contrast in training volume. Similar results were noted for heavy and light days. Thus, if a coach wants to be assured that changes in training volume are best represented it is worth including displacement (VLwD).
[image:8.595.86.512.374.592.2]A switch from a full movement exercise to a partial movement exercise (e.g., full squat replaced with a quarter squat) is common when a coach implements either a taper or an in-season maintenance program. Heavier loading is typically used with partial movements (but less displacement) and thus, when comparing a quarter squat (see Figure3below) to a full squat, the load for the quarter squat will be much higher for the same relative training intensity. However, when taking into account barbell displacement, the VL is less than when compared to executing the full movement. Table7illustrates this difference. Additionally, based on the data generated from the current study, differences in relative work when switching from block to block can be underestimated using only VL (Table7).
Figure 3.Exercise displacement comparison. (A) Weightlifter executing a full squat; and (B) weightlifter executing a quarter squat.
Table 7.Example: Volume load and training intensity (average load) comparison of the full squat and quarter squat.
Sets and Reps L VL TI D VLwD
Full squat
1×10 60 600 60 0.55 330
1×10 100 1000 100 0.55 550
3×10 130 3900 130 0.55 2145
Total (50 reps) 5500 3025
Mean reps per set (10) 110 110 0.55
Quarter squat L VL TI D VLwD
1×10 60 600 60 0.28 168
1×10 150 1500 100 0.28 420
3×10 200 6000 130 0.28 1680
Total (50 reps) 8100 2268
Mean reps per set (10) 162 162 0.28
Note: In this scenario the VL for quarter squats provide an inflated estimate of work. Thus, if comparisons are being made between the two exercise sessions, VLwD can provide a more accurate estimate of the work performed and the physiological impact. L: Load (kg); VL: Volume load (sets×repetitions×load); TI: Training intensity (VL/reps (kg)); D: Bar displacement (or weight displacement) in meters; VLwD: VL×displacement (kg).
[image:9.595.123.474.454.612.2]Sports2018,6, 137 9 of 10
5. Conclusions
The direct measurement of weight training volume can involve measuring forces, displacement of the external load, and the energy expenditure. Thus, researchers can examine various methods of estimating weight training volume by comparing it to direct measurements. Volume load has been shown to be a reasonable estimate of work when compared to the direct measurements of forces and barbell displacement (i.e., mechanical work) in the back squat; however, is not as accurate as when including exercise displacement (one of the two variables for quantifying mechanical work) [10].
The process of calculating VLwD is certainly more time consuming than for VL; however, sound planning and structure can minimize the burden and provide a rather efficient system. This can include: (1) Measuring exercise displacements before implementing several blocks of training (e.g., the first day of team training for a given year or season); and (2) inserting the displacements for the given exercises into excel, allowing VLwD to be “auto-calculated”, following data imputation (e.g., loads and repetitions). Based on the present study findings and previous research [10], despite the calculation VLwD being more time-consuming compared to VL (i.e., load x repetitions), coaches and sports scientists are recommended to use VLwD to provide estimates of work in a more meaningful fashion.
Author Contributions:W.G.H., data analyses and manuscript preparation; J.A.G., data analyses and manuscript preparation; P.C., manuscript preparation; T.S., manuscript preparation; S.M., collection of data, data analyses, and manuscript preparation; M.H.S., collection of data, data analyses, and manuscript preparation. All Authors have read and approved the final version of the manuscript, and agree with the order of the presentation of the authors.
Funding:This research received no external funding.
Conflicts of Interest:The authors declare no conflicts of interest. References
1. Garcia-Pallares, J.; Sanchez-Medina, L.; Carrasco, L.; Diaz, A.; Izquierdo, M. Endurance and neuromuscular changes in world-class level kayakers during a periodized training cycle.Eur. J. Appl. Physiol.2009,106, 629–638. [CrossRef] [PubMed]
2. Painter, K.B.; Haff, G.G.; Ramsey, M.W.; McBride, J.; Triplett, T.; Sands, W.A.; Lamont, H.S.; Stone, M.E.; Stone, M.H. Strength Gains: Block Vs Dup Weight-Training among Track and Field Athletes.Int. J. Sports Physiol. Perform.2012,7, 161–169. [CrossRef] [PubMed]
3. Hornsby, W.G.; Haff, G.G.; Sands, W.A.; Ramsey, M.W.; Stone, M.H.; Stone, M.E. Strength Characteristics for Isometric and Dynamic Mid-Thigh Pulls in Collegiate Thrower’s across 11 Weeks of Training.Gazzetta Medica Italiana2013,172, 929–740.
4. Bazyler, C.D.; Mizuguchi, S.; Harrison, A.P.; Sato, K.; Kavanaugh, A.A.; DeWeese, B.H.; Stone, M.H. Changes in muscle architecture, explosive ability, and track and field throwing performance throughout a competitive season and after a taper.J. Strength Cond. Res.2017,31, 2785–2793. [CrossRef] [PubMed]
5. Häkkinen, K. Neuromuscular and hormonal adaptations during strength and power training. A. review.
J. Sports Med. Phys. Fit.1989,29, 9–26.
6. Nunes, J.A.; Crewther, B.T.; Ugrinowistch, C.; Tricoli, V.; Viveiros, L.; de Rose, J.; Aoki, M.S. Salivary hormones and immune responses to three resistance exercise schemes in elite female athletes.J. Strength Cond. Res.2011,25, 2322–2327. [CrossRef] [PubMed]
7. Scott, B. Quantifying the immediate recovery energy expenditure of resistance training.J. Strength Cond. Res.
2011,25, 1159–1163. [CrossRef] [PubMed]
8. Häkkinen, K. Neuromuscular Fatigue and Recovery in Male and Female Athletes during Heavy Resistance Exercise.Int. J. Sports Med.1993,14, 53–59. [CrossRef] [PubMed]
9. Haff, G.G. Quantifying Workloads in Resistance Training: A. Brief Review. Prof. Strength Cond.2010,19, 31–40.
11. Stone, M.H.; Pierce, K.; Godsen, R.; Wilson, G.D.; Blessing, D.; Rozenek, R.; Chromiak, J. Heart Rate and Lactate Levels During Weight-Training Exercise in Trained and Untrained Men.Phys. Sportsmed.1987,15, 97–105. [CrossRef] [PubMed]
12. Bayzler, C.D.; Mizuguchi, S.; Sole, C.J.; Suchomel, T.J.; Sato, K.; Kavanaugh, A.A.; Deweese, B.H.; Stone, M.H. Jumping Performance is Preserved but not Muslce Thickness in Collegaite Volleyball Players After a Taper.
J. Strength Cond. Res.2018,32, 1020–1028. [CrossRef] [PubMed]
13. Caroll, K.M.; Bernards, J.R.; Bayzler, C.D.; Taber, C.B.; Stuart, C.A.; Deweese, B.H.; Sato, K.; Stone, M.H. Divergent Performance Outcomes Following Resistance Training Using Repetition Maximums or Relative Intensity.Int. J. Sports Physiol. Perform.2018,29, 1–28. [CrossRef] [PubMed]
14. Hornsby, W.G.; Gentles, J.A.; McDonald, C.J.; Satoshi, M.; Ramsey, M.W.; Stone, M.H. Maximum Strength, Rate of Force Development, Jump Height, and Peak Power Alterations in Weightlifters across Five Months of Training.Sports2017,13, 78. [CrossRef] [PubMed]
15. Stone, M.H.; O’Bryant, H.S.; McCoy, L.; Coglianese, R.; Lehmkuhl, M.; Schilling, B. Power and maximum strength relationships during performance of dynamic and static weighted jumps.J. Strength Cond. Res.
2003,17, 140–147. [PubMed]
16. Stone, M.H.; Pierce, K.C.; Sands, W.A.; Stone, M.E. Weightlifting: Program Design. Natl. Strength Cond. Assoc. J.2006,28, 10–17. [CrossRef]
17. DeWeese, B.H.; Hornsby, W.G.; Stone, M.; Stone, M.H. The training process: Planning for strength–power training in track and field. Part 2: Practical and applied aspects. J. Sport Health Sci. 2015, 4, 318–324. [CrossRef]
18. O’Brien, R.M. A Caution Regarding Rules of Thumb for Variance Inflation Factors.Qual. Quant.2007,41, 673–690. [CrossRef]
19. Hopkins, W.G. A New View of Statistics: A Scale of Magnitude for Effect Statistics. Sportscience. Available online:http://http://www.sportsci.org/resource/stats/effectmag.html(accessed on 14 August 2015). 20. Sands, W.A.; Kavanaugh, A.A.; Murray, S.R.; McNeal, J.; Jemni, M. Modern Techniques and Technologies
Applied to Training and Performance Monitoring.Int. J. Sports Physiol. Perform.2017,12, 63–72. [CrossRef] [PubMed]


![N [4 (N,N Diethylamino)benzylidene] 4 phenyl 5 (1H 1,2,4 triazol 1 yl)thiazol 2 amine](data:image/gif;base64,R0lGODlhAQABAIAAAP///wAAACH5BAEAAAAALAAAAAABAAEAAAICRAEAOw==)