ABSTRACT
MATHERS, CARA ANNE. Evaluating the Effects of Soil Moisture, Texture, and Potential Evaporation on Dry Surface Layer Formation. (Under the Direction of Dr. Joshua Heitman).
Modeling systems at the land-atmosphere interface aim to predict the flux of gases into and out of the soil, in order to make estimates regarding surface energy balance, climate, and air quality. At this interface, gas movement is moderated by the presence of a soil dry surface layer (DSL) which increases resistance to gas flow. While gases diffuse more easily in dry soil than wet soil, the formation of a DSL increases the path length for diffusion from the soil surface to the moist soil below where the gases typically originate (upward flux), or from the atmosphere to the subsoil where atmospheric gases interact with other soil processes (downward flux).
Formation of a DSL will depend on both the physical characteristics of the soil and the water vapor gradient, as influenced by environmental conditions. However, common models for DSL thickness typically rely only upon soil relative wetness for prediction, and are empirical in nature. Testing these models with physical observations is imperative. Two sets of experiments were performed to test soil-condition and boundary effects on DSL formation. In the first
the previous experiments, and the columns were tested at low, moderate, and high PE rates (0.33, 0.65, 1 mm h-1). Despite evaporation rates decreasing quickly, and converging across soil
© Copyright 2019 by Cara Anne Mathers
Evaluating the Effects of Soil Moisture, Texture, and Potential Evaporation on Dry Surface Layer Formation
by
Cara Anne Mathers
A thesis submitted to the Graduate Faculty of North Carolina State University
in partial fulfillment of the requirements for the degree of
Master of Science
Soil Science
Raleigh, North Carolina 2019
APPROVED BY:
__________________________
__________________________
Joshua Heitman Wayne Robarge Chair of Advisory Committee
__________________________
__________________________
ii
DEDICATION
iii BIOGRAPHY
iv
ACKNOWLEDGMENTS
I’d be remiss if I didn’t first thank my adviser, Dr. Josh Heitman. I’m grateful that you extended the opportunity for me to be a part of the BESST REU, and that when I was looking for graduate programs, you generously offered me an assistantship. Thank you for handling my impatience with patience and showing me what it means to be both a good scientist and good person. Thank you to Adam Howard, for all of the help and laughs in the lab. My experiments would not have been possible without your technical assistance and mentorship, and my time taking numerous temperature and mass measurements would not have been as enjoyable. Thank you to Dr. Wayne Robarge for keeping me constantly on my toes. Your comments on this thesis and your editing prowess were invaluable to me. Thank you to my other committee members, Dr. John Walker and Dr. Chadi Sayde, for all of your assistance on this project throughout the past two years.
Thank you to my family, JR and Carla Mathers and Catie Mintz for always supporting my work and lending an ear, even if you didn’t always understand what exactly I was doing. Thank you to my old labmates, Tommy Stephenson and Dr. Wayne Roper III, for allowing me to pester you with questions with impunity, and making the office space a place of community. Thank you to Andrew Whitaker and Maia Fitzstevens, my older soil siblings, for warmly welcoming me to NCSU and always looking out for me with boundless love. Thank you to all of the Crop and Soil graduate students and my friends, especially Josh Henson, Josh Whelan, Erin Viere and Alex Dowcett.
v
vi
TABLE OF CONTENTS
LIST OF TABLES ... vii
LIST OF FIGURES ... viii
Preface...1
Chapter 1:Evaluating the Effect of Soil Moisture and Texture on Dry Surface Layer Formation ...6
Abstract ...6
Introduction ...7
Materials and Methods ...10
Results ...12
Discussion ...14
Energy Balance Model ...16
Concluding Remarks ...20
References ...21
Chapter 2: Influence of Potential Evaporation Rates on Dry Surface Layer Growth ...37
Abstract ...37
Introduction ...38
Methods...40
Experiment Materials ...40
Experiment Procedure ...41
Results and Discussion ...41
Evaporation Model...44
Concluding Remarks ...47
References ...48
Chapter 3: Conclusions and Future Work ...62
Lessons Learned and Future Work ...63
vii
LIST OF TABLES
Table 1.1 Particle size distribution, bulk density (ρb) and saturated hydraulic
conductivity (Ks) of experiment soils ...25
Table 1.2 Maximum observed dry surface layer (DSL) thickness after 24 hours for soils at differing initial water contents, in conjunction with measured
cumulative evaporation, and relative wetness (ratio of initial moisture content to porosity of soil) ...26 Table 1.3 Comparison of measured dry surface layer (DSL) thickness with S&Z
model and evaporation-based model ...27 Table 2.1 Particle size distribution of experiment soils, bulk density (ρb), rates of
saturated hydraulic conductivity (Ksat), and relative wetness ...50
Table 2.2 Evaporation rates during the first two days of all experimental treatments ...51 Table 3.2 Slopes of linear regression lines for cumulative evaporation curves of soil
conditions after day 2 of the experiments ...52 Table 4.2 Cumulative evaporation and final dry surface layer (DSL) thickness of
SCL and CL soils at low, moderate, and high potential evaporation (PE)
viii
LIST OF FIGURES
Figure 1.1 Water retention curve for three soils used in the experiment ...28 Figure 1.2 Average soil column evaporation rates ...29 Figure 1.3 Average cumulative evaporation versus time ...30 Figure 1.4 Water content of three column sections following destructive sampling
at the end of an experiment: the dry surface layer (DSL), immediately below the DSL, and the bottom of the column ...31 Figure 1.5 Growth of the dry surface layer (DSL) over time, as determined using
the three destructive sampling intervals ...32 Figure 1.6 Percent error of Sakaguchi and Zeng model relative to observed dry
surface layer thickness for all soil conditions and sampling intervals ...33 Figure 1.7 Simple linear regression for relative wetness and maximum observed
dry surface layer thickness (DSL) ...34 Figure 1.8 Conceptual model of the evaporation model for dry surface layer
(DSL) thickness ...35 Figure 1.9 Comparison of measured dry surface layer (DSL) thickness from the
last sampling event (24 h) with outputs of the Sakaguchi and Zeng (S&Z) model and the proposed evaporation model ...36
Figure 2.1 Water retention curves for two soils used in the experiment ...54 Figure 2.2 Dimensions of experiment soil column ...55 Figure 2.3 Cumulative evaporation of both soils tested at the low, medium and high
potential evaporation (PE) rates ...56 Figure 2.4 Temperature-depth distribution of CL at high potential evaporation rate
(1 mm h-1) for selected times during the experiment ...57
Figure 2.5 Final water content distributions of CL and SCL, from soil samples taken after destructive sampling at low, moderate, and high potential evaporation (PE) conditions...58 Figure 2.6 Relationship between measured dry surface layer (DSL) thickness and
cumulative evaporation of CL and SCL, including experiment data from Ch.1 ...59 Figure 2.7 Predicted dry surface layer (DSL) thickness using the evaporation model
ix
1 PREFACE
Our Earth is a dynamic, complex web of interconnected systems. Elements cycle through the land, oceans, and atmosphere at various time scales. Abiotic elements interact with biotic actors, and compounds may change their state of matter or undergo chemical evolutions to produce new compounds. General land models, sometimes referred to as Earth system models, aim to explain the movement of chemicals of import. These models, necessarily simplifications of the actual processes, allow us to better understand short-term and long-term natural processes, and ultimately, their impacts to the biosphere.
The land-atmosphere boundary is an interface for the exchange of gases, which may diffuse out of or into soil depending on relative concentrations, as described by Fick’s first law of diffusion (Troeh et al., 1982). The rate of gas movement out of soil is in part mediated by a thin layer at the soil surface known as a dry surface layer (DSL). While a DSL may measure only millimeters in thickness, it has far-reaching implications due to its effect on gas
exchange. Knowledge of DSL characteristics (i.e. thickness, rates of growth, moisture content) will aid in the understanding of the availability of natural resources, help to better manage agricultural systems and inputs, and allow more accurate modeling of climatic conditions.
2
people worldwide could be displaced by water scarcity by 2030 (Hameeteman, 2013).
Therefore, accuratelymodeling the hydrological cycle of potentially water-stressed regions is of major concern.
DSL thickness has been used as a parameter to calculate the resistance of water vapor diffusion in the evaporation component of hydrologic models. Incorrect values for DSL
thickness and soil resistance can lead to gross over or under predictions of evaporation (Tang and Riley, 2013). Agriculture strains freshwater resources; irrigation of crops must maximize water use efficiency, and consider soil moisture and evaporation to do so (FAO, 2012).
Evaporation of soil water also impacts weather patterns and energy balance at the land-atmosphere interface. Soil moisture content at the soil surface can influence precipitation rates (Findell and Eltahir, 1997). If the topsoil is dry, surface air temperature will be raised; in Asia, this enhances monsoon events and leads to more precipitation in the south, and less in the north (Zhang and Zuo, 2011). Soil moisture, or the lack of, has also been held responsible for heat waves, as evapotranspiration and latent cooling is moderated by the presence of a DSL (Fischer and Seneviratne, 2007).
While soil resistance terms have been used specifically to describe water vapor diffusion, the DSL can be implicated in the movement of other gases, such as ammonia and carbon
dioxide. Ammonia is produced through microbial processes as an end product of organic residue decomposition, or is directly applied to agricultural fields as synthetic fertilizer. The amount of annually applied nitrogen has steadily increased, and demand for nitrogen fertilizers globally is increasing (Lu and Tian, 2017). In the atmosphere, ammonia readily reacts with other
3
respiration, and has the largest atmospheric concentration of the greenhouse gases (Blasing, 2016). As the globe continues to warm, carbon dioxide production in the soil will increase as microbial activity heightens (Mikan et al., 2002).
The objective of this thesis is to better understand the dynamics of a DSL under a variety of conditions, in order to increase our knowledge on the physical mechanisms that control DSL growth. The first chapter evaluates the effect of soil texture and initial moisture content on DSL formation in short-term (24 h) column experiments. The second chapter discusses the effect of potential evaporation rate on DSL growth of two soils with different textures in long term (10-14 day) experiments. The final chapter provides a brief synthesis of results and discusses
4 References
Blasing, T. J. (2016). Recent Greenhouse Gas Concentrations. Carbon Dioxide Information Analysis Center, Oak Ridge National Laboratory.
Ercin, A. E., & Hoekstra, A. Y. (2014). Water footprint scenarios for 2050: A global analysis.
Environment International, 64, 71–82.
FAO. (2012). Coping with water scarcity: An action framework for agriculture and food security. 38, 1-78.
Findell, K. L., & Eltahir, E. A. B. (1997). An analysis of the soil moisture-rainfall feedback, based on direct observations from Illinois. Water Resources Research, 33(4), 725–735. Fischer, E. M., Seneviratne, S. I., Vidale, P. L., Lüthi, D., & Schär, C. (2007). Soil Moisture–
Atmosphere Interactions during the 2003 European Summer Heat Wave. Journal of Climate, 20(20), 5081–5099.
Gerten, D., Heinke, J., Hoff, H., Biemans, H., Fader, M., & Waha, K. (2011). Global Water Availability and Requirements for Future Food Production. Journal of Hydrometeorology, 12(5), 885–899.
Hameeteman, E. (2013). Future Water (In)security: Facts, Figures, and Predictions. Global Water Institute, 1–15.
Lu, C., & Tian, H. (2017). Global nitrogen and phosphorus fertilizer use for agriculture
production in the past half century: shifted hot spots and nutrient imbalance. Earth System Science Data, 9(1), 181–192.
Mikan, C. J., Schimel, J. P., & Doyle, A. P. (2002). Temperature controls of microbial
respiration in arctic tundra soils above and below freezing. Soil Biology and Biochemistry,
34(11), 1785–1795.
Renard, J. (2004). Fate of ammonia in the atmosphere-a review for applicability to hazardous releases. Journal of Hazardous Materials, 108(1–2), 29–60.
Tang, J. Y., & Riley, W. J. (2013). A new top boundary condition for modeling surface diffusive exchange of a generic volatile tracer: theoretical analysis and application to soil
evaporation. Hydrology and Earth System Sciences, 17(2), 873–893.
Troeh, F.R., J.D. Jabro, and D. Kirkham. 1982. Gaseous diffusion equations for porous materials.
Geoderma 27(3), 239-253.
5
6
CHAPTER 1. Evaluating the Effect of Soil Moisture and Texture on Dry Surface Layer Formation
Abstract
Gas flux from within the moist soil profile to the atmosphere is in part limited by the formation and eventual thickness of the soil dry surface layer (DSL), a characteristically thin layer of topsoil which is approximately air-dry. Implications of DSL thickness and associated soil resistance to gas flux include modeling the nitrogen and carbon cycle, and quantifying crop water balance. The characteristics of the DSL give insight into the sensitivities of the soil-atmosphere interface, yet research on the physical processes which control DSL formation is lacking. The objective of this study is to better understand DSL formation and evolution by measuring DSL thickness under varying conditions. A series of short column (10-cm length) transient evaporation experiments were carried out in which soil texture (sand, sandy clay loam, clay loam) and initial moisture content were selected as test variables. Soil water evaporation rates were determined by mass loss, and columns were destructively sampled to measure DSL thickness at 1, 3 and 24 h as evaporation progressed under the influence of a heat lamp. The bottom boundary of the DSL was distinguished via color contrast and/or change in consistency from the moist underlying soil. Evaporation rates were dependent on initial soil moisture
7 I. Introduction
Evaporation from bare soil surfaces takes place in three phases, which vary in duration among soil textures and under different evaporative demands (Campbell, 1971). In the initial constant-rate stage of evaporation, meteorological conditions, and therefore the vapor pressure gradient, control evaporativity (Hillel, 1998). Radiation, wind velocity, temperature, and humidity all factor into an environmental potential evaporation rate (Pan and Mahrt, 1987). As evaporation proceeds and water is lost from the soil surface, a water potential gradient forms, and this prompts water movement from deeper soil layers (Monteith, 1981). However, as the soil dries, water conductivity is reduced and transport of water to the surface cannot match the rate at which it is being lost. Eventually, the actual evaporation rate becomes less than the potential rate, as evaporation is now limited by the soil’s ability to deliver moisture toward the surface. This is sometimes referred to as the intermediate stage of soil water loss (Hillel, 1998). The final stage of evaporation is characterized by a slow, steady rate of loss, where evaporation occurs at the bottom boundary of a dry surface layer (DSL) of soil and the underlying moist soil. Continued soil water loss is via the vapor phase, as water vapor diffuses through the DSL to the atmosphere.
8
increasing resistance. The DSL, while typically only millimeters to centimeters thick (Yamanaka et al., 1998; Yamanka and Yonetoni, 1999; Goss and Madliger, 2007), plays an important role in the cycling of gaseous forms of carbon, nitrogen, and water. Therefore, accurately predicting its thickness is vital to modeling efforts for gas exchange between soil and the atmosphere.
The flux of water vapor and other gases from the soil to the atmosphere can be described using the resistance analogy, which includes resistance to diffusive transfer through the soil (van de Griend and Owe, 1994). There have been many empirical functions used to represent the soil resistance term, but it is commonly described as the ratio of a path length to a gas diffusion parameter (Mahfouf and Noihan, 1991). For instance, soil resistance (W m-1 K-1) for water vapor diffusion is defined in Sakaguchi and Zeng (2009) as:
Rsoil = 𝐿𝐿𝐷𝐷 [1]
where L is dry layer thicknessand D is adiffusion coefficient for water vapor.
9
empirical formulation was proposed based on the work of Kondo et al. (1990), assuming that diffusion distance is related to soil relative wetness. They defined L as
𝐿𝐿= 𝑑𝑑𝑙𝑙exp [�1− 𝜃𝜃𝑙𝑙
𝜃𝜃𝑠𝑠𝑠𝑠𝑠𝑠�
𝑤𝑤
]−1
𝑒𝑒−1 [2]
where dl is soil diffusion layer thickness, which defines maximum L; 𝜃𝜃𝑙𝑙
𝜃𝜃𝑠𝑠𝑠𝑠𝑠𝑠 is relative soil
wetness; w is an empirical parameter controlling concavity of the relationship between L and 𝜃𝜃𝑙𝑙
𝜃𝜃𝑠𝑠𝑠𝑠𝑠𝑠; and e is 2.718.
Swenson and Lawrence (2014) found that the soil resistance values from the Sakaguchi and Zeng (2009) equation still led to excess evaporation in comparison with GRACE-TWS (Tapley et al., 2004) and FLUXNET-MTE data (Jung et al., 2009), and critiqued the lack of experimental data to support this resistance term. Swenson and Lawrence instead proposed a new moisture-based DSL parameterization, in which the moisture content threshold at which a DSL initiates depends on the soil’s porosity. While the output had better agreement with GRACE-TWS and FLUXNET-MTE data, their DSL formulation is still not rooted in experimental observations, and is empirically fit to GRACE-TWS data.
10
To-date, most experimental research performed on soil resistance to evaporation and DSL thickness has been confined to sandy soils (Yamanaka and Yonetoni, 1999; Shokri and Or, 2011; Deol et al., 2012; Han and Zhou, 2013). The growth and dynamics of the DSL have seen little study using other soil textures. Further evaluation on a broader range of textures is needed as soil resistance formulations utilizing empirical expressions for L continue to proliferate in other models and publications (e.g., Cooter et al., 2010; Miguez-Macho and Fan, 2012; Cuntz et al., 2016). Checking the soundness of empirical expressions for L over a broad range of soil conditions is critical for the success of such models. This work seeks to better understand the effect of texture and initial water content on the formation of a DSL, and to compare
experimental data with the Sakaguchi and Zeng (2009; hereafter S&Z) model output to evaluate whether it can be supported with physical observations.
II. Materials and Methods
Three soil materials with unique hydraulic properties covering a range of textures were selected to analyze DSL formation: sand, sandy clay loam, and clay loam. Soil was oven-dried, passed through a 2-mm sieve, and homogenized. Particle size analysis was conducted with the hydrometer method and sand sieving method (Gee and Or, 2002). Saturated hydraulic
11
While soil water content, bulk density, and evaporative demand will all influence soil water evaporation for a given soil texture, water content was isolated as the variable of interest in these experiments, with the others being held constant. Moist sand, clay loam, and sandy clay loam were packed at bulk densities of 1.48, 1.20, and 1.25 g cm-3, respectively; these bulk
densities were easily repeatable when packing and were stable under laboratory conditions such that there was limited settling. Sand (S) was tested at initial water contents of 0.03 and 0.05 cm3 cm-3, clay loam (CL) at 0.07 and 0.15 cm3 cm-3, and sandy clay loam (SCL) at 0.10 cm3 cm-3.
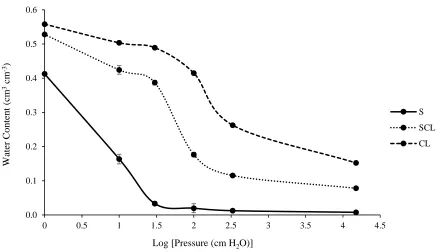
These water contents allowed DSL formation and the ability to observe falling evaporation rates within the span of a day. A distribution of water contents (low and high) enables us to separate the effect of initial water content on DSL formation among textures, and also to examine the S&Z output in comparison to observed DSL thickness. The S and SCL water contents were selected because they are near field capacity, representing soil conditions after drainage (Fig. 1). The CL water contents were chosen as complements to S and SCL, and provide similar relative wetness values which serve as an additional point of comparison (Table 2).
12
was 45℃, and relative humidity remained between 10-15%. Potential evaporation rates were
determined via a simple pan evaporation experiment. A potential evaporation rate of 0.65 mm h-1
was observed under these conditions. This qualifies as the potential evaporation rate for a “temperate summer” (Van Bavel, 1966).
During each experimental run, soil water evaporation rates were determined manually (0.01 g resolution) every 30 minutes for the first three hours, once an hour for the following two hours, and one final time at the end of the experiment (24 h). Two columns were destructively sampled to measure the progression in DSL thickness at one hour, three hours, and at the
experiment’s end. The bottom boundary of the DSL was distinguished via color contrast and/or friability from the moist underlying soil. Water contents of the DSL and moist subsurface layers were determined via oven drying for each destructive sampling interval. In total the experiments included five runs, encompassing five separate soil conditions (i.e., initial water content-texture combinations); from this point forward soil conditions will be referenced by their USDA texture class symbol and corresponding volumetric water content (Table 2, e.g. S 0.03 corresponds to sand at an initial water content of 0.03 cm3 cm-3).
Subsequent analysis of evaporation rates, DSL thickness, and DSL water content, were performed after calculating mean values and the standard deviation from each set of
observations. The sample size was six columns for the DSL water content, two columns for DSL thickness at each sampling time, and ranged from six to two columns for evaporation rates, depending upon the number of columns remaining after destructive sampling.
III. Results
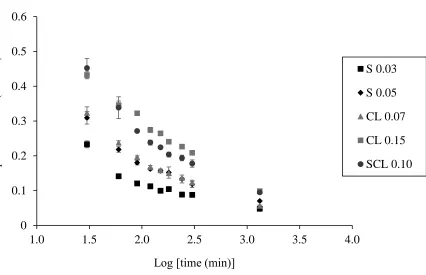
Evaporation versus time curves for each condition exhibit the same general trend,
13
2). Recorded evaporation rates fell between the first measurement at 30 minutes and the second measurement at 1 hour, indicating an almost immediate transition to soil-limited rather than vapor demand-controlled evaporation (i.e. the soils could not meet the potential evaporation rate). Evaporation rates continued to decrease with time, with values approaching or
significantly < 0.1 mm h-1 at the experiment’s end. During the final two hours of the observation period (time >1200 minutes), water loss was <10% of the cumulative total (Fig. 3).
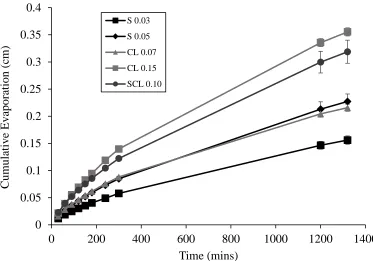
Evaporation rates are partially a function of initial water content; the greater the initial water content, the higher the evaporation rates for the same potential evaporation. This is evident when analyzing evaporation rates of the same soil initially set at different moisture contents, but also when comparing the three textures (Fig. 2). Wetter soils will have greater hydraulic conductivity and more available free water to satisfy evaporative demand. The evaporation rate of S 0.05 is greater than S 0.03, and CL 0.15 is greater than SCL 0.10; in both instances, the soil condition with a larger relative wetness has a higher evaporation rate (Table 2). Cumulative evaporation, from highest to lowest, is as follows: CL 0.15, SCL 0.10, CL 0.07/S 0.05, and S 0.03 (Fig. 3).
14
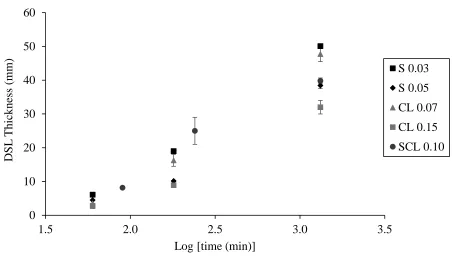
water content, the greater the DSL thickness at comparable cumulative evaporation. S 0.03 and CL 0.07 have a similar DSL thickness at 24 hours; however, more water is needed to evaporate from the CL (higher average evaporation rates: Fig. 2) in order to reach this maximum thickness (Table 2).
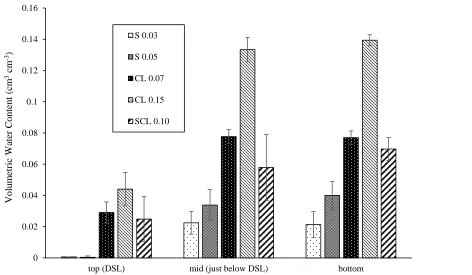
In contrast to the combination of CL 0.07 and S 0.03 having similar DSL thickness, CL 0.07 and S 0.05 both had similar evaporation rates and similar relative wetness (Fig. 2), yet the DSL was thicker in the CL than the S after a near equivalent amount of cumulative evaporation (Fig. 3). The water content of the CL 0.07 DSL, 0.03 cm3cm-3, is much greater than that of the S 0.03, 0.001 cm3cm-3 (Fig. 4). Finer textured soils retain more water at a given pressure than do
coarser textured soils (Fig. 1).
IV. Discussion
The experiments as performed were not replicates of field conditions and instead represent specific, limited conditions. There was a constant heat source with constant
evaporative demand applied to the soil columns for a full 24 hours. Soil was never allowed to rewet. Wind/air circulation was also not a tested factor. However, the main objective was not to use these specific experimental results to predict DSL formation in the field, but to better
understand the impacts of initial water content and texture on DSL growth by simplifying physical conditions.
15
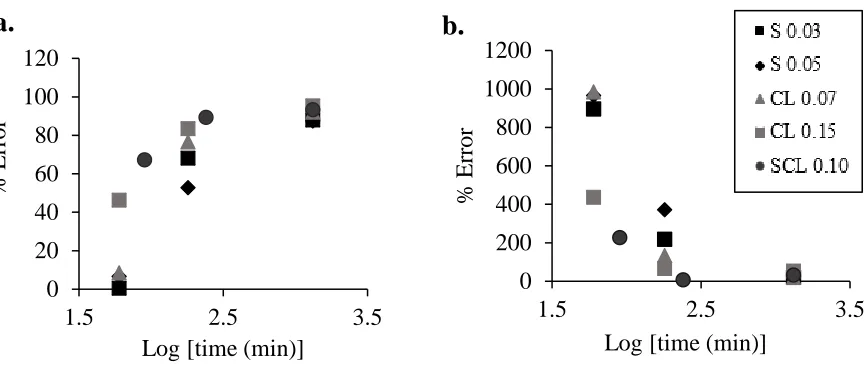
during summer months. As shown in Fig. 5, at the 3 hour sampling point, four of five conditions tested had reached or surpassed a value of 1 cm for the DSL (Fig. 5). Where water is limited, time plays a major role in the thickness of the DSL. As time progresses, the depth of the evaporation front continues to move deeper into the soil profile. Yet, there is no way to account for time in the DSL model represented by Eq. [2]. In Fig. 6, error between observed and S&Z DSL thickness (Eq. [2]) is shown, using two different values of dl: 1 cm to correspond with the CMAQ model, and 10 cm to signify the entire column length. A larger dl will increase the maximum possible DSL thickness, and reduces error for later drying (i.e., 24 hour observations) as in our measurements. However, this still creates a large error for earlier drying (< 3 hours) and does not entirely resolve the issue for longer drying times.
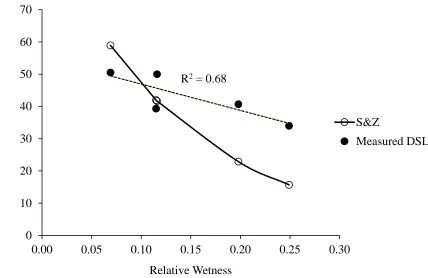
Relative wetness is the only specific determinant of DSL thickness in Eq. [2]. Figure 7 presents a linear regression between maximum observed DSL thickness (at the experiment’s end) and the relative wetness of the soil. There is a positive relationship between cumulative
evaporation and relative wetness of soil, and a negative relationship between maximum DSL thickness and relative wetness while the potential evaporation rate was held constant across experiments (Table 2 and Fig. 7). Bresler et al. (1969) also found that a greater initial soil water content led to more cumulative evaporation. A wet soil is able to better supply evaporative demand, and water easily moves via capillary action to the evaporative front at the soil surface, preventing the downward movement of the evaporative front, i.e., drying. It is wholly
16
0.07 is already substantially dry; CL has a much more negative soil water potential than S, even at the same relative wetness (Fig. 1). The water held in micropores and water strongly sorbed to clay particles in thin films remain unavailable for evaporative loss; therefore, “free” water deeper in the soil profile is needed to supply the demand, and the evaporative front will move
downward. This enables a thicker, yet wetter CL DSL compared to that of S. According to the S&Z model, S 0.05 and CL 0.07 should have an equivalent DSL thickness because they have the same relative wetness. A simple linear regression model for relative wetness and maximum observed DSL thickness has an R2 statistic of 0.68; this indicates that while relative wetness does have a large effect on DSL thickness, it is by no means appropriate to consider by itself as a predictor of DSL thickness (Fig. 7).
Evaporation Model
Liquid water in a soil may vaporize with an input of energy, and vapor moves from the soil to the atmosphere when a potential gradient exists. Evaporative demand, however, will only extract water that is not tightly bound to soil colloids, leaving the hygroscopic or residual water behind. The layer of soil in which only residual water remains is the DSL. We hypothesized that DSL thickness could be predicted using the concept of mass balance together with evaporation rate, and initial and residual water contents as an alternate to empirical models.
17
(E), then we can predict the depth of the evaporative front (L), or the bottom boundary of the DSL with the following simple model; hereafter referred to as the evaporation model:
L
=
E
/ (
θ
i-
θ
r) [3]This model assumes that all water lost to evaporation is sourced from the DSL, and the DSL water content is not gradated, i.e., it has a homogenous water content equal to θr. The greater the difference between the initial water content and residual water content, the thinner will be the DSL, because there is more extractable water. When analyzing uncontrolled conditions, evaporation may be measured, for example, in situ using lysimeters, or predicted with the Penman-Monteith equation which requires several inputs (temperature, relative humidity, wind speed, radiation) to understand surface energy balance (Allen et al., 1998). It is possible to determine residual water content of the DSL via the oven drying method, or by estimating the value using a model available in the literature.
DSL thickness for all five soil conditions at each of the destructive sampling times was computed using the average cumulative evaporation, and we initially evaluated the evaporation model by setting θr to the measured DSL water content. When comparing DSL thickness of
18
below the bottom boundary of the DSL likely drove scatter.
We also tested two additional residual water content models from the literature to
determine whether they would give a reasonable prediction of DSL thickness when coupled with the evaporation model (i.e., when DSL water content is not known from sampling). In the Campbell-Shiowaza-Rossi-Nimmo model (hereafter CSRN model; Campbell and Shiowaza, 1992; Rossi and Nimmo, 1994; Resurreccion et al., 2011), an empirical relationship is established between water content and the logarithm of water potential:
log ( Ψ
Ψ𝑟𝑟𝑟𝑟𝑟𝑟) = (SL)θ𝑟𝑟 [4]
Ψrefcomes from Resureccion et al. (2011) and is set to a value of -104.91 m H2O, and SL is slope
based on a data set from Schneider and Goss (2012)
SL = 1
−0.109∙ [𝑐𝑐𝑙𝑙𝑐𝑐𝑐𝑐𝑐𝑐𝑟𝑟𝑐𝑐𝑐𝑐𝑐𝑐𝑐𝑐𝑐𝑐𝑐𝑐]−0.003 [5]
Water potential for our experimental conditions was calculated using: Ψ = 𝑅𝑅𝑅𝑅
𝑀𝑀𝑤𝑤ln (𝑟𝑟ℎ) [6]
where R is the ideal gas constant 8.3145 J mol-1 K-1, T is temperature (K) , Mw is the molecular
weight of water 18 g mol-1, and rh is relative humidity.
19
The Tuller and Or model of gravimetric residual water content (Tuller and Or, 2005) is described in Resureccion et al. (2011) as:
Θm = ρwSA(� 𝐴𝐴𝑠𝑠𝑠𝑠𝑙𝑙 6ᴨρ𝑤𝑤𝑔𝑔Ψ 3
) [7]
where Θmis gravimetric residual water content, ρw is the density of water (1 kg m-3), SA is
surface area (m2 kg-1), 𝐴𝐴𝑠𝑠𝑠𝑠𝑙𝑙 is the effective Hamaker constant (-6·10-20 J), g is the acceleration due to gravity (9.81 m s-2), and Ψ is soil water potential (estimated using Eq. [6] and converted from J kg-1 to m H
2O).
We estimated SA of textures based on their particle size distribution, and converted Θm to
θr based on the bulk density of the columns. Predicted values for θr of the three textures are all
lower than the measured DSL water content (not shown). However, the fit between the evaporation model and measured DSL thickness is still good when the water content from the Tuller and Or model is input as θr (Table 3).
The proposed evaporation mass balance model, while still simple, is influenced by more parameters than the S&Z model, and is therefore able to more accurately account for DSL dynamics. Residual water content depends on soil texture, thereby adding an embedded soil texture parameterization. Cumulative evaporation is partially a function of potential evaporation rates; the greater the demand for water, the more water loss there will be. Modeling the DSL thickness with the evaporation model therefore allows the DSL to grow over time as cumulative evaporation increases. The S&Z model has no relationship with time, and its single output may correspond well at an early stage of drying but not at a late stage, or vice versa (Fig. 6). While
using DSL water content as θr in the evaporation model provided the best fit because it offers the
20
Concluding Remarks
21 VII. References
Allen, R. G., Pereira, L. S., Raes, D., & Smith, M. (1998). Crop Evapotranspiration (guidelines for computing crop water requirements). FAO Irrigation and Drainage Paper No. 56. Bittelli, M., Ventura, F., Campbell, G. S., Snyder, R. L., Gallegati, F., & Pisa, P. R. (2008).
Coupling of heat, water vapor, and liquid water fluxes to compute evaporation in bare soils.
Journal of Hydrology, 362(3–4), 191–205.
Bresler, E., Kemper, W. D., & Hanks, R. J. (1969). Infiltration, Redistribution, and Subsequent Evaporation of Water from Soil as Affected by Wetting Rate and Hysteresis1. Soil Science Society of America Journal, 33(6), 832.
Budyko, M. (1963). Evaporation Under Natural Conditions. Israel Program for Scientific Translations, 1–130.
Camillo, P. J., & Gurney, R. J. (1986). A resistance parameter for bare-soil evaporation models.
Soil Science, 141(2), 95–105.
Campbell, R.E. 1971. Evaporation from bare soil as affected by texture and temperature. USDA Forest Research Note RM-190, rocky Mountain Forest & Range Exp. Sta. 7 p.
Campbell, G. S., & Shiozawa, S. (1992). Prediction of hydraulic properties of soils using particle-size distribution and bulk density data. In M. T. van G. Al. (Ed.), Proceedings of the International Workshop on Indirect Methods for Estimating Hydraulic Properties of Unsaturated Soils (pp. 317–328).
Choudhury, B. J., & Monteith, J. L. (1988). A four-layer model for the heat budget of homogeneous land surfaces. Quarterly Journal of the Royal Meteorological Society, 114(480), 373–398.
Cooter, E. J., Bash, J. O., Walker, J. T., Jones, M. R., & Robarge, W. (2010). Estimation of NH3 bi-directional flux from managed agricultural soils. Atmospheric Environment, 44(17), 2107–2115.
Cuntz, M., Mai, J., Samaniego, L., Clark, M., Wulfmeyer, V., Branch, O., … Thober, S. (2016). The impact of standard and hard-coded parameters on the hydrologic fluxes in the Noah-MP land surface model. Journal of Geophysical Research: Atmospheres, 121(18), 10,676-10,700.
Dane, J. H., and C. G. Topp. 2002. 3.4.1 Introduction. In: Methods of Soil Analysis: Part 4 Physical Methods, SSSA Book Ser. 5.4. SSSA, Madison, WI. p. 797-801.
22
Gee, G. W., D. Or. 2002. 2.4 Particle-Size Analysis. In: J. H. Dane, C. G. Topp, editors, Methods of Soil Analysis: Part 4 Physical Methods, SSSA Book Ser. 5.4. SSSA, Madison, WI. p. 255-293.
Goss, K.-U., & Madliger, M. (2007). Estimation of water transport based on in situ measurements of relative humidity and temperature in a dry Tanzanian soil. Water Resources Research, 43(5): W05433.
Han, J., & Zhou, Z. (2013). Dynamics of Soil Water Evaporation during Soil Drying: Laboratory Experiment and Numerical Analysis. The Scientific World Journal, 2013, 1–10.
Hillel, D. (1998) Environmental Soil Physics: Fundamentals, Applications, and Environmental Considerations. Academic Press, Waltham.
Jaynes, D. B., & Rogowski, A. S. (1983). Applicability of Fick’s Law to Gas Diffusion1. Soil Science Society of America Journal, 47(3), 425.
Jung, M., Reichstein, M., and Bondeau, A. (2009) Towards global empirical upscaling of FLUXNET eddy covariance observations: validation of a model tree ensemble approach using a biosphere model, Biogeosciences, 6, 2001-2013.
Kobayashi, T., He, W. J., & Nagai, H. (1998). Mechanisms of evaporation from soil with a dry surface. Hydrological Processes, 12(13–14), 2185–2191.
Kondo, J., Saigusa, N., & Sato, T. (1990). A Parameterization of Evaporation from Bare Soil Surfaces. Journal of Applied Meteorology, 29(5), 385–389.
Mahfouf, J. F., & Noilhan, J. (1991). Comparative Study of Various Formulations of
Evaporations from Bare Soil Using In Situ Data. Journal of Applied Meteorology, 30(9), 1354–1365.
Miguez-Macho, G., & Fan, Y. (2012). The role of groundwater in the Amazon water cycle: 2. Influence on seasonal soil moisture and evapotranspiration. Journal of Geophysical Research: Atmospheres, 117(D15).
Moldrup, P., Olesen, T., Yamaguchi, T., Schjønning, P., & Rolston, D. E. (1999). Modeling diffusion and reaction in soils: IX. The Buckingham-Burdine-Campbell equation for gas diffusivity in undisturbed soil. Soil Science, 164(8), 542–551.
Monteith, J. L. (1981). Evaporation and surface temperature. Quarterly Journal of the Royal Meteorological Society, 107(451), 1–27.
23
Oleson, K. W., Niu, G.-Y., Yang, Z.-L., Lawrence, D. M., Thornton, P. E., Lawrence, P. J., … Qian, T. (2008). Improvements to the Community Land Model and their impact on the hydrological cycle. Journal of Geophysical Research: Biogeosciences, 113(G1). Pan, H.-L., & Mahrt, L. (1987). Interaction between soil hydrology and boundary-layer
development. Boundary-Layer Meteorology, 38(1–2), 185–202.
Resurreccion, A. C., Moldrup, P., Tuller, M., Ferré, T. P. A., Kawamoto, K., Komatsu, T., & de Jonge, L. W. (2011). Relationship between specific surface area and the dry end of the water retention curve for soils with varying clay and organic carbon contents. Water Resources Research, 47(6): W06522.
Reynolds, W.D., D. E. Elrick, E. G. Youngs, H. W. G. Booltink, J. Bouma 2002. 3.4.2
Laboratory Methods. In: J. H. Dane, C. G. Topp, editors, Methods of Soil Analysis: Part 4 Physical Methods, SSSA Book Ser. 5.4. SSSA, Madison, WI. p. 802-817.
Rossi, C., & Nimmo, J. R. (1994). Modeling of soil water retention from saturation to oven dryness. Water Resources Research, 30(3), 701–708.
Sakaguchi, K., & Zeng, X. (2009). Effects of soil wetness, plant litter, and under-canopy atmospheric stability on ground evaporation in the Community Land Model (CLM3.5).
Journal of Geophysical Research: Atmospheres, 114(D1).
Schneider, M., & Goss, K.-U. (2012). Prediction of the water sorption isotherm in air dry soils.
Geoderma, 170, 64–69.
Shokri, N., & Or, D. (2011). What determines drying rates at the onset of diffusion controlled stage-2 evaporation from porous media? Water Resources Research, 47(9): W09513. Shu Fen Sun, 1982. Moisture and heat transport in a soil layer forced by atmospheric conditions.
M.Sc. Thesis, University of Connecticut, Storrs, CT.
Smits, K. M., Cihan, A., Sakaki, T., & Illangasekare, T. H. (2011). Evaporation from soils under thermal boundary conditions: Experimental and modeling investigation to compare
equilibrium- and nonequilibrium-based approaches. Water Resources Research, 47(5): W05540.
Song, W.-K., Cui, Y.-J., & Ye, W.-M. (2018). Modelling of water evaporation from bare sand.
Engineering Geology, 233, 281–289.
Swenson, S. C., & Lawrence, D. M. (2014). Assessing a dry surface layer-based soil resistance parameterization for the Community Land Model using GRACE and FLUXNET-MTE data.
24
Tapley, B. D., Bettadpur, S., Watkins, M., & Reigber, C. (2004). The gravity recovery and climate experiment: Mission overview and early results. Geophysical Research Letters, 31(9)
Tuller, M., & Or, D. (2005). Water films and scaling of soil characteristic curves at low water contents. Water Resources Research, 41(9): W09403.
Van Bavel, C. H. M. (1966). Potential evaporation: The combination concept and its experimental verification. Water Resources Research, 2(3), 455–467.
van de Griend, A. A., & Owe, M. (1994). Bare soil surface resistance to evaporation by vapor diffusion under semiarid conditions. Water Resources Research, 30(2), 181–188.
Yamanaka, T., & Yonetani, T. (1999). Dynamics of the evaporation zone in dry sandy soils.
Journal of Hydrology, 217(1–2), 135–148.
25 VIII. Tables and Figures
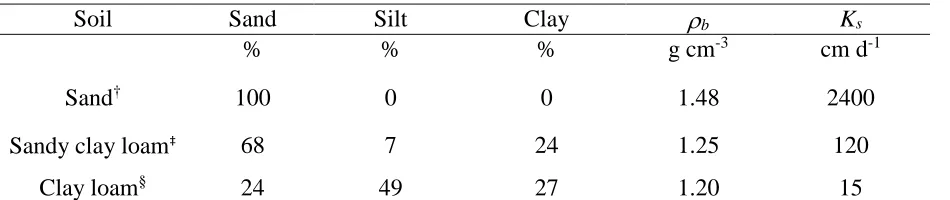
Table 1. Particle size distribution, bulk density (ρb) and saturated hydraulic conductivity (Ks) of experiment soils.
Soil Sand Silt Clay ρb Ks
% % % g cm-3 cm d-1
Sand† 100 0 0 1.48 2400
Sandy clay loam‡ 68 7 24 1.25 120
Clay loam§ 24 49 27 1.20 15
†
Sand is a washed play sand, purchased from a hardware store. 5.23% of particles within range of 1-2 mm, 28.77% within range of 0.5-1 mm, 53.77% within range of 0.25-0.5 mm, and 12.23% of particles < 0.25 mm.
‡ Greenville soil series from Georgia. Greenville classifies as fine, kaolinitic, thermic Rhodic Kandiudults. Provided by David Mann at the BASF Holly Springs Research Farm.
§ Drummer soil series from Indiana. Drummer classifies as fine-silty, mixed, superactive, mesic Typic Endoaquolls. Provided by David Mann at the BASF Holly Springs
26
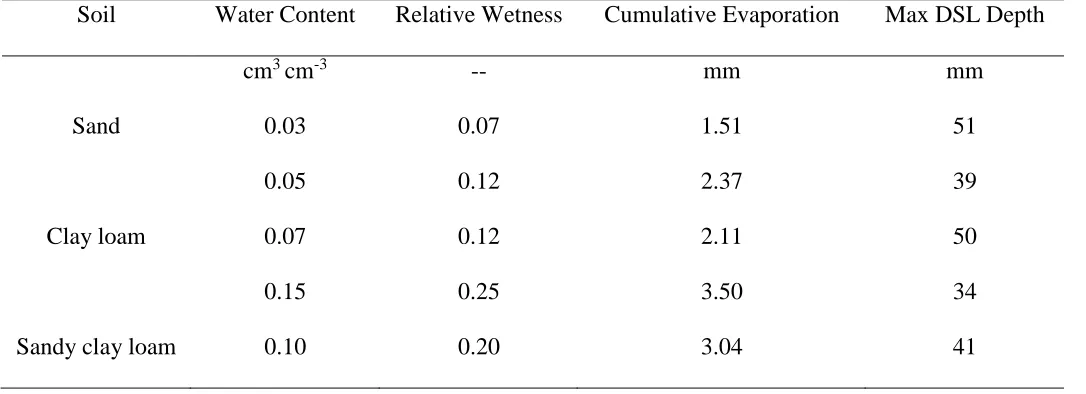
Table 2. Maximum observed dry surface layer (DSL) thickness after 24 hours for soils at differing initial water contents, in conjunction with measured cumulative evaporation, and relative wetness (ratio of initial moisture content to porosity of soil).
Soil Water Content Relative Wetness Cumulative Evaporation Max DSL Depth
cm3 cm-3 -- mm mm
Sand 0.03 0.07 1.51 51
0.05 0.12 2.37 39
Clay loam 0.07 0.12 2.11 50
0.15 0.25 3.50 34
27
Table 3. Comparison of measured dry surface layer (DSL) thickness with the Sakaguchi and Zeng (S&Z) model and the evaporation mass balance model using the oven-dry water content of experiment DSLs, Campbell-Shiowaza-Rossi-Nimmo (CSRN) model, and Tuller and Or model to calculate residual water content; root mean square error, R2 statistic from simple linear regression, and p value from ANOVA are provided (n = 15).
S&Z Model
Evaporation Mass Balance Model DSL Water
Content CSRN Tuller and Or
RMSE (mm) 28.9 4.8 5.8 6.7
R2 0.018 0.93 0.89 0.87
28
Figure 1. Water retention curve for three soils used in the experiment designated in the legend with official USDA soil texture acronyms. Water retention from 0-100 cm was tested using an Eijkelkamp Sandbox, and 333-15000 cm with a high pressure chamber. Error bars signify one standard deviation, and lines have been added to aid visual interpretation of trends.
0.0 0.1 0.2 0.3 0.4 0.5 0.6
0 0.5 1 1.5 2 2.5 3 3.5 4 4.5
W
at
er
C
o
n
ten
t
(cm
3cm -3)
Log [Pressure (cm H2O)]
S
SCL
29
Figure 2. Average evaporation rates calculated for the soil columns as a function of time. Error bars signify one standard deviation. Legend indicates the texture-initial moisture combination for each experiment trial.
0 0.1 0.2 0.3 0.4 0.5 0.6
1.0 1.5 2.0 2.5 3.0 3.5 4.0
Eva
por
ati
on
Ra
te (
m
m
h
-1)
Log [time (min)]
30
Figure 3. Average cumulative evaporation versus time. Error bars signify one standard deviation. Legend indicates the texture-initial moisture combination for each experiment trial. Solid lines added to help visualize trends in the data.
0 0.05 0.1 0.15 0.2 0.25 0.3 0.35 0.4
0 200 400 600 800 1000 1200 1400
C
um
ul
at
ive
E
va
por
at
ion (
cm
)
Time (mins)
S 0.03
S 0.05
CL 0.07
CL 0.15
31
Figure 4. Water content of three column sections following destructive sampling at the end of an experiment: the dry surface layer (DSL), immediately below the DSL, and the bottom of the column. Legend indicates the texture-initial moisture combination for each experiment trial. Error bars signify one standard deviation.
0 0.02 0.04 0.06 0.08 0.1 0.12 0.14 0.16
top (DSL) mid (just below DSL) bottom
32
Figure 5. Growth of the dry surface layer (DSL) over time, as determined using the three destructive sampling intervals. Legend indicates the texture-initial moisture combination for each experiment trial. Error bars signify one standard deviation.
0 10 20 30 40 50 60
1.5 2.0 2.5 3.0 3.5
D
S
L
T
hi
ckne
ss
(
m
m
)
Log [time (min)]
33
Figure 6. Percent error of Sakaguchi and Zeng model relative to observed dry surface layer thickness for all soil conditions and sampling intervals. In panel a, dlin the S&Z model is set to 0.01 m, while panel b has dlset to 0.1 m. Legend indicates the texture-initial moisture
combination for each experiment trial. 0
20 40 60 80 100 120
1.5 2.5 3.5
% E
rro
r
Log [time (min)]
a.
0 200 400 600 800 1000 1200
1.5 2.5 3.5
% E
rro
r
34
Figure 7. Simple linear regression for relative wetness and maximum observed dry surface layer thickness (DSL). The regression model is contrasted with the Sakaguchi and Zeng (S &Z) output at corresponding relative wetness with dlset at 0.1 m.
0 10 20 30 40 50 60 70
0.00 0.05 0.10 0.15 0.20 0.25 0.30
M
ax
D
S
L
T
h
ick
n
es
s
(m
m
)
Relative Wetness
S&Z
35
Figure 8. Conceptual model of the evaporation model for dry surface layer (DSL) thickness. Water content at different soil depths after a drying event is shown; the
DSL water content is the texture’s residual water content (θr), and there is a fixed,
36
Figure 9. Comparison of measured dry surface layer (DSL) thickness from the last sampling event (24 h) with outputs of the
Sakaguchi and Zeng (S&Z) model and the proposed evaporation model. Note, the solid line is y = x to show visual agreement of the values. 0 1 2 3 4 5 6 7
0 1 2 3 4 5 6
P red ict ed D S L T h ick n es s ( cm )
Observed DSL Thickness (cm)
y = x
S&Z Model
Evaporation Model
Linear (S&Z Model)
Linear (Evaporation Model)
R2= 0.93
RMSE = 0.93 cm
p< 0.001
R2= 0.018
RMSE = 2.89 cm
37
CHAPTER 2: Influence of Potential Evaporation Rates on Dry Surface Layer Growth
Abstract
Evaporation from a bare soil surface occurs in three separate phases. In the first stage, evaporative demand, influenced by environmental conditions, controls evaporation rates. Stage 2 occurs when the soil fails to supply sufficient water to equal evaporative demand. Eventually, evaporation will be soil-limited, and evaporation rates drop to a low, constant value during stage 3. Dry surface layer (DSL) formation occurs during the transition of vapor gradient-controlled evaporation to soil limited evaporation, and its downward growth subsequently further slows evaporation. Potential evaporation (PE) influences the duration of stage 1, and may ultimately affect the thickness of a DSL. The objective of this study is to better understand how PE and soil texture moderate DSL formation and thickness. Column experiments testing PE at three rates (0.3, 0.65, 1 mm h-1) controlled by a heat lamp and two soil textures (SCL = sandy clay loam,
CL = clay loam) were performed in a constant temperature room from 10-14 days. The CL had an initial water content of 0.15 cm3 cm-3 (bulk density = 1.20 g cm-3) and the SCLset to 0.10 cm3 cm-3 (bulk density = 1.25 g cm-3). Columns were weighed continuously to determine
38 I. Introduction
Potential evaporation (PE) is the maximum possible evaporation from a soil surface, and this value is influenced by environmental conditions such as radiation input, temperature, relative humidity, and wind speed. Low levels of radiation, low temperatures, high relative humidity, and low wind speeds will decrease PE while the converse increases PE. Actual evaporation (AE) from soil is a function of PE and changes throughout the three classical evaporation stages. In the first stage of evaporation, AE matches PE (Tran et al., 2016). In the second stage of evaporation, AE begins to fall, and the ratio of AE to PE decreases (Salvucci, 1997). In the third, constant rate stage of evaporation, the ratio reaches a low, steady value (Fredlund and Zhang, 2011).
DSL formation initiates when the soil is unable to supply water at a fast enough rate to satisfy the evaporative demand (stage 2 of evaporation), and the evaporative front must
subsequently move downwards into the soil. Differing PE rates should therefore affect the time when the soil hydraulic disconnect occurs. Little research has focused on the specific effects of PE on DSL formation and growth despite the apparent relationship. Field-based DSL
experiments, such as by Yamanaka and Yonetoni (1999), have examined conditions where PE varies over time, but have not explicitly compared DSL formation under different levels of PE. Laboratory column experiments (e.g., Yanful and Choo, 1997; Smits et al., 2011) have
39
In Chapter 1, a series of short (10 cm) columns were tested under constant evaporative conditions for a period of 24 hours to determine the effect of initial water content-texture combinations on DSL formation. While the experiments confirmed that initial water content does play an important role in DSL thickness, initial water content as a single parameter in models is not sufficient to accurately predict DSL thickness over a range of conditions. A simple evaporation model was proposed (Eqn. 3, Chap. 1), in which DSL formation was described as a function of initial water content, a texture-dependent residual water content, and cumulative evaporation. This model, which accounted for both time and texture, predicted DSL thickness reasonably well for the experimental system.
The set of experiments described in this chapter seek to expand upon the results presented in Chapter 1. Texture and initial water content were similar to the conditions of Chapter 1, but longer soil columns (34 cm) utilized herein allowed for longer-duration drying experiments where PE conditions could be manipulated and compared. Longer columns allow the soil to reach steady state conditions (late-phase evaporation and DSL growth) without complete soil drying, in order to complement early-phase evaporation and DSL growth observations from Chapter 1. These new experiments contribute additional data to test the simple evaporation model. Evaporative demand, as expressed by PE, will drive DSL formation. In these
40 II. Methods
Experiment Materials
The clay loam (CL) and sandy clay loam (SCL) soils from Chapter 1 were selected to analyze DSL formation in situ over an extended period of time, especially after stage 3 of evaporation was reached. Soil was oven-dried for 24 hours at 105 ºC, passed through a 2-mm sieve, and homogenized. Particle size analysis was conducted with the hydrometer method and sand sieving method (Gee and Or, 2002). Saturated hydraulic conductivity was measured with a constant head method following Reynolds et al. (2002), and water retention was performed at low pressures of 0, 1, 3, 10 kPa on a sandbox (Eijkelkamp, Giesbeek The Netherlands), and in high pressure chambers at 33 and 1500 kPa (Dane and Topp, 2002). Soil physical properties can be found in Table 1; water retention data are presented in Fig. 1.
The CL was pre-wet to an initial water content of 0.15 cm3 cm-3 and SCL to 0.10 cm3 cm -3, and then the soils were packed in columns at bulk densities of 1.2 g cm-3 and 1.25 g cm-3,
41
Experiment Procedure
The experiment employed two soil textures (CL and SCL) and two potential evaporation (PE) rates (0.3 and 1 mm h-1). The SCL was additionally tested at the PE rate used in Chapter 1 (0.65 mm h-1) to serve as a point of comparison between the short and long columns, resulting in
a total of five conditions evaluated. The PE rates will subsequently be referred to as low (0.33 mm h-1), moderate (0.65 mm h-1), and high (1 mm h-1). These PE rates present conditions ranging from a mild, temperate spring to evaporation rates found in the humid tropics (Van Bavel, 1966). PE rates were altered by adjusting both the setting and height of a heat lamp (Hatco GRAH-36 120V, Hatco Corporation Milwaukee WI) positioned above the columns; corresponding PE rates were determined by performing a simple pan evaporation experiment prior to the column
experiments.
All experiments were performed in a constant temperature room, where temperature was set to 22 ºC and the relative humidity was about 50%. A new column was packed and
independently run for each tested condition. Columns were placed on a scale during experiments to measure mass every 30 minutes at 0.01 g resolution. The heat lamp was turned off when the column system appeared to reach a steady state, where change in evaporation rates and soil temperature deviated less than 1% over time (half-hour measuring intervals). The column was then destructively sampled to measure final DSL thickness, and the water content of the DSL and soil at depths of 10 cm, 20 cm, and 30 cm. When there was not a clear color contrast between the moist and dry soil, friability was used to identify the DSL boundary.
III. Results and Discussion
42
creating constant evaporative demand for a period varying between 10 and 14 days. Table 2 lists the measured evaporation rates for all tested conditions at selected time points during the first two days of an experiment. Higher PE rates result in initially higher evaporation rates for both the CL and SCL; at the beginning of the experiment, actual evaporation rate is the lowest under low PE. However, this effect quickly diminishes after day 2 of the experiment, and all
evaporation rates fall to similar, low values irrespective of texture. Here, stage 3 of evaporation has been reached, and it can be reasonably expected that the formation of a DSL caused the downward shift of evaporation rates.
Fig. 3 shows cumulative evaporation for all conditions. We can see that given a higher PE, cumulative evaporation will be greater at the same point in time for the same soil texture. Table 3 presents linear regression slope values for cumulative evaporation curves after day 2. While cumulative evaporation is larger over time for higher PE conditions, this is primarily due to the evaporation surge (i.e., higher evaporation rates) at the experiments’ beginning (Table 2) since cumulative evaporation curves are parallel during most of later portion the observation period (Fig. 3).
Evaporation rate is nearly the same for each soil texture at each PE after day 2 (Table 2). Soil temperature profiles further verify that near steady state conditions were reached in this time period. In the CL high PE, for example, there is little difference between the recorded
43
content over time when evaporation rates are extremely low, and indicates that movement of the evaporation zone (bottom boundary of the DSL) has greatly slowed.
When comparing CL and SCL set at the low PE, both have similar evaporation rates and cumulative evaporation over time (Fig. 3). Differences in texture and relative wetness do not appreciably affect evaporation at this boundary condition (Table 1). However, evaporation dynamics between the two textures diverge when evaporative demand is increased at the high PE condition. At this higher evaporative demand, differences in relative wetness and hydraulic conductivity become more pronounced between the two soil conditions. Actual evaporation will more closely match PE when the soil is to nearer to saturation (Penman, 1948). Therefore the CL, with a higher water content and slightly greater relative wetness than the SCL, has greater cumulative evaporation at the high PE as a result of higher initial evaporation rates (Table 2). Additionally, the unsaturated hydraulic conductivity of the CL is greater than that of the SCL, thereby allowing water within the column to replenish water loss near the soil surface at a faster rate, thus also better allowing for the high initial evaporation rates.
Table 4 summarizes the results of destructive sampling at the experiment’s end. When comparing columns of the same texture, higher PE results in a thicker DSL despite evaporation rates being equal for the majority of the experiment (after day 2). This suggests that early evaporation rates ultimately have an important effect on DSL growth, and that a significant portion of growth occurs during the early stages of drying. It is interesting that the SCL moderate PE produced a thicker DSL than SCL low PE despite having lower cumulative
44
the moderate PE still had a slightly thicker DSL. This again suggests that, in addition to
cumulative evaporation, the initial evaporation rate may be quite important in determining DSL depth.
Fig. 5 presents water content distribution of the columns, and shows moisture levels after destructive sampling at the soil surface, and 10, 20 and 30 cm depths within the column. The SCL water content distribution for each of the three PE conditions indicates some drying at 10 cm soil depth, but water contents from soil sampled at 20 and 30 cm depths are near the intended initial water content of 0.10 cm3 cm-3 (Fig. 5). Water content near the surface of the CL is quite dry, but subsurface water contents at 10 and 20 cm are near the intended initial water content of 0.15 cm3 cm-3. The measured DSL thickness in the SCL either matches or exceeds the CL at each PE, which is consistent with the water content distributions. The soils showing a reduction in water content at 10 cm depth compared to the initial condition, tended to have thicker DSLs than did soils in which water content remained near the initial condition at this same depth. It is important to note, however, that the CL had a slightly larger relative wetness, and columns were run for a shorter amount of time (Table 4). The difference between soil initial water content and residual water content is greater in the CL condition than SCL condition; therefore, the CL would require a greater amount of cumulative evaporation in order for a DSL to both form and grow.
Evaporation Model
Fig. 6 combines short column data from Chapter 1 together with long column data to examine the relationship between cumulative evaporation and DSL thickness of both the CL and SCL. The linear regression models exhibit a positive relationship with a good fit (CL R2 = 0.99;
45
difference likely related to both initial wetness and texture, which would affect the rate and extent of drying. Because of the slope uncertainty coefficients for the conditions create
overlapping confidence intervals (12.36 ± 0.85, 11.21 ± 1.99) for both regression lines, it can be argued that the populations are ultimately not different (Fig. 6).
To further test the relationship between evaporation and DSL thickness, we calculated DSL thickness using the evaporation mass-balance model described in Chapter 1.
L
=
E
/ (
θ
i-
θ
r) [1]where L is DSL length (mm), E is cumulative evaporation (mm), θi is initial soil water content (cm3 cm-3), and θr is water content of the DSL (cm3 cm-3)estimated from destructive sampling.
46
surface while the evaporation zone continues to move downward. When Chapter 1 short column data were added to the comparison of model predicted vs. observed DSL thickness, the overall fit further improved (R2 = 0.95).
Results presented in Figures 6 and 7, generated with a combination of both the short columns (short duration evaporation) and long columns (long duration evaporation), indicate the possibility of using a generalized soil model to predict DSL thickness that is
evaporation-dependent. This model highlights the importance of soil initial water content as previously used in DSL models (Sakaguchi and Zeng, 2009), but also includes physically dependent (θr) and environmentally dependent (E) parameters. We use this general relationship (Eq. [1]) to predict DSL thickness over a range of initial water contents, and for a series of three evaporation totals (Fig. 8). The three values of E are reflective of high, medium, and low demand conditions in Daamen and Simmonds (1996). θr was set to 0.025 cm3 cm-3, similar to values observed for the
47
Concluding Remarks
Destructive sampling revealed that PE does impact DSL growth, due to disparity in evaporation rates during stage 1 and stage 2 of evaporation. Generally, higher PE, and therefore greater evaporation, will lead to a thicker DSL. Water contents measured at the soil surface and 10 cm depth in the SCL suggest that a DSL does not have a homogenous water content, and depending on the evaporative demand, may be gradated by 0.05 cm3 cm-3 or more. Relationships between DSL thickness and cumulative evaporation at early and late-time stages inspired a model to predict DSL thickness using both evaporation and initial water content. Further testing is required to determine if the model can be utilized for additional soil textures and more
48 IV. References
Daamen, C. C., & Simmonds, L. P. (1996). Measurement of Evaporation from Bare Soil and its Estimation Using Surface Resistance. Water Resources Research, 32(5), 1393–1402. Dane, J. H., and C. G. Topp. 2002. 3.4.1 Introduction. In: Methods of Soil Analysis: Part 4
Physical Methods, SSSA Book Ser. 5.4. SSSA, Madison, WI. p. 797-801.
Deol, P., Heitman, J., Amoozegar, A., Ren, T., & Horton, R. (2012). Quantifying nonisothermal subsurface soil water evaporation. Water Resources Research, 48(11): W11503.
Fredlund, M.D., Zhang, J.M., Tran, D., and Fredlund, D.G. 2011. Coupling heat and moisture flow for the computation of actual evaporation. In Proceedings of the Canadian
Geotechnical Conference and Fifth Pan-American Conference, Toronto, Ont., 2–6, October. Paper No. 1058.
Gee, G. W., D. Or. 2002. 2.4 Particle-Size Analysis. In: J. H. Dane, C. G. Topp, editors, Methods of Soil Analysis: Part 4 Physical Methods, SSSA Book Ser. 5.4. SSSA, Madison, WI. p. 255-293.
Han, J., & Zhou, Z. (2013). Dynamics of Soil Water Evaporation during Soil Drying: Laboratory Experiment and Numerical Analysis. The Scientific World Journal, 2013, 1–10.
Penman, H. L. (1948). Natural evaporation from open water, bare soil and grass. Proceedings of the Royal Society of London. Series A, Mathematical and Physical Sciences, 193(1032), 120–145.
Reynolds, W.D., D. E. Elrick, E. G. Youngs, H. W. G. Booltink, J. Bouma 2002. 3.4.2
Laboratory Methods. In: J. H. Dane, C. G. Topp, editors, Methods of Soil Analysis: Part 4 Physical Methods, SSSA Book Ser. 5.4. SSSA, Madison, WI. p. 802-817.
Sakaguchi, K., & Zeng, X. (2009). Effects of soil wetness, plant litter, and under-canopy atmospheric stability on ground evaporation in the Community Land Model (CLM3.5).
Journal of Geophysical Research: Atmospheres, 114(D1).
Salvucci, G. D. (1997). Soil and moisture independent estimation of stage-two evaporation from potential evaporation and albedo or surface temperature. Water Resources Research, 33(1), 111–122.
Smits, K. M., Cihan, A., Sakaki, T., & Illangasekare, T. H. (2011). Evaporation from soils under thermal boundary conditions: Experimental and modeling investigation to compare
49
Tian, Z., Lu, Y., Ren, T., Horton, R., & Heitman, J. L. (2018). Improved thermo-time domain reflectometry method for continuous in-situ determination of soil bulk density. Soil and Tillage Research, 178, 118–129.
Tran, D. T. Q., Fredlund, D. G., & Chan, D. H. (2016). Improvements to the calculation of actual evaporation from bare soil surfaces. Canadian Geotechnical Journal, 53(1), 118–133. Van Bavel, C. H. M. (1966). Potential evaporation: The combination concept and its
experimental verification. Water Resources Research, 2(3), 455–467.
Yamanaka, T., & Yonetani, T. (1999). Dynamics of the evaporation zone in dry sandy soils.
Journal of Hydrology, 217(1–2), 135–148.
50 V. Tables and Figures
Table 1. Particle size distribution of experiment soils, bulk density (ρb), rates of saturated
hydraulic conductivity (Ksat), and relative wetness: the ratio of initial water content to porosity.
Soil Sand Silt Clay ρb Ksat Relative
Wetness
% % % g cm-3 cm d-1 --
SCL† 68 7 24 1.25 120 0.20
CL‡ 24 49 27 1.20 15 0.25
†Greenville soil series from Georgia. Greenville classifies as fine, kaolinitic, thermic Rhodic Kandiudults. Provided by David
Mann at the BASF Holly Springs Research Station.
‡Drummer soil series from Indiana. Drummer classifies as fine-silty, mixed, superactive, mesic Typic Endoaquolls. Provided by
51
Table 2. Evaporation rates during the first two days of both soils at varying potential evaporation (PE) conditions.
Soil PE 0.25 d 0.5 d 1 d 2 d
mm h-1 mm h-1 mm h-1 mm h-1 mm h-1
CL 0.3 0.08 0.05 0.05 0.03
1 0.15 0.08 0.07 0.04
SCL 0.3 0.08 0.04 0.04 0.03
0.65† 0.08 0.06 0.04 0.03
1 0.10 0.11 0.05 0.06
†
Column mass data were missing from the SCL moderate potential evaporation (PE) column for a portion of the experiment, so
52
Table 3. Slopes of linear regression lines for cumulative evaporation curves of soil conditions after day 2 of the experiments.
Texture PE Slope
mm h-1 mm d-1
CL 0.3 0.43
1 0.47
SCL 0.3 0.39
0.65 0.38