Copyright2001 by the Genetics Society of America
Genetic Architecture of Testis and Seminal Vesicle Weights in Mice
Isabelle Le Roy,* Sylvie Tordjman,* Danie`le Migliore-Samour,*
Herve´ Degrelle
†and Pierre L. Roubertoux*
,‡*Ge´ne´tique, Neuroge´ne´tique, Comportement, UPR CNRS, 45071 Orle´ans Cedex, France,†Biochimie Endocrinienne, Centre Universitaire, 75006 Paris, France and‡University of Orle´ans, France
Manuscript received March 28, 2000 Accepted for publication January 24, 2001
ABSTRACT
Comparisons across 13 inbred strains of laboratory mice for reproductive organ (paired seminal vesicles and paired testes) weights indicated a very marked contrast between the C57BL/6By and NZB/BINJ mice. Subsequently these strains were selected to perform a quantitative genetic analysis and full genome scan for seminal vesicle and testis weights. An F2population was generated. The quantitative genetic analyses indicated that each was linked to several genes. Sixty-six short sequences for length polymorphism were used as markers in the wide genome scan strategy. For weight of paired testes, heritability was 82.3% of the total variance and five QTL contributed to 72.8% of the total variance. Three reached a highly significant threshold (⬎4.5) and were mapped on chromosomeX(LOD score 9.11), chromosome4(LOD score 5.96), chromosome10(LOD score 5.81); two QTL were suggested: chromosome13(LOD score 3.10) and chromosome18(LOD score 2.80). Heritability for weight of seminal vesicles was 50.7%. One QTL was mapped on chromosome4(LOD score 9.21) and contributed to 24.2% of the total variance. The distance of this QTL to the centromere encompassed the distance of the QTL linked with testicular weight on chromosome4, suggesting common genetic mechanisms as expected from correlations in the F2. Both testis and seminal vesicle weights were associated with a reduction in the NZB/BINJ when this strain carried the YNPARfrom CBA/H whereas the YNPAR from NZB/BINJ in the CBA/H strain did not
modify reproductive organ weights, indicating that the YNPARinteracts with the non-YNPARgenes. The effects
generated by this chromosomal region were significant but small in size.
R
EPRODUCTIVE organ size (testes and seminal ves- sociations between the fine anatomical structure of re-icles) occupies a place of special importance productive organs and their weight (mice with small among morphological measures because of its direct testes having a high percentage of abnormal tubules implication in fertility. Reproductive organ sizes are and of reduced Sertoli cells;Chubb1992) suggest that markers of the timing of puberty (Argyropoulosand this simple measure might be used as a marker forShire 1989) and testicular weight is connected with complex morphological events. Finally, correlations be-total sperm count in mice (Krzanowska1971; Hunt tween reproductive organ sizes and neurobehavioral and Mittwoch1987; Chubb 1992). A correlated re- measures have been reported. Testis weight is higher sponse to selection also appeared for ovulation rates in in mice with the largest brain asymmetries and low direc-lines of mice selected for testicular weight (Islamet al. tion of laterality assessed from a paw preference test 1976). Weight is also an excellent index of either the (seeCollins1985, for a review). Mice initiating attack biochemical or the anatomical state of reproductive or- behavior against conspecific males or initiating success-gans. The balance and quantity of phosphocreatine and ful mating behavior (McKinneyandDesjardin1973) creatine in the fluid secreted by the epithelial cells of have higher testicular weight.
seminal vesicles varies according to their developmental As reproductive organ weights are the sum of differ-stage (Leeet al. 1991). Small testis size is often associated ent physiological events, elucidating the putative genes with low androgen concentration (McKinneyandDes- implicated in weight should help to dissect the biologi-jardin1973;Carlieret al.1990;Franc¸oiset al.1990) cal bases of these phenotypes and to understand the and reactivity to testosterone (Michard-Vanhee and mechanisms behind the correlations that have been
re-Roubertoux 1990). Testis size may also provide an ported above. Moreover, identifying the genes linked indirect evaluation of the functionality of connected with testis and seminal vesicle weights in mice should systems as it was demonstrated for hypothalamic activi- have the practical outcome of facilitating the discovery ties (Jean-Faucheret al.1983). Previously reported as- of corresponding human genes via the use of
compara-tive maps and subsequently developing animal models for sterility. Although more than 70 genes are known
Corresponding author:Pierre L. Roubertoux, UPR CNRS 9074,
Ge´n-to be at work in cell activities of testes and 12 for seminal
e´tique, Neuroge´ne´tique, Comportement, CNRS, 3 B rue de la
Fe´rolle-rie, 45071 Orle´ans Cedex, France. E-mail: [email protected] vesicles (Mouse Genome Database1999), their
tive involvement in reproductive organ weights remains weights among the set of B ⫻ D recombinant inbred strains, few “minoring” alleles in DBA/2J and few “ma-to be demonstrated.
Very few studies have been performed with seminal joring” alleles in C57BL/6J would have been expected. Considering that Twq1 contributed to 75% of the ge-vesicle weight in mice, notwithstanding its potential
medical interest for modeling prostate cancer. Weight netic variance, little room would remain for other QTL, indicating an incrementation of testis weight associated could be related to the abnormal vesicle shape described
byShukriet al.(1988), who identifiedSvs, one of the with DBA/2J alleles.
For these reasons, we performed a wide genome scan corresponding genes on chromosome7. The
implica-tion of the H-2 complex on chromosome17 has also for paired testis and seminal vesicles weights in an F2 population derived from C57BL/6By (B) and NZB/ been suggested (Gregorovaet al.1977). More attempts
have been made to elucidate genes linked with testicular BINJ (N) strains. These two strains were selected among 13 inbred strains of laboratory mice because they weight. Although four genes are known to contribute
to testis differentiation signaling in mice (tdy,tda1,tda2, showed large differences for both the measures. More-over, B and N appeared suitable for the wide genomic tda3; Mouse Genome Database1999), the genes
un-derlying the variation in testis weight in mice remain scan or QTL mapping because they differed for 92% of the tested simple sequence length polymorphisms unknown. Marked polymorphisms for weight have been
reported in inbred strains of laboratory mice (Shire (SSLPs;Le Royet al.1998). We had derived a quartet of congenic strains for the specific part of theY chromo-and Bartke 1972; Shukri and Shire 1989; Chubb
1992) and several analyses either using recombinant some (YNPAR) from NZB/BINJ (N) and CBA/H (H). This
quartet was used to test for the implication of this region inbred strains (ArgyropoulosandShire1989;Shukri
andShire1989;Chubb1992) or generating segregat- in testis and seminal vesicle weights. ing generations between inbred strains (Hunt and
Mittwoch 1987; Washburn and Eicher 1989) have
MATERIALS AND METHODS confirmed that testis weight follows a polygenic
trans-mission. Unfortunately, the few chromosomal linkages General rearing conditions:All the mice had been main-that were suggested now appear controversial. tained in a pathogen specific free area of our animal facilities under brother⫻sister mating for several generations when Probably due to its major implication in testis
differen-the experiment began. Mice from parental strains, F1and F2 tiation signaling, the specific part of theYchromosome
generations, were raised contemporarily. They were reared was considered as encompassing putative candidates for
under the following general conditions: cages, 42⫻20⫻18 variation in testis weight, one of these candidates being cm; bedding, dust-free sawdust; food, IM UAR and tap water tdy itself. Results from backcross or intercross designs ad libitum; temperature, 23⬚ ⫾ 0.5⬚; photoperiod, 12:12 with lights on at 8 AM; weaning at 29⫾2 days. Pregnant mothers fit with an involvement of the specific part of the Y
were isolated from the mating cages. Litters with fewer than chromosome interacting with non-Ygenes (Huntand
seven pups were discarded and the others culled to seven pups
Mittwoch1987;WashburnandEicher1989) in testis
to prevent possible litter size effect on reproductive organ weight. ThisY-chromosome effect was interpreted as a weights. At weaning, each male was housed with one NMRI possible contribution of tdy. However, a more recent female.
Reproductive organ weights: Male mice were killed after study (Chubb1992) has shown that three strains
dif-cervical dislocation. Testes were removed and excised of ad-fering in testis size did not reveal any polymorphism
hering tissues. To prevent the loss of secretory fluid, the base for theYchromosome checked with aY-specific probe
of each seminal vesicle was grasped with forceps before remov-(pY2). This result, indicating no implication of thetdy ing. Paired seminal vesicle and paired testis weights were re-gene in testis weight, also excluded the contribution of corded to the nearest 0.1 mg.
Comparisons across 13 inbred strains of mice:Reproductive the other genes carried by the Ychromosome in this
organs were weighed in male mice at 90 ⫾ 5 days of age. phenotype. This conclusion might be limited to the
They belonged to strains of mice developed from identified C57BL substrains that were used in Chubb’s article.
breeders and currently used for our experiments on intermale Contrasting with other morphological measures that aggression (Le Roy et al. 1999). We used 13 strains: A/J, have widely used wide genome scan strategies, only one BALB/cJBy, CAST/Ei, C57BL/6By, DBA/2J, and NZB/BINJ purchased from The Jackson Laboratory (Bar Harbor, ME); attempt was made to investigate other regions. With
CBA/H, C57BL/6J, and XLII from CSEAL (Orle´ans, France); recombinant inbred mice derived from C57BL/6J and
BA and CPB-K provided generously by Dr. Hans van Abeelen DBA/2J (B ⫻ D), Zideket al. (1998) found only one
(Nijmegen, The Netherlands); and DBA/1Bg and C57BL/ highly significant quantitative trait locus (QTL) linked 10Bg given by Dr. Stephen C. Maxson (Storrs, CT).
to testis weight that was labeled Twq1, close to the Mean values were compared using a one-way ANOVA proce-dure (SAS Institute1987). Nine male mice per strain were
D13Mit3marker, on chromosome 13.At the D13Mit3
used. locus, the alleles from C57BL/6J were, surprisingly,
Crosses and components of the mean differences:Parental linked with high testicular weight and those from DBA/
NB.NBF2’s and BN.NBF2’s vs. NB.BNF2’s and BN.BNF2’s to TABLE 1 test for an effect of the specific part of theYchromosome
Paired testis and seminal vesicle weights (g, mean⫾SEM) (YNPAR) on the other hand (Carlieret al.1991). This design
from 13 inbred strains of laboratory mice was analyzed with a two-way ANOVA with the origin of the
(90⫾5 days of age) mother and the origin of YNPARas main factors. Sample sizes
are indicated in Table 2.
Components of the mean differences (MatherandJinks Paired seminal
1971) were estimated using seven parameters: [m] (mean), Strains Paired testis weight vesicle weight [d] (additivity), [h] (dominance), [i] (interaction between
A/J 0.132⫾0.070 0.137⫾0.025
homozygous loci), [j] (interaction between homozygous and
CAST/Ei 0.074⫾0.007 0.069⫾0.004 heterozygous loci), [l] (interaction between heterozygous
loci), and [om] (origin of the mother). Heritability in the C57BL/10Bg 0.139⫾0.002 0.290⫾0.060 broad sense was estimated as C57BL/6By (B) 0.191⫾0.007 0.324⫾0.012 C57BL/6J 0.165⫾0.010 0.270⫾0.042 h2L⫽VG/(V
G⫹VE)
BA 0.181⫾0.009 0.190⫾0.023
whereVE⫽1⁄4VN⫹1⁄4VB6⫹1⁄2VF1andVG⫽VF2⫺VE. BALB/cJBy 0.200⫾0.010 0.201⫾0.020 Mapping QTL:QTL linked with paired testis and seminal CBA/H (H) 0.127⫾0.028 0.129⫾0.031 vesicle weights were investigated with a full genome scan in CPBK 0.140⫾0.009 0.230⫾0.030 the F2intercross population derived from N and B mice. We DBA/1Bg 0.171⫾0.005 0.170⫾0.023 used 193 males (17 B, 16 N, 18 NBF1’s, 12 BNF1’s, 34 DBA/2J 0.230⫾0.008 0.229⫾0.067 NB.NBF2’s, 28 NB.BNF2’s, 30 BN.NBF2’s, and 38 BN.BNF2’s) NZB/BINJ (N) 0.287⫾0.015 0.381⫾0.030 maintained under the general conditions described above XLII 0.131⫾0.020 0.170⫾0.030 until they were killed at 150 ⫾ 6 days old. Given that the
correlations between body weight and testis or seminal vesicle weight were not significant in the F2’s (r ⫽ 0.09 and r ⫽
⫺0.03), respectively, the absolute paired testis and seminal theYchromosome (YNPAR) on reproductive organ weights, the
vesicles weights were used for subsequent analyses. Individual paired testis and seminal vesicle weights were measured in a measures were transformed (square root transformation) to quartet of congenic strains for this chromosomal region that ensure homoscedasticity in the nonsegregating generations we had developed from NZB/BINJ (N) and CBA/H (H) (untransformed values were reported in the tables). (Roubertouxet al.1994). Briefly, the N-YNPARwas substituted
DNA scoring:Tails and spleens were collected and stored in the place of the H-YNPARin the H strain to obtain its congenic
at⫺80⬚until DNA extraction. DNA was extracted from tails H.N-YNPARfor this region of theYchromosome and second,
and amplified with the usual procedure (Sambrook et al. the H-YNPARwas substituted in the place of the N-YNPARin the
1989): initial denaturation (94⬚for 3 min and then 94⬚for 30
N strain to obtain its congenic N.H-YNPAR. The congenic
sec during each of the 40 amplification cycles), annealing (1
N.H-YNPARwas developed with N as recipient strain and H as
min 15 sec at 42⬚to 55⬚, according to the primers), extension
donor, the N females being sired by NHF1 males and the (1 min 15 sec at 72⬚), and final extension step of 3 min. We backcross females subsequently sired again with N. The same used a 4% agarose gel (3% NuSieve, 1% Sigma type II agarose) design was used to transfer the YNPARfrom N onto H and to
stained with ethidium bromide for visualization. The three obtain the second congenic H.N-YNPAR.At every generation it
possible genotypes were read with an UVP PMW 20 computer was assumed that the congenic progeny had lost 50% of the system on a screen with 4.5 magnification. The first and last alleles from the congenic donor. Thus, for the measure of authors performed blind and independent genotyping. Dis- reproductive organ weights, few residual allelic forms located cordant observations resulted in a second amplification. throughout the genotype including the YPARof the parental
Full genome scan:Genotyping was performed individually donor strain were expected in the congenic strains at 35 and with the DNA from the F2 male mice. Sixty-six SSLPs were 37 backcross generations for N.H-YNPARand H.N-YNPAR,
respec-selected as genetic markers: 5 (chromosomes 1 and 2), 4 tively. Mean values were compared using a two-way ANOVA (chromosomes4, 5, 17, 19), and 3 on the others (average procedure with the recipient strain (Hvs.N) and the origin interval length 22.5 cM). Significant differences between the of the YNPAR(H-YNPARvs.N-YNPAR) as main sources of variation.
three genotypesN//N,N//B, andB//Bwere assessed with the Kruskal-Wallis test. The chromosomes where these differences reached aP⬍0.05 threshold were selected for QTL mapping.
RESULTS Subsequent likelihood ratios and LOD score computations
were calculated with the interval mapping method using
Map-Measurement of reproductive organ weights in 13
QTL package (van OoijenandMaliepaard1996;
MapQTL-inbred strains:Table 1 presents means⫾SEM for the tm-version 3.0). The expected confidence interval is expressed
as two measures. Strain differences appeared for paired
testis weight (F⫽6.99,P⬍0.0001) and seminal vesicle 530/N·v
weight (F⫽3.84,P⬍ 0.001). (DarvasiandSoller1997), where 530 is a constant obtained
The N and B strains presented a significant (t⫽4.27, from simulations,N is the number of informative meioses,
P⬍0.0001) and marked contrast for testis weight. The andvis the proportion of variance explained by the QTL.
difference for seminal vesicle weight was not the largest We tested for epistatic effects between two QTL using a
two-way ANOVA with the values of the three genotypes at the across the 13 strains even if it remained significant (t⫽ closest SSLPs to the peaks of the QTL and the two QTL as 3.31,P ⬍0.001).
main sources of variation. Epistasis was deduced when an
Components of the mean differences in populations
interaction occurred.
derived from N and B strains: Reproductive organ
Congenic strains for the nonpairing region of theY
TABLE 2 in males from NB.NBF2or NB.BNF2mothers than those in males from BN.NBF2or BN.BNF2mothers, the differ-Paired testis and seminal vesicle weights (g, mean⫾SEM)
ence failed to reach significance (P ⬍ 0.057). In F1’s in C57BL/6By (B), NZB/BINJ (N) strains, and
and F2’s the greater weights were observed for the males reciprocal F1’s and F2’s
from the N mothers or grandmothers. A global estimate Generations and Seminal vesicle for the effect of the origin of the mother was significant sample size Testis weight weight for testis weight (Table 3). The product-moment corre-lation coefficient between testis and seminal vesicle B (n⫽17) 0.194⫾0.007 0.327⫾0.012
weights in the F2population wasr⫽ 0.45,P⬍0.001. N (n⫽16) 0.298⫾0.007 0.408⫾0.020
Mapping QTL:The three genotypesN//N,N//B, and BNF1(n⫽12) 0.254⫾0.012 0.448⫾0.027
NBF1(n⫽18) 0.288⫾0.004 0.438⫾0.019 B//B differed for testis weight (Kruskal-Wallis test) at F2(n⫽130) 0.256⫾0.003 0.448⫾0.022 theP⬍0.05 threshold for the following SSLPs: chromo-some4,D4Mit205a(K⫽20.89,P ⬍0.0001), D4Mit12 (K ⫽ 16.94, P ⬍ 0.0005); chromosome10, D10Mit20 (K⫽6.94,P⬍0.05);D10Mit14(K⫽14.57,P⬍0.005); and B strains. Sample sizes and values in parental strains
and reciprocal F1’s and F2’s are shown in Table 2. Paren- chromosome 13, D13Mit3 (K ⫽ 8.36, P ⬍ 0.01),
D13Mit13 (K ⫽ 6.76, P ⬍ 0.05); chromosome 18, tal strains differed for the two measures (t⫽4.75,P⬍
0.0001, andt⫽ 3.63,P⬍0.001, for testis and seminal D18Mit17 (K⫽ 9.83,P⬍ 0.005); and chromosomeX, DXMit25(K⫽8.87,P⬍0.005),DXMit223(K⫽19.29, vesicle weights, respectively), the reproductive organs
being heavier in the N than in the B strain. No signifi- P ⬍ 0.0005). For seminal vesicle weight, differences between the genotypesN//N,N//B, andB//Bappeared cant difference was shown (NB.NBF2’s and BN.NBF2’s
did not differ from NB.BNF2’s and BN.BNF2’s) for the only for chromosome4atD4Mit205a(K⫽35.21,P⬍ 0.0001),D4Mit12(K⫽20.71,P⬍0.0001). Hence, QTL origin of the YNPARin the F
2’s. Heritabilities were 0.823
and 0.507 for testis and seminal vesicle weights, respec- mapping was performed with MapQTL for chromo-somes 4,10,13,18, and X(Figure 1). For paired tes-tively, in this population. The difference between the
two values may result from the lower contrast between tis weight, highly significant linkages were reached for the QTL found on chromosomes 4, 10, and X(LOD seminal vesicle weights in B and N strains. The best
fitting models (2⫽8.140;P⬍0.10 for testicular weight scores ⱖ 4.3; Lander and Kruglyak 1995) and sug-gested linkage on chromosomes 13 and 18 (LOD and2⫽3.015;P⬍0.70 for seminal vesicle weight) for
estimation of the components of the mean differences scoresⱖ2.8). A highly significant linkage emerged also on chromosome 4 for paired seminal vesicle weight were selected according toKerbuschet al.(1981; Table
3). They indicated a polygenic mode of inheritance for (Figure 1). The sum of the contributions of the QTL to the phenotypic variance was lower for each of the both testis and seminal vesicle weights because of a
significant [l] interaction between heterozygous loci for two measures (72.8% for testis weight and 24.2% for seminal vesicles weight) than the corresponding esti-the two measures.
The parameters contributing to the mean differences mated total genetic variance (82.3 and 50.7% for testis and seminal vesicle weights, respectively). The values differed for the two phenotypes since a dominance
ef-fect was shown for testis and not for seminal vesicle that were computed for the three genotypes at the SSLP closest to the peak of the QTL indicated that alleles weight, suggesting partially different genetic bases. A
contribution of the origin of the mothers appeared for from the N strain contributed to increased testis and seminal vesicles weights (Table 4).
testis weight and not for seminal vesicle weight. The
NBF1 males had higher testis weight than BNF1 males No deviation due to dominance was detected for the QTL linked with testis weight. This conclusion fits with (t⫽4.75,P ⬍0.01). Although the testes were heavier
inspection of Table 4 indicating thatB//Ngenotype had midvalues between B//B and N//N but not with the TABLE 3
results from biometrical analysis. As epistasis is sus-Components of the mean differences for paired testis pected to induce false QTL detection, we performed and seminal vesicle weights in generations derived from square root raw data transformation to eliminate the C57BL/6By (B), NZB/BINJ (N) mice (150⫾6 days of age) interaction between homozygous loci that appeared
in the analyses of the components of the means for Paired testis weight Paired seminal vesicle weight the two measures (Table 3). The subsequent analysis
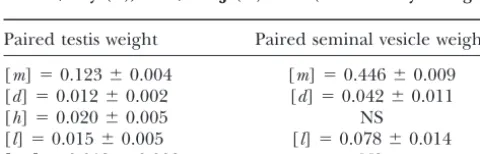
showed that epistatic contribution disappeared [l] (did [m]⫽0.123⫾0.004 [m]⫽0.446⫾0.009
[d]⫽0.012⫾0.002 [d]⫽0.042⫾0.011 not reach the significance for testis or for seminal vesicle [h]⫽0.020⫾0.005 NS weights) when this transformation was performed. A [l]⫽0.015⫾0.005 [l]⫽0.078⫾0.014 new QTL analysis with the transformed individual values
[om]⫽0.012⫾0.003 NS
Figure 1.—LOD plot of paired testis and seminal vesicle weights as calculated by MapQTL (tm) version 3.0 package (van Ooijen
andMaliepaard1996). Ge-netic distances from centro-mere are indicated on the x-axis with SSLPs used as markers for maximum like-lihood tests.
above. The absence of epistasis between the QTL that strain for seminal vesicle weight (F⫽8.97,P⬍0.0037) and testis weight (F⫽ 7.18,P⬍0.009).
we detected for testis weight was confirmed by calculat-ing the interactions between the SSLP closest to the peak of the QTL because none of these interactions
DISCUSSION reached theP⬍ 0.05 threshold.
Contribution of the YNPAR: No effect of the YNPAR was We reported large differences related to genetic
vari-ability in testis and seminal vesicle weights in a popula-detected from the analysis of reciprocal F2’s, whereas it
appeared in a quartet of congenic strains for the YNPAR tion of 13 inbred strains of mice. Genetic analyses were
performed with different complementary approaches. (Table 5). The recipient strain (Nvs. H) contributed
to testis and seminal vesicle weights (F ⫽ 55.23, P ⬍ Contribution of the YNPARto paired testis and seminal vesicle weights:The YNPAR contributed to reproductive
0.0001 and F ⫽ 96.19, P ⬍ 0.0001, respectively). The
TABLE 4
QTL for paired testis and seminal vesicle weights in reciprocal F2mice derived from C57BL/6By (B) and NZB/BINJ (N) strains (150⫾6 days of age)
Chromosomal positiona LOD score N//N N//B B//B % of total variance
Testis weight Chromosome4
D4Mit205a(48 cM⫾11.62) 5.96 0.285b 0.265b 0.246b 17.5
Chromosome10
D10Mit14(57 cM⫾17.13) 5.81 0.282 0.264 0.241 11.9
Chromosome13
D13Mit13(13.4 cM⫾15.10) 3.10 0.269 0.261 0.248 13.5
Chromosome18
D18Mit17(20 cM⫾22.16) 2.80 0.272 0.260 0.251 9.2
ChromosomeX
DXMit25(37.8 cM⫾9.85) 9.11 0.272 0.257 20.7
Seminal vesicle weight Chromosome4
D4Mit205a(47.5 cM⫾8.42) 9.21 0.540 0.438 0.387 24.2
aSSLP closest to the peak of the QTL. Values in parentheses correspond to the distance from the centromere
with the confidence interval.
bMean phenotypic values at the QTL for the three possible F2genotypes.
quartet of congenic strains, for this chromosomal re- aging a wide genome scan to investigate QTL. In the present study, five QTL contributing to 72.8% of the gion, using H and N as parental strains. The YNPARfrom
the N strain that had heavier testes increased testicular total variance were detected for testis weight, the total genetic variance being 0.823.
weight in the H strain and the transfer of YNPARfrom the
H strain reduced testicular weight in N. For the seminal Three QTL involved in testis weight had the values corresponding to a highly significant level (LOD vesicle weight, the N strain was more reactive because
the YNPARfrom the H strain reduced this weight on the scoreⱖ4.3;
LanderandKruglyak1995). The strong genetic contribution that appeared for the QTL map-N background, whereas it had no significant effect on
H. The sizes of the effects were small and contributed ped on theXchromosome is compatible with the pre-viously published results from a biometrics analysis to only a small part of the difference observed between
the parental strains, suggesting that non-YNPAR regions (HuntandMitwoch1987) and with the observed
dif-ference between our reciprocal F1’s (Table 2). The other contribute to both testis and seminal vesicle weight.
The non-YNPAR contribution to reproductive organ highly significant QTL mapped on chromosomes4and
10.We have also found two “suggested” QTL on chro-weights was investigated generating the two reciprocal
F1’s and the four reciprocal F2’s between the N and B mosomes13and18.The QTL mapped on chromosome
13was at 13.4⫾15.10 cM from the peak ofTwq1(Zidek
parental strains, these strains being among the most
contrasted strains out of a sample of 13 inbred strains. et al. 1998), which is a debated QTL, for the reasons presented above. It is, moreover, at the limit of the
QTL for paired testis weights: As in recent studies
that had used backcross and intercross generations, we confidence interval of our suggested QTL.Zideket al. (1998) had also reported a suggested difference be-found a polygenic inheritance of testis weight,
encour-TABLE 5
Paired testis and seminal vesicle weights (g, mean⫾SEM) in congenic strains for the specific part of theYchromosome derived from CBA/H (H) and NZB/BINJ (N) (90⫾5 days of age)
Measure Parental strains Congenic strains for YNPAR
Testis weight H⫽0.125⫾0.019 (n⫽21) H.N-YNPAR⫽0.134⫾0.001 (n⫽16)a
N⫽0.294⫾0.012 (n⫽21) N.H-YNPAR⫽0.228⫾0.002 (n⫽20)
Seminal vesicle weight H⫽0.133⫾0.005 (n⫽21) H.N-YNPAR⫽0.126⫾0.006 (n⫽16)
N⫽0.377⫾0.007 (n⫽21) N.H-YNPAR⫽0.281⫾0.007 (n⫽20)
aH.N-YNPARindicates H strain with a nonpairing region of theYchromosome from N and N.H-YNPARindicates
tween the genotypes B//B and D//D for D18Mit19 at For the QTL linked with testis and seminal vesicle 2 cM from the centromere. The mice carrying D//D weights, the leptin receptor gene (Lepr) may be a com-alleles had, as expected, heavier testes than those with mon candidate, as leptin is involved in reproductive B//B.However, even if the LOD score found by Zideck organ weights. The Lepr gene is mapped on chromo-and the LOD score detected in our study were low, the some4at 46.7 cM from the centromere, this distance confidence intervals of the two QTL overlapped. being included in the confidence interval of both these
QTL for paired seminal vesicle weights: Heritability QTL (48 and 47.5 cM from the centromere, respec-was lower for this organ (50.7%) than for testis weight, tively).
this difference resulting, probably, from the smaller con- The confidence interval of the QTL mapped on the trast between the N and B6 strains. The biometrics analy- Xchromosome (38.6 cM) encompasses the androgen sis performed with the mice that were used for testicular receptor gene (Ar), which is mapped at 36 cM from the weights indicated a polygenic inheritance because an centromere on the X chromosome (Mouse Genome epistatic component ([l], interaction between heterozy- Database1999). Argene is a member of the nuclear gous loci) reached significance. For this reason, chromo- receptor superfamily that acts as a ligand-dependent somal regions linked to paired seminal vesicle weights tissue, specific transcription factor (Magelsdorf et al. were investigated. In the present analysis, a substantial 1995). It is activated by binding testosterone or dihy-QTL (24.2% of the total variance, half of the genetic drotestosterone. A single point mutation in the N-termi-variance) has been detected on chromosome4.Its dis- nal region ofArresults in a premature stop codon lead-tance from the centromere (47.5 cM) did not differ ing to the expression of a nonfunctional truncated form from the distance obtained for testicular weight on chro- ofAr(Gasparet al.1991). Due toX-link,Tfmmice are mosome4.Thus testis and seminal vesicle weights could genetically males with smaller testes that are consistently be linked to the same QTL as expected from correla- found in the inguinal region upon dissection (Hutson tions in the F2 population. et al.1994). During development, the fetal testes secrete
Candidate genes:Investigation of candidate genes al- testosterone and antimulerian hormones, which are es-ways implies uncertainty in F2’s or recombinant inbred sential to proper differentiation and growth of the male strains because the confidence interval is large, due to reproductive tract. During later sexual maturation, dihy-the reduced number of informative meioses, and hence drotestosterone, the more potent testosterone metabo-encompassing a high number of genes. However, given
lite, results in virilization of external genitalia. that the physiological bases of the reproductive organ
The susceptibility to testicular teratomas depends on weights are documented, they may pave the way to
sug-theTergene in the 129 strain. It was mapped on chromo-gesting potential candidates. Briefly, the
hypothalamic-some18nearD18mit 62(Asadaet al.1994;Sakuraiet pituitary axis is related to testes via two pathways. The
al.1995), which is close to the peak of the QTL that morphogenic effect of follicle-stimulating hormone
we found on this chromosome. As theTergene reduces (FSH) on testes is activated by the development of
epi-germ cells in many strains of mice and was mapped in thelial tissues in seminiferous tubules and proliferation
crosses derived from males having smallvs.normal-sized of Sertoli cells. This process is perinatal because the
testes, it could be a candidate for the QTL that we Sertoli cells’ proliferation stops at about 12 days after
mapped on chromosome18.The contribution of gluco-birth (Kluin et al. 1984). Inhibin, testosterone, 17
-corticoid receptor 1 (Grl-1) remains open (Sakuraiet estradiol, and dihydrotestosterone ensure a
feedback-al.1995). loop from Sertoli cells to hypothalamic-pituitary axis. A
Conclusions:The present QTL analysis led to describ-second pathway starting from this axis via luteinizing
ing five chromosomal regions implicated in testis weight hormone reaches Leydig cells with a feedback loop to
and one implicated in seminal vesicle weight. The ge-the hypothalamic-pituitary axis by testosterone and 17
-netic contribution of the QTL linked to testis weight estradiol. The implication of hypothalamic-pituitary axis
reached the heritability value, suggesting that a small on these pathways is modulated by several factors.
Lep-number of QTL were undetected in the F2population. tin reduces its sensitivity, modifying the fasting-induced
The picture was different for seminal vesicle weight for inhibition of gonadotropin releasing hormone (Barash
which 26.5% of the genetic variance was uncovered by et al.1996) acting on frequency and amplitude of pulses
the QTL described herein. The contribution of the spe-of FSH. The implication spe-of leptin in reproductive organ
cific part of theYchromosome to reproductive organ weights has been directly observed because leptin
injec-weights is not in contradiction with this conclusion. tion increases epithelial heights, producing an
augmen-Several genes are linked to YNPARand other genes such
tation of both testes and seminal vesicles in mice (
Bar-ashet al. 1996). Candidate genes implicated in these asTdycould be implicated in this phenotype.
mechanisms and included in the confidence intervals of This work was supported by the CNRS (UPR 9074), Ministry for putative QTL were screened using theMouse Genome Research and Technology (Paris V-Rene´ Descartes and University of Orle´ans), Re´gion Centre and Pre´fecture de la Re´gion Centre, and
traits: guidelines for interpreting and reporting linkage results. Fondation pour la Recherche Me´dicale. UPR 9074 is affiliated with
Nat. Genet.11:241–247. INSERM and the University of Orle´ans.
Lee, H., C. Gong, S. WuandM. R. Iyrengar,1991 Anulation of
phosphocreatine and creatine in the cells and fluid of mouse seminal vesicles is regulated by testosterone. Biol. Reprod.44:
540–545.
LITERATURE CITED Le Roy, I., P. L. Roubertoux, L. Jamot, F. Maarouf, S. Tordjman
et al., 1998 Neuronal and behavioral differences between Mus
Argyropoulos, G.,andJ. G. M. Shire,1989 Genotypic effects on
musculus domesticus (C57BL/6JBy) and Mus musculus castaneus gonadal size in fetal mice. J. Reprod. Fertil.86:473–478.
(CAST/Ei). Behav. Brain Res.95:135–142.
Asada, Y., D. S. Varnum, W. N. FrankelandJ. H. Nadeau,1994
Le Roy, I., S. Mortaud, S. Tordjman, E. Donsez-Darcel, M. Carlier A mutation in theTergene causing increased susceptibility to
et al., 1999 Correlation between expression of the steroid sul-testicular teratomas maps to mouse chromosome 18. Nat. Genet.
fatase gene, mapped on the pairing region of the Y-chromosome,
4:363–368.
and initiation of attack behavior in mice. Behav. Genet.29:131–
Barash, I., C. C. Cheung, D. S. Weigle, H. Ren, E. B. Kabigtinget
136. al., 1996 Leptin is a metabolic signal to the reproductive system.
Magelsdorf, D. J., C. Thummel, M. Beato, P. Herrlich, G. Schutz Endocrinology137:3144–3147.
et al., 1995 The nuclear receptor superfamily: the second
de-Carlier, M., P. L. Roubertoux, M.-L. KottlerandH. Degrelle,
cade. Cell83:835–839. 1990 Y-chromosome and aggression in strains of laboratory
Mather, K.,andJ. L. Jinks,1971 Biometrical Genetics, Ed. 2.
Chap-mice. Behav. Genet.20:137–156.
man & Hall, London.
Carlier, M., P. L. Roubertoux and C. Pastoret, 1991 The Y
McKinney, T. D.,andC. Desjardin,1973 Postnatal development
chromosome effect on intermale aggression in mice depends on
of the testis, fighting behavior, and fertility in house mice. Biol. the maternal environments. Genetics129:231–236.
Reprod.9:279–294.
Chubb, C.,1992 Genes regulating testis size. Biol. Reprod.47:29–36.
Michard-Vanhee, C.,andP. L. Roubertoux,1990 Genetic analysis
Collins, R. L.,1985 On the inheritance of the direction and the
of differences in behavioral reactivity to neonatal injection of degree of asymmetry, pp. 41–71 inCerebral Lateralization in
Nonhu-testosterone in female mice. Behav. Genet.19:63–71. man Species, edited byS. Glick.Academic Press, New York.
Mouse Genome Database,1999 Mouse Genome Informatics, The
Darvasi, A.,andM. Soller,1997 A simple method to calculate
Jackson Laboratory, Bar Harbor, ME. World Wide Web (URL: resolving power and confidence interval of QTL map location.
http://www.informatics.jax.org). Behav. Genet.27:125–132.
Roubertoux, P. L., M. Carlier, H. Degrelle, M. C. Haas-Duper-Franc¸ois, M. H., M. Nosten-Bertrand, P. L. Roubertoux, M. L.
tuis, J. Phillipset al., 1994 Co-segregation of the
pseudoau-KottlerandH. Degrelle,1990 Opponent strain effect on
tosomal region of the Y chromosome with aggression in mice. eliciting attacks in NZB mice: physiological correlates. Physiol.
Genetics136:225–230. Behav.47:1181–1185.
Sakurai, T., T. Iguchi, K. MoriwakiandM. Noguchi,1995 The
Gaspar, M. L., T. Meo, P. Bourgarel, J. L. GuenetandM. Tosi,
termutation first causes primordial germ cell deficiency in ter/ 1991 A single base deletion in the Tfm androgen receptor gene
ter mouse embryos at 8 days of gestation. Dev. Growth Differ. creates a short-lived messenger RNA that directs internal
transla-37:293–302. tion initiation. Proc. Natl. Acad. Sci. USA19:8606–8610.
Sambrook, J., E. FritschandT. Maniatis,1989 Molecular Cloning:
Gregorova, S., P. Ivanyi, M. SimonovaandM. Michova,1977 H-2
A Laboratory Manual.Cold Spring Harbor Laboratory Press, Cold associated differences in androgen-influenced organ weights of Spring Harbor, NY.
A and C57BL/10 mouse strains and their crosses.
Immunogenet-SAS Institute,1987 SAS/STAT User’s Guide, Version 6. SAS Institute
ics4:301–313. Inc., Cary, NC.
Hunt, S. E.,andU. Mittwoch,1987 Y-chromosomal and other Shire, J. G. M.,andA. Bartke,1972 Strain differences in testicular
factors in the development of testis size in mice. Genet. Res.50: weight and spermatogenesis with special references to C57bl/
205–211. 10J and DBA/2J mice. J. Endocrinol.55:163–171.
Hutson, J. M., M. Backer, M. Terada, B. ZhouandG. Paxton, Shukri, N. M.,andJ. G. Shire,1989 Genetic variation in testicular
1994 Hormonal control of testicular descent and the cause of development in mice of the C57BL/10ScSn, C57BL/6By and cryptorchidism. Reprod. Fertil. Dev.6:151–156. BALB/cBy strains and the CXB recombinant inbred lines. J.
Islam, A. B. M., W. G. HillandR. B. Land,1976 Ovulation rate Reprod. Fertil.87:587–592.
of lines of mice selected for testis weight. Genet. Res.27:23–32. Shukri, N. M., F. GrewandJ. G. Shire,1988 Recessive mutation
Jean-Faucher, C., M. Berger, M. de Turckheim, G. VeyssiereandC. in a standard recombinant-inbred line of mice affects seminal
Jean,1983 Testicular response to HCG stimulation and sexual vesicle shape. Genet. Res.52:27–32.
maturation in mice. Horm. Res.17:216–221. van Ooijen, J. W.,andC. Maliepaard,1996 MapQTL (tm) version
Kerbusch, J. M. L., F. J. van der StaayandN. Hendricks,1981 A 3.0, Software for the calculation of QTL positions on genetic
searching procedure for transformation and models in a classical maps. CPRO-DLO, Wageningen, The Netherlands.
mendelian cross breeding study. Behav. Genet.11:239–254. Washburn, L. L.,andE. M. Eicher,1989 Normal testis
determina-Kluin, P. H. M., M. F. KramerandD. G. De Rooij,1984 Prolifera- tion in the mouse depends on genetic interaction of a locus on
tion of spermatogonia and sertoli cells in maturing mice. Anat. chromosome17and theYchromosome. Genetics123:173–179.
Embryol.169:173–178. Zidek, V., A. Musilova, J. Pintir, M. SimakovaandM. Pravenec,
Krzanowska, H.,1971 Influence of Y chromosome on fertility in 1998 Genetic dissection of testicular weight in the mouse with
mice, pp. 370–386 inEdinburgh Symposium on the Genetics of Sperma- the BXD recombinant inbred strains. Mamm. Genome9:503– tozoon, edited byR. A. BeatlyandS. Gluecksohn-Walsh.The 505.
University Press, Edinburgh.