Automated Glaucoma Detection using Cup to
Disc Ratio
Chaitali D. Dhumane
1, S.B. Patil
2P.G. Student, Department of E&TC, Sinhgad College of Engineering, Pune, Maharashtra, India1
Asst. Professor, Department of E&TC, Sinhgad College of Engineering, Pune, Maharashtra, India2
ABSTRACT: The aim of this paper is to design and implement an automated system for glaucoma detection using cup to disc ratio. Glaucoma is a chronic eye disease affecting the optic nerve which leads to blindness. It is second leading cause for blindness. Glaucoma affects Optic nerve head. Some methods for glaucoma detection include measurement of intraocular pressure, assessment of abnormal visual field and assessment of damaged optic nerve head. Calculation of cup to disc ratio is one of the methods in assessment of damaged optic nerve head. Optic Disc and Optic Cup are parts of nerve head. First, retinal fundus image is acquired. Then optic disc is localized using thresholding. This is preprocessing step. Accurate localization is very important marker for many computer aided design techniques. Superpixel segmentation (which uses simple linear iterative clustering algorithm) is used to extract correct disc and cup boundaries. Number of superpixels is the only parameter for superpixel segmentation. Center Surround statistics is used for feature extraction purpose. This is because area around disc looks similar to disc(Paripappilary Atrophy) in color but differs in texture. Artificial neural network is used as classifier. Then vertical cup diameter to vertical disc diameter ratio is calculated. If it is greater than normal value then that is glaucomatous. Objectives of project are correct localization of optic disc and finding cup inside disc. Resulting images show disc and cup boundaries and cup to disc ratio. Sensitivity and accuracy are two main parameters for evaluation purpose. Success rate achieved in this method is 89.18%.
KEYWORDS:Glaucoma, Optic disc , Optic cup, Retinal fundus image, Superpixel segmentation.
I. INTRODUCTION
Glaucoma is an eye disease that leads to poor vision and eventually blindness. Detecting the disease in time is important as it cannot be cured. It is a second leading cause of blindness. It is predicted that around 80 million people will be affected by 2020. It cannot be cured but by using different techniques and medical treatments the progression of the disease can be slowed down. Many people are unaware of the disease until it reaches at advance level. Vision loss from glaucoma is irreversible. This motivates one to find techniques which recognize glaucoma before it reaches to blindness. Optic nerve head segmentation is one of the methods to detect glaucoma. Nerve head comprise of optic disc and optic cup. They can be detected using segmentation. Then cup to disc ratio is taken. If this ratio exceeds threshold then it is glaucomatous otherwise healthy. In this way, glaucoma can be detected so that treatment can be done to slow down the development of the disease.
Several methods are used for detecting the glaucoma. It includes
Assessment of raised intraocular pressure.
Assessment of abnormal visual field.
Assessment of damaged optic nerve head.
A new technique is used known as cup to disc ratio (CDR) measurement. Cup to disc ratio requires disc and cup boundary detection. This is achieved using segmentation method. Various techniques are used for this purpose. Disc segmentation can be done using template based methods, deformable model based methods and pixel classification based methods. Optic cup detection is more challenging job. It is difficult to detect boundary of the cup without depth information. Some of the methods for cup segmentation are- thresholding, level set based approach, r-bend method, regression based method.
All these methods have some limitations and hence new technique called superpixel classification based segmentation [1] is proposed. This method uses simple linear iterative clustering algorithm and centre surround statistics for correct detection of cup and disc. Cup to disc ratio is calculated for given data set. This method gives more accuracy than earlier methods. In this method, 2-D fundus images are used. 3-D images can also be used for the same purpose but they are not easily available and obtaining them is expensive. Hence for large scale screening program it is not appropriate method. In 2-D images, the optic nerve head is divided into two zones. 1] optic cup 2] neuretinal rim. Optic cup is bright zone. A peripheral region is called as neuroretinal rim. The optic nerve head is also called as optic disc.
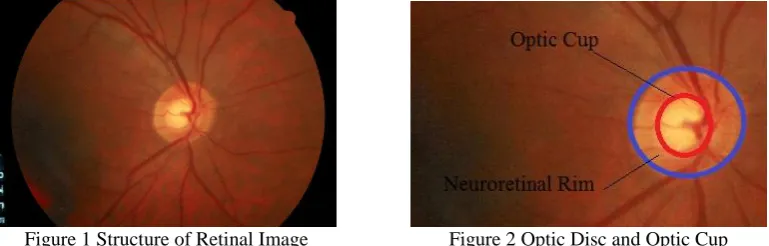
Figure 1 Structure of Retinal Image Figure 2 Optic Disc and Optic Cup
Figure 1 shows major structures of disc. In figure 2 the region inside the blue line is optic disc and region inside red line is optic cup. The region between the red line and blue line is neuroretinal rim. CDR is calculated by taking ratio of vertical cup diameter to vertical disc diameter. Accurate segmentation of disc and cup are required for CDR calculation. For segmentation of optic disc and cup, superpixel classification is preferred. Centre surrounding statistics is computed from superpixels for feature extraction. Location information for cup segmentation is included along with CSS for cup boundary detection.
II. RELATED WORK
There are various techniques for glaucoma detection in image processing field. This includes image based feature extraction, wavelet energy features, CDR calculation etc.
Bock et al in 2007 proposed glaucoma classification using image based features[1]. The method is automated,
appearance based glaucoma classification system. Segmentation is not used . This is purely data driven approach which is applicable in large scale screening examination. Several types of image based features were analysed and are combined to capture glaucomatous structure. This method does not depend on the explicit outlining of the optic disc. This method gives the success rate of 86%. One limitation of this method is that classification on separate test data and training data shows slightly inferior performance.
91%.The system is able to distinguish between normal and glaucoma cases even when the decision on glaucoma was only at suspect level. One limitation of this method is that Performance of Histogram of Intensity Cluster(HIC) is inferior compared to Random Transform based Descriptor (RTD).
Annu, et al in 2013 proposed Glaucoma detection using wavelet energy[3]. This includes glaucomatous image
classification using image texture features and classification using Probabilistic Neural Network (PNN). Wavelets used are daubechies, symlets, and biorthogonal wavelet filters. This method uses wavelet decomposition technique. This technique is very appealing due to its low computational complexity. It is Rapid, easy to operate, non invasive and inexpensive. Success rate is 95%. Limitation of this method is Classification by probabilistic neural network is not powerful enough. More powerful will produce more accuracy.
Chalinee et al in 2013 proposed “Image Processing Techniques For Glaucoma Detection Using Cup to Disc
Ratio”[4]. In this paper, the authors propose a method to calculate the CDR automatically from nonstereographic retinal fundus photographs. To automatically extract the disc, two methods making use of an edge detection method and variational level-set method are proposed in the paper. For the cup, color component analysis and threshold level-set method are evaluated. Ellipse fitting is applied to the obtained image for boundary. This method detects the edges with noise suppressed at the same time. Accuracy of this method is 89%. As depth of cup is not considered to detect its boundary, its detection is not efficient.
Image features method is appearance based method hence accuracy is less and test data gives inferior performance than training data. Motion pattern based method gives success rate of 91%. But histogram of intensity clusters gives inferior performance. In wavelet energy features method, classification by PNN is not powerful enough. In Chalinee’s method, for finding cup boundary, depth of cup is not considered. Hence cup detection is not efficient.
III.PROPOSEDMETHODOLOGY
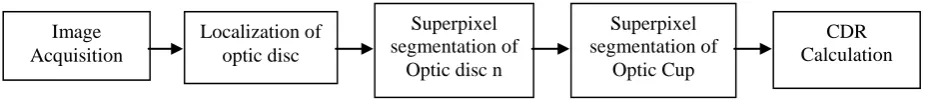
Figure 3 shows block diagram of the proposed work for glaucoma detection. Preprocessing step consists of localization of the optic disc. The next step is to find disc and cup diameter. For this disc and cup boundaries are detected using superpixel segmentation. Then vertical cup diameter to vertical disc diameter ratio is taken which is CDR. This CDR is then compared with threshold. If it is greater then it is glaucomatous otherwise healthy.
A. PREPROCESSES
An important prerequisite for automation is the accurate localization of the main anatomical features in the image. In glaucoma, optic disc is the region of interest. Preprocessing includes localization of the disc in retinal color fundus images. First threshold using gray level histogram and average number of pixels occupied by OD are estimated. Applying this threshold, all bright regions within image called clusters are detected. Then morphological operations are applied to remove unwanted areas.
Algorithm for finding region of interest is as follows[6]. Step 1: Estimate Threshold.
Step 2: Apply Threshold and identify bright regions.
Step3: Apply morphological operations (closing, opening, areaopen). Localization of
optic disc
Superpixel segmentation of
Optic disc n Image
Acquisition
Superpixel segmentation of
Optic Cup
CDR Calculation
Step 4: Stop.
1. Threshold Estimation
First all bright regions within retinal images are detected. Gray level thresholding is used. Threshold considering gray level histogram is estimated. Optimal thresholding method divides the pixels of the image in two groups: group A and group B such that group A contains pixels at least equal to the number of pixels occupied by the OD.
OD size varies from person to person. It is a vertical oval, with average dimensions of 1.76mm horizontally by 1.92mm vertically. Its width and height are 1/8 and 1/7.33 of retinal image diameter, respectively. Thus, it is possible to determine the number of pixels occupied by the OD as :
𝑃
𝑐𝑜𝑢𝑛𝑡=
𝑒𝑠𝑡𝑖𝑚𝑎𝑡𝑒𝑑
𝑂𝐷
𝑝𝑖𝑥𝑒𝑙
𝑐𝑜𝑢𝑛𝑡
=
𝜋
× (
𝐷
2)
27.33 × 8
(1)[6]
where D is the diameter of the retinal image in pixels. To obtain an optimal threshold, the histogram derived from the source image is scanned from highest intensity value to the lowest intensity value. The scanning stops at intensity level T when scanned pixels are greater than the estimated OD pixels and there is a 10% rise in pixel count between two consecutive intensity levels.
Optimal threshold calculation is done as follows. Step1 : Initialize i = 255 and sum = 0
Step2: sum = sum + H[i] Step3: i = i-1
Step4: if sum ≤ Pcount or (H[i-1]-H [i])/ H [i] 1 < 0.1 repeat steps 2 through 4
Step5: Threshold, T = i
2. Morphological Operations
To eliminate unwanted bright areas, morphological operations [7] are used. After applying threshold, the disc obtained gives some discontinuities due to veins present in retina. Thus closing operation is applied which fills black portion in white area with white pixels. To eliminate unnecessary clusters, opening operation is used. This function works exactly opposite of closing operation. Structuring element used in both operations is disk shaped of size 10. After this, if there are still clusters present other than disc then areaopen operation is used. Centre of disc plays important role in cup detection for analysis of glaucoma. Disc centre can be find by using properties of region of interest. Centroid of the region of interest is found out which is disc centre.
B. OPTIC DISC SEGMENTATION
Superpixel segmentation [1] method is used to segment the disc. First, superpixels are generated using simple linear iterative clustering algorithm [8](SLIC) to group nearby pixels into superpixels in retinal images. In this, pixels are
grouped depending on color and spatial proximity. In SLIC, initial cluster centers Ck are sampled by S=√ (N/k) pixels
apart from the image with N pixels. The centers are first decided at the lowest gradient position in a 3* 3 neighborhood. Then clustering is applied. For each cluster center, this algorithm iteratively searches for the pixel which matches
accurately from the (2S*2S) neighborhood around center based on color and spatial closeness and then the new cluster
center is computed based on the pixel which is found matched. The process iterates till the distance between the new centers and previous centers ones is small. Then feature extraction is proposed. In this center surround statistics is used.
C. FEATURE EXTRACTION
the disc correctly. To compute this, nine spatial scale dyadic Gaussian pyramids [9] are generated. It is a sequence of low-pass filtered versions of an image.
This is achieved by convolving a linearly separable Gaussian filter followed by decimation. Decimation is done by a factor of two. Then center surround operation between center levels and surround levels is applied and six maps are obtained at levels of 2–5, 2–6, 3–6, 3–7, 4–7, and 4–8 Maps are computed only for red channel. Hence feature size is 6*2=12. The CSS features are then computed as the first and second moments of these maps within superpixels. Where Mi, i=1,2,……18 as the ith map, the feature CSSj consists of the mean µj and variance varj of maps within the
superpixels that is CSSj = [µj varj], where µj and varj from superpixel SPj with nj pixels are computed by
µ
j(i)=(1/n
j)*
(𝑥,𝑦)𝜖𝑆𝑃𝑗𝑀
ᵢ
𝑥
,
𝑦
(2)[1]
var
j= (1/n
j)*
(𝑥,𝑦)𝜖𝑆𝑃𝑗(
𝑀
ᵢ
𝑥
,
𝑦
− µj i )²
(3)[1]
In this, mean and variance of the superpixels is calculated. Finally artificial neural network is used as classifier to classify superpixels as disc or non disc. Ellipse fitting is applied to get disc boundary.
D. OPTIC CUP SEGMENTATION
Superpixel generation is used in the same way as disc. After obtaining the disc, the minimum bounding box of the disc is used for cup segmentation. Center surround statistic is used as feature. For cup only sixth map is taken into consideration as it gives necessary information for cup detection. This reduces feature size. As a result, evaluation time also reduces. Disc centre and superpixel centre are taken into consideration and distance between them is calculated. This gives the location of the cup inside the disc. Classification of the superpixels is done using artificial neural network. Ellipse fitting is applied to get boundary of cup.
E. CLASSIFICATION
An artificial neural network[10] is an information processing system that has certain performance characteristics in common with biological neural networks. A neural network is characterized by its pattern of connections between the neurons, its method of determining the weights on the connections and its activation function. A neural net consists of elements called nodes. Neurons are connected to each other with weights. A neuron sends its activation as a signal to several other neurons. Artificial neural networks consist of many nodes, processing units analogous to neurons in the brain. The neural net can be a single layer or multilayer net. In a single layer net there is a single layer of weighted interconnections. A multi-layer artificial neural network comprises an input layer, output layer and hidden layer of neurons. The activity of neurons in the input layer is represents the raw information that is fed into the network. In back propagation network input vectors and the corresponding target vectors are used to train a network until it can approximate a function. Standard back propagation is a gradient descent algorithm in which the network weights are moved along the negative of the gradient of the performance function.
F. CUP TO DISC RATIO
Vertical cup diameter to vertical disc diameter ratio is calculated.
𝐶𝐷𝑅
=
𝑉𝐶𝐷𝑉𝐷𝐷
(4)[1]
IV.EXPERIMENTALRESULTS
A. PREPROCESSING
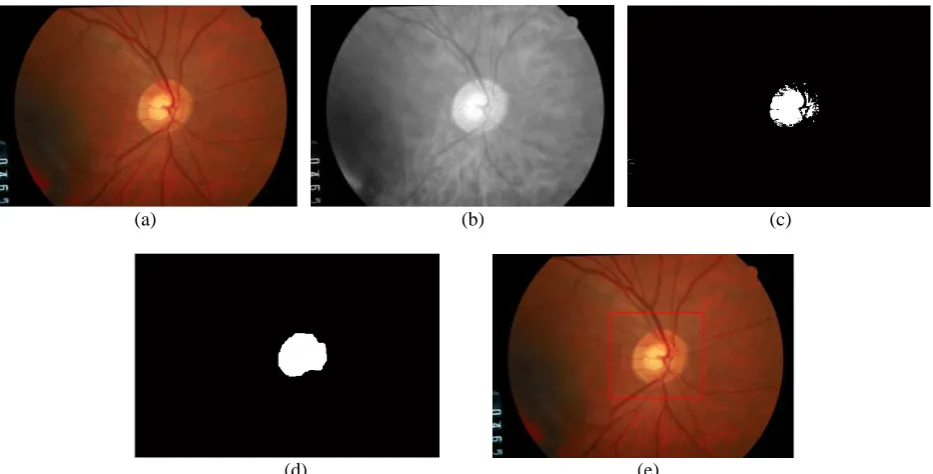
54 images are taken for evaluation. Localization of optic disc is the preprocessing step in this project. Thresholding method is used for locating optic disc. Value of threshold is based on pixel count and histogram. First color image is converted to red channel image. Then diameter of retina is found out. For this purpose, first red channel image is converted to binary image. Then number of pixels occupied by disc is calculated using formula. Then threshold is found out using steps given in methodology. This threshold value is applied to red channel image. This gives figure 4(c). There are some discontinuities in the cluster and some unwanted clusters are present in image. Hence morphological operations are used.
(a) (b) (c)
(d) (e) Figure 4 Localization of Optic Disc. (a)Original Image. (b)Red channel Image (c)Thresholded Image. (d)Image after
Morphological Operations on (c). (e)Bounding Box to Disc.
In this project, first closing operation is used which fills discontinuities present inside the cluster. Then opening operation is used for removing unwanted clusters outside main cluster. Size of structuring element used for both operations is 10. After this, if there are still clusters present other than disc then areaopen operation is used. Thus only main cluster is remained in the image. This is region of interest and it is extracted from color image by using bounding box as shown in figure 4(e). Figure 4(c) shows thresholded image and 4(d) is image after applying closing opening and areaopen operations on thresholded image. Figure 4(e) shows the localized disc on retinal image which is taken for further operations.
B. SEGMENTATION AND CLASSIFICATION OF OPTIC DISC
(a) (b) (c) (d)
Figure 5 Superpixel Segmentation of Optic Disc and Boundary Detection (a)Region of Interest. (b)SLIC Superpixels. (c)Classification Result. (d)Detected Optic disc Boundary.
Segmentation result is shown in figure 5(b). Artificial neural network is used for classification. This classifies superpixels as disc or non disc. First classifier is trained and then tested on images. Classification result is shown in figure 5(c). Finally raw boundary is marked on color image and ellipse fitting is done shown in figure 5(d).
C. SEGMENTATION AND CLASSIFICATION OF OPTIC CUP
Segmentation is done on the disc to get cup boundary. Here also superpixel segmentation is used. Parameter values are same as disc segmentation.
(a) (b) (c) (d)
Figure 6 Superpixel Segmentation of Optic Cup and Boundary Detection (a)Optic Disc Bounding Box. (b)SLIC Superpixels. (c)Classification. (d)Detected Optic Cup Boundary.
Segmentation result is shown in figure 6(b). Artificial neural network is used for classification. This classifies superpixels as cup or non cup. Classification result is shown in figure 6(c). Finally raw boundary is marked on color image and ellipse fitting is done shown in figure 6(d).
Table -1: Classification Results
Total Images Trained Images Tested Images Successful Cases Failure Cases Success Rate %
54 17 37 33 4 89.18
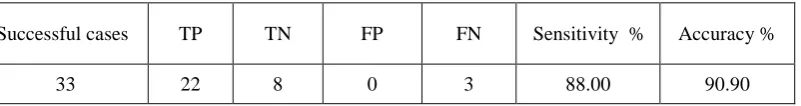
Table -2 Glaucoma Detection Results
Successful cases TP TN FP FN Sensitivity % Accuracy %
33 22 8 0 3 88.00 90.90
Table 2 shows glaucoma detection results. 22 cases shows that the patient has glaucoma and detected correctly. 8 cases show healthy images and detected correctly. 3 cases are false negative that shows 3 cases have glaucoma but falsely detected as healthy.
V. CONCLUSIONS
Proposed method detects whether patient is healthy or is at risk of glaucoma. This imaging technique does not require patient at the time of testing as only retinal image is sufficient. Cup to Disc ratio calculation method for glaucoma detection is superior to earlier methods. This uses superpixel segmentation method to detect disc and cup. This uses simple linear iterative clustering algorithm. Superpixel segmentation has less complexity than pixel based methods. The only parameter of segmentation is number of superpixels. Increasing this number increases accuracy of correct boundary but time required is more. Hence tradeoff between accuracy and time is achieved. 54 images are used for evaluation. Sensitivity and accuracy achieved are 88.00% and 90.90% respectively.
VI.ACKNOWLEDGEMENT
We would like to thank the DRIONS-DB (http://www.ia. uned.es/~ejcarmona/DRIONS-DB.html) for providing glaucoma database, SKNMC and General Hospital for valuable guidance about glaucoma and SCOE, Pune for providing platform.
REFERENCES
[1] Jun Cheng, Jiang Liu, Yanwu Xu, Fengshou Yin, Damon Wing Kee Wong, Ngan-Meng Tan, Dacheng Tao, “Superpixel Classification Based Optic Disc and Optic Cup Segmentation for Glaucoma Screening,” IEEE Transactions On Medical Imaging, Vol. 32, No. 6, June 2013. [2] R. Bock, J. Meier, G. Michelson, L. G. Nyl, and J. Hornegger,“Classifying glaucoma with image-based features from fundus
photographs,”Proc. 29th DAGM Conf. Pattern Recognit. , pp. 355–364,2007.
[3] K Sai Deepak, Madhulika Jain, Gopal Datt Joshi, Jayanthi Sivaswamy,“Motion pattern-based image features for glaucomadetection from retinal images,”ICVGIP ’12, December 16-19, 2012.
[4] N.Annu, Judith Justin, “Automated Classification of GlaucomaImages by Wavelet Energy Features,”International Journal of Engineering and Technology (IJET).
[5] B. Chalinee, W. Kongprawechnon, T. Kondo, S. Sintuwong, K. Tungpimolrut, “Image Processing Techniques for Glaucoma Detection Using the Cup-to-Disc Ratio,” Thammasat International Journal of Science and Technology, Vol. 18, No. 1, January-March 2013.
[6] D. Godse ,Dr. D. S. Bormane, “Automated Localization of Optic Disc in Retinal Images,” International Journal of Advanced Computer Science and Applications, (IJACSA), Vol. 4, No. 2, 2013.
[7] Rafael C. Gonzalez, Richard E. Woods, “Digital Image Processing”, Second Edition Prentis Hall, (2002).
[8] R. Achanta, A. Shaji, K. Smith, A. Lucchi, P. Fua, and S. Susstrunk“Slic superpixels compared to state-of-the-art superpixel methods,”IEEE Trans. Pattern Anal. Mach. Intell., vol. 34, no. 11, pp.2274–2281, Nov. 2012.
[9] E. H. Adelson, C. H. Anderson, J. R. Bergen, P. J. Burt, and J. M. Ogden, “Pyramid methods in image processing,” RCA Eng., vol. 29, no. 6, pp. 33–41, 1984.