GOMES, REUVEN JOSE. Testing of Diesel, BTL and Jet-A using a 1.8L Heavy Duty Optical Engine Test-Bed with High Speed Visualization Techniques
(Under the direction of Dr. Tiegang Fang).
by
Reuven Jose Gomes
A thesis submitted to the Graduate Faculty of North Carolina State University
in partial fulfillment of the requirements for the degree of
Master of Science Mechanical Engineering
Raleigh, North Carolina 2017
APPROVED BY:
_______________________________ _______________________________ Dr. Alexei Saveliev Dr. Stephen Terry
_______________________________ Dr. Tiegang Fang
DEDICATION
BIOGRAPHY
ACKNOWLEDGMENTS
Firstly, I would like to thank my advisor Dr. Tiegang Fang for giving me the opportunity to work on this project and for his patience and support. The skills and knowledge I have gained from this thesis experience are invaluable. I would also like to thank my committee members, Dr. Alexei Saveliev and Dr. Stephen Terry for being so understanding and accommodating and Dr. Saveliev for his help and guidance during my first semester here for his ‘Heat Transfer’ course and thereafter, at different points of my grad life.
I would like to thank Ashutosh Dharap and Himanshu Londhe for their help and inputs in the lab, Heramb Karnataki and Abhijit Padhiary for their help and their support and encouragement, and Arthur Candido for helping at critical moments. I especially thank Libing Wang and Aakash Jerome for their help with some experiments and without whom I couldn’t have completed this thesis. I also thank Steve Cameron for his wonderful craftsmanship on different parts I needed fabricated by him. A special thanks to Mr. Franco Fernando for his support, guidance and for being a mentor to me.
Most of all, I would like to thank my parents Jose and Marushka for their unconditional love, faith and constant encouragement, despite health and financial constraints, particularly during very rough times of my grad life and this thesis period. No matter the obstacle, in the end I know they’re always there for me.
TABLE OF CONTENTS
LIST OF TABLES………...…... …………vii
LIST OF FIGURES………...……. …...……viii
CHAPTER 1: INTRODUCTION………..1
CHAPTER 2: EXPERIMENTAL SETUP………...19
2.1 Cummins SCE-903…...19
2.2 Optical Access………...21
2.2.1 Mirror………...21
2.2.2 Optical Insert………...21
2.2.3 Extended Piston……….……...27
2.3 Powertrain………...…...28
2.3.1 Driver Engine……….….……....28
2.3.2 Speed Reducer and Coupling………..……....29
2.4 Lubrication and Cooling Systems………..……....31
2.5 Exhaust System………...…...33
2.6 Intake System………...…..35
2.7 Fuel System………..…..36
2.7.1 Mechanical Components of Fuel System………...36
2.7.2 Fuel Pressure Control System………..……...40
2.8 Shaft Encoder and Exhaust TDC Signal………...….41
2.10 In-Cylinder Pressure Data Acquisition System………...47
2.11 High Speed Camera Setup………...49
2.12 Speed Sensor………51
CHAPTER 3: METHODS AND EXPERIMENTAL PROCEDURE……….53
3.1 Experimental Procedure……….53
3.2 Data Analysis……….55
3.2.1 Cylinder Volume Measurement………..56
3.2.2 In-cylinder Pressure Data Analysis………....56
CHAPTER 4: RESULTS AND DISCUSSION………..62
4.1 Diesel Testing………63
4.1.1 In-cylinder Pressure Calculated Results……….63
4.1.2 Diesel Combustion and Spray Images……..………..70
4.2 BTL Testing………...82
4.2.1 Pressure Calculated Data………82
4.2.2 BTL Combustion and Spray Images………..88
4.3 Jet-A Testing………...96
4.3.1 Pressure Calculated Data………96
4.3.2 Combustion and Spray Images……….103
CHAPTER 5: CONCLUSION………..112
REFERENCES………..114
LIST OF TABLES
Table 1: Comparison of Geometrical Dimensions between N-14 and SCE-903………....7
Table 2: Comparison of BTL with other fuels………13
Table 3: SCE-903 Engine Specifications………..20
Table 4: Fuel Injector Calibration………...……54
LIST OF FIGURES
Figure 1: EPA Diesel Emission Standards………1
Figure 2: Bowditch Type Optical Engine………..3
Figure 3: Tianjin University Optical Engine Set Up………5
Figure 4: IFP Optical Engine………..6
Figure 5: Sandia National Laboratories (a) Closed (b) Open condition……….8
Figure 6: Sandia Setup for Three Spray Targeting Article………..….10
Figure 7: Sandia’s Schlieren Imaging Setup for Vapor Penetration……….…...11
Figure 8: SCE-903 Optical Engine Setup………20
Figure 9: Mirror used for Optical Access in SCE-903………...……21
Figure 10: Optical Insert Assembly………..22
Figure 11: Exploded View of Quartz Window Assembly………...23
Figure 12: SOLIDWORKS Model of New Optical Window with Curved Surface…...25
Figure 13: New Optical Window FEA Results………...….26
Figure 14: Extended Piston Assembly………...………...…28
Figure 15: Powermart Driver Engine………..……29
Figure 16: Speed Reducer and Couplings………..….30
Figure 17: Schematic for Lubrication and Cooling Systems……….…32
Figure 18: Lubrication and Cooling Systems……….….33
Figure 20: SCE-903 Exhaust System………..…….34
Figure 21: Intake System………..…….35
Figure 22: MAP Sensor……….…36
Figure 23: Schematic of SCE-903 Fuel System……….…..37
Figure 24: Fuel System Components………..…..38
Figure 25: SCE-903 Fuel Injector Assembly……….…..39
Figure 26: New Gasoline Injector and Adapter Assembly……….39
Figure 27: Fuel Pressure Control VI Front Panel………..41
Figure 28: Shaft Encoder, Speed Sensor and Optical Switch………42
Figure 29: Optical Switch and Circuit……….43
Figure 30: Circuit Diagram for CAD, ETDC and Injection Trigger………43
Figure 31: Injection Control Schematic……….…..45
Figure 32: Injection Control VI Front Panel……….….46
Figure 33: Kistler 6067B Pressure Sensor………...47
Figure 34: Pressure Data Acquisition VI Front Panel……….…..48
Figure 35: High-Speed Camera Trigger Setup……….……..49
Figure 36: Nikon High Speed Camera……….50
Figure 37: Time Stamp VI Front Panel………...51
Figure 38: Speed Sensor………52
Figure 39: Diesel In-Cylinder Pressure………67
Figure 41: Diesel Apparent Heat Release Rate………...……68
Figure 42: Diesel Burning Efficiency………..…….68
Figure 43: Diesel PV Diagram……….….69
Figure 44: Diesel IMEP Variations……….….69
Figure 45: Diesel Ignition Delay……….…..70
Figure 46: Fuel Injection Spray Image………71
Figure 47: Diesel 800bar spray……….73
Figure 48: Diesel 800 bar, -10°………..74
Figure 49: Diesel 1000bar spray………..……….75
Figure 50: Diesel 1000bar, -10°……….76
Figure 51: Diesel 1200bar spray………..……….77
Figure 52: Diesel 1200bar, -10°……….78
Figure 53: Diesel 800bar, -5°……….79
Figure 54: Diesel 1000bar, -5°……….…..80
Figure 55: Diesel 1200bar, -5°……….…..81
Figure 56: BTL In-Cylinder Pressure……….…….85
Figure 57: BTL Cumulative Heat Release Rate………..85
Figure 58: BTL Apparent Heat Release Rate……….86
Figure 59: BTL Burning Efficiency………..86
Figure 60: BTL P-V Diagram……….……..87
Figure 62: BTL Ignition Delay……….88
Figure 63: BTL 800bar spray…..……….90
Figure 64: BTL 800bar, -10°……….90
Figure 65: BTL 1000bar spray……….91
Figure 66: BTL 1000bar, -10°……….…..92
Figure 67: BTL 1200bar spray……….93
Figure 68: BTL 1200bar, -10°………...………94
Figure 69: BTL 800bar, -5°………..…….95
Figure 70: BTL 1000bar, -5°……….……95
Figure 71: BTL 1200bar, -5°………...…..96
Figure 72: Jet-A In-Cylinder Pressure………..…..99
Figure 73: Jet-A Cumulative Heat Release Rate………..100
Figure 74: Jet-A Apparent Heat Release Rate………..100
Figure 75: Jet-A P-V Diagram………101
Figure 76: Jet-A Burning Efficiency………...………...101
Figure 77: Jet-A IMEP Variations……….102
Figure 78: Jet-A Ignition Delay………..102
Figure 79: Jet-A 800bar spray…….………...104
Figure 80: Jet-A 800bar, -10°………..105
Figure 81: Jet-A 1000bar spray………...………...……105
Figure 83: Jet-A 1200bar spray………...………...…107
Figure 84: Jet-A 1200bar, -10°………108
. Figure 85: Jet-A 800bar, -5°………109
Figure 86: Jet-A 1000bar, -5°………..110
Figure 87: Jet-A 1200bar, -5°………..………111
Figure A1. Pressure Acquisition LabVIEW VI………119
CHAPTER 1: INTRODUC TION
With the current situation of rising pollution levels and global warming, emissions norms for locomotives and internal combustion engines in general, are being tightened and these strict emission norms have pushed for highly efficient engines, aiming to deliver maximum performance with minimum emissions and a carbon footprint. The solution to this has been sought in Diesel engines, known for their higher thermal efficiency and better reliability which takes care of the performance aspect. However, the downside to their operation involves higher NOx and particulate matter which must keep up with stricter EPA emission norms as can be seen in the graph below [1].
Diesel engines, which have long been popular in the heavy-duty transportation industry, are a great avenue worth exploring in the development of eco-friendly engines. It is however, very important to understand well the combustion process in an engine. Research has been carried out in this field for over a century, with many details however, that are still not fully understood. Attempts have been made to develop computational models to simulate the in-cylinder combustion process. These are limited however, by their ability to account for the unsteady and turbulent nature of combustion and often take a large amount of time and resources. Hence, to get quicker results and accuracy, experimental engines with optical access to the combustion chamber were designed in the 1930’s [2]. This was a powerful tool for researchers and enabled them to study the combustion process and visualize it in great detail.
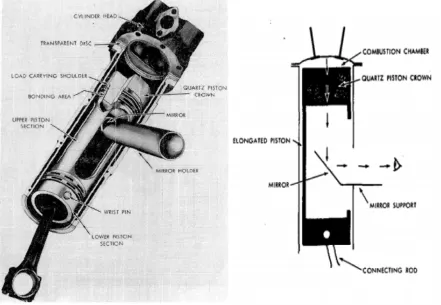
(a) Sectional View (b) Schematic of Working Principle
Figure 2: Bowditch Type Optical Engine
The original Bowditch editorial extensively discusses the various operating limitations and structural considerations of designing such an engine, most notable of which are window fouling due to lubricating oil and lower firing rate due to optical parts.
paper titled “Instantaneous Heat Transfer over the Piston of a Motored Direct-Injection Type Diesel Engine” that was published by a research group at Rutgers University in New Jersey in 1989 [3]. Through the use of 10 thermocouples, instantaneous heat flux data was gathered from 1/7th the surface of the piston at different engine speeds and intake pressures. In this study they concluded that while the instantaneous heat flux data could be used for building heat transfer prediction models, it could not be used so easily to verify heat transfer correlations with variation of location in a running engine.
The second publication was by the U.S. Army wherein the SCE-903 was used to evaluate the performance of several high temperature lubricants. This research was conducted over a period of three years until 1993 and was aimed at developing lubricants for use in future Low Heat Rejection (LHR) engines where the SCE-903 simulated an LHR engine. The report concluded that the test oil designated as ‘Oil D’ with certain specified properties had the best performance in terms of least degradation and wearing of parts after being tested for 200 hours and 275°C [4].
DMF(2,5-dimethylfuran) oxygenated biofuels blended in a 20% volume fraction , respectively. They also varied EGR from 0 to approx. 60%, covering both conventional and low temperature combustion and their results indicated that the use of bio-oxygenated blends generated predominantly blue flames in the earlier phases of combustion and reduced soot luminosity.
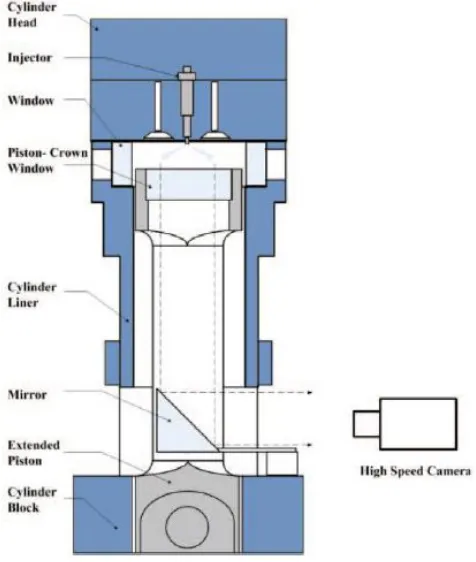
Figure 3: Tianjin University Optical Engine Set Up
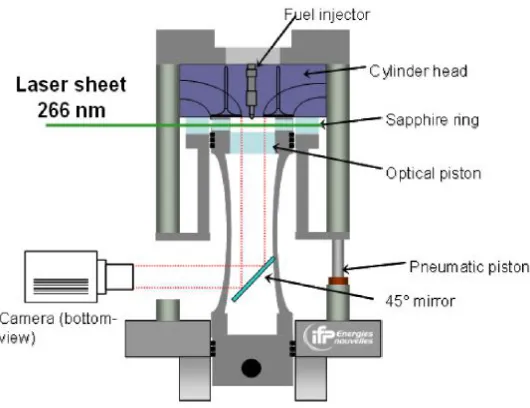
Al. conducted research on dual-fuel combustion strategies using Compressed Natural Gas (CNG) and Diesel fuel in the IFP optical engine in an attempt to reduce CO2 and conducted experiments for a wide range of equivalence ratios by supplying a premixed mixture of CNG, air and Nitrogen while performing direct injection of diesel surrogate fuel which is a high reactivity, low soot fuel blend. The study concluded that low equivalence ratio combustion started at the wall and progressed inwards to the central region which caused an increase in unburned hydrocarbons (UHC while higher equivalence ratios caused backward flame propagation starting in the near-wall region along with mixture mixing mechanisms that aided flame propagation was observed. Dronniou et. al. [6] inferred that such flame propagation mechanisms would greatly reduce and possibly eliminate knocking in dual-fuel engines with high compression ratios running at high loads.
Sandia National Laboratories’ Combustion Research Facility (CRF) in Livermore, CA uses a heavy duty optical engine designated N-14 which is similar to the SCE-903 in terms of capacity, for its optical engine research work. It was developed by Dr. Espey and Dr. Dec in 1993 and has been used in several research publications in the past two decades. The N-14 is a single-cylinder, direct injection, 4-stroke diesel engine and its specifications have been listed in Table 1 below in comparison to the SCE-903.
Table 1: Comparison of Geometrical Dimensions between N-14 and SCE-903 [7]
N-14 SCE-903
Engine Type 4-stroke, Single cylinder, DI Diesel
4-stroke, Single cylinder, DI Diesel
Stroke 152.4mm 121mm
Bore 139.7mm 139mm
Displacement 2.34L 1.83L
Compression Ratio 11:1 15:1
Number of Intake Valves 2 2
Number of Exhaust Valves 1* 2
The N-14 is based on a Cummins N-series heavy duty production engine modified to incorporate an optical access to the combustion chamber through multiple windows as seen in figure 5 below.
Some of the research work and optical diagnostic techniques employed at this facility have been discussed below.
A paper titled “Diesel Engine Combustion Studies in a newly designed Optical-Access Engine using High-Speed Visualization and 2D Laser Imaging” was published by Espey et. al. [7]. They used three optical techniques in this study, (a) Natural Flame High Speed Luminosity Imaging, (b) Laser Induced Incandescence Imaging (LII) and (c) Elastic (Mie) scattering. A reference study on diesel fuel at low load was conducted and it was observed that the first luminosity was observed at 5.3 CAD before TDC, shortly after SOI and coinciding with the start of premixed combustion. The last flame luminosity was observed at 28 CAD after TDC, coinciding with the end of computed apparent heat release. The combustion during this period was seen to occur in the squish region where the combustion fuel penetrated into. A similar phenomenon was also observed in the SCE-903.
tip. This enable the detection of low temperature first stage ignition (T-PLIF), high temperature second stage ignition (OH-PLIF) and soot formation consisting of poly aromatic hydrocarbon species (PAH-PLIF) respectively which characterizes the LTC combustion process. These imaging techniques were compared with the computational models of the jet-bowl and jet-jet interactions and were used to predict jet-jet-bowl interactions beyond the field of view for all three spray angles in an effort to understand their effects on UHC, CO and soot formation and oxidation [8]. The setup is show in Figure 6 below.
In June 2016, Dr. Musculus and his colleagues published his most recent article titled “Measurements of Liquid Length, Vapor Penetration, Ignition Delay and Flame Lift-Off Length for the Engine Combustion Network ‘Spray B’ in a 2.34L Heavy duty Optical Diesel Engine” in which Eagle et. al. [8] have conducted combustion and no-combustion optical diagnostics on a ‘Spray B’ fuel injector with three 90 micron holes. The injector was designed by the Engine Combustion Network (ECN) which is a consortium of universities, research laboratories and industrial partners [9, 10]. The four main metrics used to study the fuel injector behavior were Liquid Length, Vapor Penetration, Ignition Delay and Flame Lift-Off Length. Mie-scattering [11] was used to acquire data for liquid length and Schlieren diagnostics [8] were used to image vapor penetration as shown in Figure 7 below.
contaminants as a result of tar production in the reactor from the synthesized gas. The final stage involves the reaction of CO and H2 in the presence of an iron or cobalt catalyst to form Hydrocarbons that can be modified to meet specific fuel requirements like gasoline, diesel or jet fuel. Work done in reference (16) suggests the use of BTL in a CI engine results in overall lower emissions of HC, CO, NOx and PM but higher soot. BTL properties in comparison with those of other fuels are shown in Table 2.
Table 2: Comparison of BTL with other fuels [17]
same as fossil based diesel. They also estimated that BTL from sustainably managed forest biomass and woody waster may have lower environmental impact than fossil diesel.
renewable resources and has better properties (physical, chemical engine performance and emission) than conventional fossil diesel; the use of BTL enables appreciable reductions in NOx, PM, HC and CO emissions without substantial changes to the engine or its control.
hence, a less dense fuel will result in less fuel mass being injected into the cylinder. This affects the amount of fuel available for the start of combustion and the premixed burn phase, subsequently altering the combustion behavior [35]. In addition to a variable cetane rating and lower density, JP-8’s higher volatility acts to increase evaporation following injection, leading to changes in mixing and combustion behavior. However, Murphy and Rothamer, in separate works using a single-cylinder compression ignition (CI) engine with both ULSD and jet fuel blends, found that the influence of volatility on combustion, particularly during the premixed burn phase, is negligible [28, 29]. Moreover, jet propellant also has lower fuel viscosity, which will improve the effectiveness of the injector through improved atomization and act to advance combustion. Therefore, in comparison to ULSD, JP-8 (and Jet-A via its similar nature) can have either a shorter ignition delay due to a higher cetane number and lower viscosity (and possibly owing to a higher volatility), or, in the case of mechanically actuated fuel systems, a longer ignition delay because of its lower density and bulk modulus of compressibility. Since both JP-8 and Jet-A are derived from petroleum crude oil, there has been significant investigation into sustainable jet fuels that can be produced through renewable sources.
CHAPTER 2: EXPERIMENTAL SETUP 2.1. Cummins SCE-903
A Cummins VTA-903T commercial diesel engine used in marine applications was modified for research purposes by the U.S. Army and designated the SCE-903. The original block was a turbo-charged V8 where 6 of the 8 cylinders were cut off and one of the remaining two was used as the firing cylinder with optical access while the other cylinder was mainly for inertial balance. An accurate description of the modifications was documented by the U.S. Army [4] as follows:
“The SCE-903 block consists of Cylinder Nos. 7 and 8 separated from an 8-cylinder block at the midplane of Cylinder No. 5. This configuration allows for two main bearing webs, two camshaft bearing webs, the rear-mounted camshaft gear train, rear engine cover, flywheel, and flywheel housing to remain. The front of the engine is closed off with 16-mm (0.625-in.) steel plate fastened to the cylinder block with socket head cap screws.”
Table 3: SCE-903 Engine Specifications
Engine Type Single cylinder, Direct Injection Diesel
Stroke 121mm
Bore 139mm
Displacement 1.83L
Compression Ratio 15:1
Connecting Rod Length 208.1mm
Crank Arm Radius 61.5mm
The following is a picture of the entire SCE-903 optical test bed.
2.2 Optical Access
To allow researchers with optical access to the combustion chamber, further modifications were made to the firing piston of the SCE-903 by a former SCE-903 researcher, Aaron McCullough, as part of his thesis and have been described in detail there [38]. A brief summary of these modifications as well as some improvements made during the process of this thesis have been discussed below.
2.2.1 Mirror
A mirror with a 45° slant was designed and fixed in the optical access region. The mirror is held in place by two socket cap screws and can be easily removed when the optical window needs to be cleaned or replaced with an aluminum piston.
Figure 9: Mirror used for Optical Access in SCE-903 2.2.2 Optical Insert
from a circular quartz insert mounted in a stainless steel retaining cup as shown in Figure 10 below.
Figure 10: Optical Insert Assembly
the quartz insert in place to prevent it from being thrown out by inertial forces during the downward motion of the piston away from TDC. The diameter chosen for this insert was 2.5in and the stress analysis results have been discussed in detail in reference 38. This optical window was used for the experiments conducted during this thesis.
Figure 11: Exploded View of Quartz Window Assembly
the width of the window and about 96% increase in visible area of window access. This design could be considered in the future for a better view of the squish region.
calculate the path of the light ray through the window and the angle at which it should emerge. After several trials, it was decided that a window with a thickness of 26mm, a depth of curvature of 5mm, inner curved surface diameter of 56.04mm and outer diameter of 78mm would give the best possible compromise between optical access and the strength requirements of the insert. The following are images of the Solidworks model of the window and its dimensions.
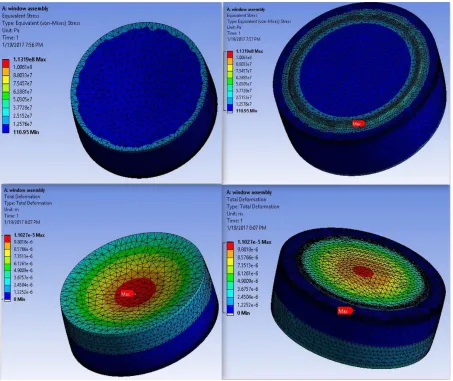
The following are some images of the ANSYS FEA results of the Von Mises stresses occurring in the window as this gives us the equivalent stress occurring across the window. A characteristic length of 1mm was used for the elements in the mesh with a highly refined mesh around the bottom surface edges of the window (seated on the copper ring and stainless steel holder) as maximum stress concentration was expected here during combustion. The pressure of 10MPa was applied as a ramped load to the top surface of the window.
The top two pictures show the Von Mises stress induced on the top and bottorm surfaces (left and right images respectively) while the bottom depicts the deformation. The points of maximum stress concentration and deformation have been marked in the pictures. A maximum stress of about 16MPa was found at the marked places, which is well within the compressive and tensile strength limits of quartz which are 1100 and 48MPa respectively.
Although the design for this window was prepared during the thesis, fabrication and utilization of this design was not possible for the experiments presented in this thesis due to time constraints in procuring a new optical window assembly. It can be used however in future research work on the SCE-903 and possibly even repetition of the experiments already conducted to further validate the findings of this thesis and to obtain a better view of the combustion process. Another material that could also be considered in Plexiglas which has been used extensively in research conducted in reference 46.
2.2.3 Extended Piston
Figure 14: Extended Piston Assembly 2.3 Powertrain
2.3.1 Driver Engine
powered by a 12V battery. Figure 15 below shows the driver engine used for the experiments.
. Figure 15: Powermart Driver Engine
2.3.2 Speed Reducer and Coupling
its torque and power is produced at RPMs closer to 2200 versus the 600rpm needed to rotate the test engine. The speed reducer assembly, along with the couplings used is shown in Figure 16 below.
Figure 16: Speed Reducer and Couplings
which is a general use type sleeve but with a high operating temperature range from -46°C to 135°C and more importantly, a torsional flexibility of 15° which is useful to withstand to opposing torques produced particularly while starting and stopping the engine. The output shaft of the speed reducer is coupled to the optical engine using a heavy duty Spider Hytrel type coupling which is excellent for very high torque applications. These types of couplings are capable of transmitting approximately four times as much torque as an equivalent TPR sleeve. They have a slightly wider operating temperature range from -54°C to 121°C but a slightly lower torsional flexibility of 7° due to its more rigid build. The above mentioned couplings are suitable for conditions involving high opposing torques and frequent start/stop operation. The muff coupling as mentioned earlier couples the output shaft of the speed reducer to the Spider Hytrel coupling.
2.4 Lubrication and Cooling Systems
Rotella 15W-40. The oil is supplied at 70psig pressure via a 2HP Daytona rotary gear pump. The liquid level switch drives the sump pump intermittently to ensure that the oil level in the reservoir as well as the engine oil pan is maintained at a preset level.
The coolant system is also a closed loop heated system that circulates a standard 50% coolant, 50% distilled water mixture and heated to 180°F. It consists of a 7 gallon coolant reservoir, a 1000W electric immersion heater and a 0.5HP WEG rotary pump like the lubrication system. Figures 17 [40] and 18 show a schematic and picture of the systems respectively.
Figure 18: Lubrication and Cooling Systems 2.5 Exhaust System
Figure 19: Driver Engine Exhaust System
2.6 Intake System
A commercially available aftermarket intake manifold with a conical air filter was fitted on to the SCE-903 and a custom aluminum mounting plate was designed to adapt the manifold assembly to the SCE-903 intake port. Also, a commercially available Manifold Absolute Pressure (MAP) sensor was fitted to the intake system to get an accurate measure of the pressure during intake stroke. The MAP sensor is capable of measuring up to 3 bar absolute pressure and would be useful to measure turbocharged intake pressures in the future. Figures 21 and 22 below show the intake assembly and the MAP sensor respectively while the calibration for the MAP sensor can be found in reference 40.
Figure 22: MAP Sensor
2.7 Fuel System
2.7.1 Mechanical Components of Fuel System
the SCE-903 fuel system and Table 4 contains the technical specifications of the fuel system components.
Figure 23: Schematic of SCE-903 Fuel System [40]
(a) (b)
(c) (d)
(e)
Figure 25: SCE-903 Fuel Injector Assembly
The SCE-903 could also be used to test gasoline fuels and blends due to its high compression ratio and for this purpose, a BMW gasoline injector was acquired for future research work. A special adapter and holder were designed for this purpose and can be seen figure 26 above.
2.7.2 Fuel Pressure Control System
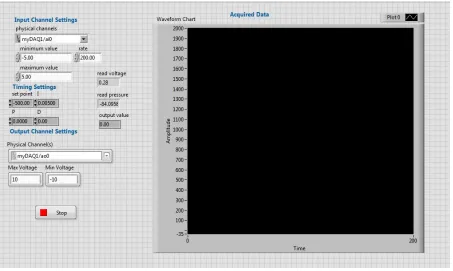
As mentioned earlier, the fuel system of the SCE-903 needed to be capable of controlling the fuel rail pressure, injection timing and the injection duration and these are all the variables that can be controlled and tested for in experiments. The fuel pressure is controlled using a National Instruments myDAQ controller and a fuel rail pressure sensor. A virtual PID (Proportional-Integral-Derivative) control loop built in LabVIEW called a VI (Virtual Instrument) is used to set and regulate the fuel pressure.
Figure 27: Fuel Pressure Control VI Front Panel
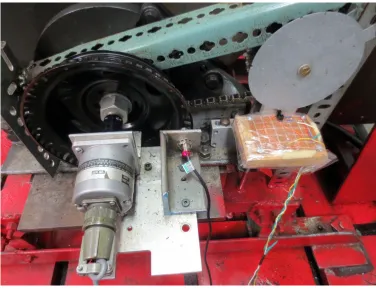
2.8 Shaft Encoder and Exhaust TDC Signal
generates a signal that indicates the exhaust TDC position of the crankshaft. This signal is used in an AND logic gate along with the Z signal of the encoder and the output of the AND operation gives the exhaust TDC signal once every two revolutions of the crankshaft. Figure 27 below shows the shaft encoder and the optical switch.
Figure 28: Shaft Encoder, Speed Sensor and Optical Switch
Figure 29: Optical Switch and Circuit
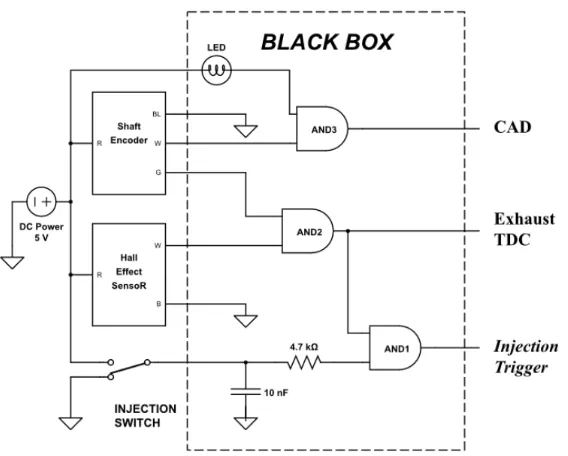
The circuit diagram for the CAD, ETDC and Injection Trigger signal can be seen in Figure 30 [40] below.
The above combined operation of the two signals is a very precise method of obtaining the Exhaust TDC position information and reduces the possibility of any errors with respect to the detection of its location. A complete combustion cycle starts from the ETDC which is used as a reference point to begin at zero CAD. Compression TDC appears at 360° from this point. The injection trigger from the circuit box and the ETDC signal essentially occur at the same time. After the injection trigger is received by a LabVIEW program that controls timing of injection , an injection signal is output at the chosen time during the compression stroke. The injection signal is generated right before the compression TDC and has been set to 5° and 10° for experiments in this thesis.
2.9 Fuel Injection Control
the counter is low (0V) during the initial delay period and high (5V) for the set number of CAD. The duration of the injection could also have been controlled using the injection VI, however, its duration would have to be in terms of CAD and not time, as with the pulse generator. Setting the duration in terms of CAD would be a problem as the calibration for the amount of fuel with different injection pressures and different fuels would prove very difficult and so it was decided that using time in seconds would be the simplest and most accurate approach. The pulse generator sends a pulse to the injector and keeps the pulse high for the injection duration needed. The schematic for this injection control circuit is given in Figure 31 below.
The quantity of fuel injection chosen for all the different fuels and for all experiments was chosen to be 46mg. The injection is controlled by the experimenter with the help of the injection VI. The VI should be run when injection is need and stopped immediately after 2-3 combustions have taken place. A gap of 10 motoring cycles which is approximately 2 seconds at 600rpm is kept between each injection to prevent overheating of the quartz window. Figure 32 below shows the front panel of the injection VI. So for example, to set the injection to 10° BTDC, we would need to set the initial delay and low time to 700 which means the counter pulse is kept low for 700 pulses of the encoder. For an encoder with 0.5CAD resolution, that means 350°. The high time specifies the number of CAD to maintain the output pulse high. This value can range anywhere from 1 to 709 and does not really matter as the pulse generator detects the rising edge of the first pulse and triggers injection.
2.10 In-Cylinder Pressure Data Acquisition System
The in-cylinder pressure is measured using a Kistler 6067B water cooled piezoelectric pressure transducer. It is mounted using a sleeve in a specially drilled access hole in the cylinder head. The pressure sensor can be seen in Figure 33 below.
Figure 33: Kistler 6067B Pressure Sensor
of 20 bars per volt. The output from the charge amplifier is then sent to an NI (National Instruments) PCI-MIO-16E-4 DAQ(Data Acquisition) card also called as 6040E, which reads the values through an NI 2110 BNC connector block and processes the pressure values with the help of a Pressure Acquisition VI. This VI then outputs one pressure value for each corresponding CAD and saves it to a file. It does this at a rate of 8000Hz.
Figure 34: Pressure Data Acquisition VI Front Panel
2.11 High Speed Camera Setup
A Phantom v4.3 high speed camera capable of recording up to 90,000 frames per second was used to record videos for combustion during experiments. A Nikon 105mm zoom lens with built in UV filters was used with an aperture of 11. The exposure was set to around 8 for combustion videos and 27 for spray image videos which were recorded using a focus lamp to illuminate the combustion chamber. The camera recording is synchronized with fuel injection and is triggered by the same injection signal sent out to the injector by the pulse generator. The schematic for the camera setup and a picture of the camera used for experimentation can be seen in Figures 35 and 36 below.
Figure 36: Nikon High Speed Camera
Figure 37: Time Stamp VI Front Panel
2.12 Speed Sensor
CHAPTER 3: METHODS AND EXPERIMENTAL PROCEDURE
3.1 Experimental Procedure
This chapter discusses the experimental procedures developed and employed in this thesis. The SCE-903 is a large and complex system with numerous sub-systems and as such, it is important to have an idea about the methods, safety precautions and experimental procedures used during this research. In this chapter, we discuss the fuel calibration and injection testing procedures, engine operating procedures and operating conditions. Three types of combustion data are acquired during the experiments: (a) In-cylinder pressure data, (b) Natural luminosity combustion flame images and (c) Spray combustion images. The natural luminosity combustion images are performed without a focus lamp to provide any sort of illumination and rely solely on the luminosity of the combustion to record images, while the spray combustion images are performed with a focus lamp and a higher exposure time to allow more light to be taken in and prevent saturation of the images. As the name suggests, in spray combustion images, the fuel injection can also be seen which is not visible in natural luminosity combustion images.
efficiency. The injection timings for each of the three fuels and for all three injection pressures, is given in Table 4 below.
Table 4: Fuel Injector Calibration
Fuel
Fuel Pressure(Bar)
Injection Duration
Weight of fuel per injection (mg)
Time (ms)
CAD @600rpm
Diesel 800 1.14 4.104 46.29
1000 1 3.6 46.26
1200 0.905 3.258 46.22
BTL 800 1.155 4.158 46.64
1000 1.015 3.654 46.69
1200 0.92 3.313 46.67
Jet-A 800 1.15 4.140 46.76
1000 1.01 3.636 46.80
1200 0.915 3.294 46.78
in-cylinder pressure and fuel injection pressure were monitored and digitally recorded during the experiments. The in-cylinder pressure measurements were recorded at 0.5 CAD increments and averaged over 20 combustion cycles. The exact steps used to conduct the experiments have been documented in detail in Appendix A of this thesis.
Experimental Procedure for Combustion Flame Imaging
The combustion images were recorded with the help of the high speed Phantom Camera described earlier with a 105mm lens. A sampling rate of 5400 fps (frames per second) was selected with an aperture of 11. Exposure times were set to 8µs for natural luminosity combustion images and 27µs for the spray combustion images. The resolution was set to 320x312 pixels as it was seen to yield the best combustion images throughout the piston stroke. The chosen engine speed of 600rpm and the selected frame rate of 5400fps give us approximately 1.5 frames for every 2CAD interval. For each test case, at least two trials were recorded for data accuracy. As explained earlier, the high speed camera recording is synchronized by triggering both fuel injection and the camera at the same time via the pulse generator so every combustion video begins from SOI.
3.2 Data Analysis
3.2.1 Cylinder Volume Measurement
The in-cylinder volume is calculated using the engine geometry and known CAD. The clearance volume (Vc) of the SCE-903 cylinder was physically measured and found to be 128.57cc. The formula used to calculate the instantaneous cylinder volume was derived using the slider-crank mechanism and the volume at any crank angle (θ) is given by [35]:
= 1 + ( − 1) × [ + 1 − − ( − ) / ] …………Equation 1
Where R is the ratio of the connecting rod length to the crank radius V is the volume at crank angle
VC is the clearance volume rc is the compression ratio
3.4.2 In-cylinder Pressure Data Analysis Pressure Pegging
1. Referencing in-cylinder pressure measurements at intake BDC: In this
method, the in-cylinder pressure measurements at fixed CAD near IBDC are equated with intake MAP (Manifold Absolute Pressure) [42].
2. Fitting a polytropic compression index to the in-cylinder compression
pressure measurement: This is a simple and commonly used method but the selection of a proper and suitable polytropic compression index can prove to be a challenge. 3. Using another pressure transducer lower in the cylinder to reference the piezoelectric pressure transducer: This method while being more accurate has severe limitations for practical application. Installing a second pressure transducer near BDC in the cylinder can prove to be difficult, expensive and time consuming.
The first method is the simplest and is known to give accurate results at low speeds and part loads. Since the engine RPM chosen for the experiments in this thesis is low i.e. 600RPM, this method was deemed suitable for the results obtained and the data was pegged by referencing in-cylinder pressure over the intake stroke with intake MAP.
The pressure correction formula used for each and every data point is given by = − …………..Equation 2 Where,
= −
This corrected pressure data is further smoothened using a seven point average across all the 1440 data points and then analyzed on a pressure versus crank angle plot.
Indicated Mean Effective Pressure (IMEP)
The indicated mean effective pressure is a relative engine metric which gives us a quantitative measure of the engines ability to perform work and is independent of the engine size. Excel calculates the IMEP using the following formula:
= ∆ ∑ × …………..Equation 3
Where Vs is the swept volume, P is the in-cylinder pressure and dV is the instantaneous change in volume. This equation gives us the gross IMEP when equated across the 4-stroke cycle and pumping imep in the intake and exhaust stroke range [43].
Ignition Delay
Heat Release Rate
Heat release rate is an important parameter in analyzing the combustion characteristics of fuel and can be used to find the ignition delay of the fuel. The combustion chamber of a direct injection compression ignition engine such as the SCE-903 can be modeled as a single open system with only mass flow of fuel across the system boundary assuming intake and exhaust valves are completely closed. Applying the first law of thermodynamics to this system, the following equation for apparent net heat release rate is used [35]:
= × + ………..Equation 4
Where Qn is the apparent net heat release rate in Joules per degree, P is the in-cylinder pressure in Pascals, V is the in-cylinder volume in cubic meters and γ is the ratio of specific heats taken to be 1.325.
This equation computes the amount of heat added by the fuel which produced the measured pressure variations. It is based on the following assumptions:
Contents of the cylinder can be modeled as an ideal gas and R is assumed
constant.
Sensible enthalpy of the injected fuel is negligible.
The mixture is assumed to be uniform across the combustion chamber. γ is the specific heat of combustion gases and is assumed to be a mean value
Also, since the engine is operated in skip fire mode, the heat transfer losses and crevice flow losses are estimated to be similar for all cases until the point of significant heat release during the combustion process. The heat release rate curves are utilized for a comparative analysis during the experiments conducted and so, small errors of less than 1 Joule per CAD due to crevice flows will not change the conclusions of the thesis and hence will be excluded.
The above net heat release equation can be used to closely approximate the cumulative heat release by integrating the net heat release rate over the complete combustion process as follows:
= ∫ ………….Equation 5
Where Qc is the cumulative heat release by the fuel during combustion, θstart is the start of fuel injection in CAD and θ is the end of power stroke in CAD.
In the future, heat transfer models [35] could be used to obtain more accurate estimates of the gross heat released over the complete combustion process. However, the conclusions of this thesis should not be affected significantly since the heat transfer losses are excluded during heat release approximations and so the relative errors involved in calculations will be negligible.
Natural Luminosity Combustion Flame Imaging and Analysis
CHAPTER 4: RESULTS AND DISCUSSION
The following are the properties for all the three fuels tested. Table 5: Fuel Properties [44, 45]
Properties Diesel BTL Jet-A
Energy
Content(LHV) MJ/kg
43.1 43.9 43.2
HHV in MJ/kg 45.3 - 44.73
Flashpoint °C 74 - -
Auto Ignition Temperature °C
315 - -
Dynamic Viscosity
(Pa.S) at 25°C 1.99 2.0976 -
Density (kg/L) 0.832 0.762 0.790
Cetane Number 43 56 46
Surface Tension (mN/m) at 25°C
4.1 Diesel Testing
4.1.1 In-Cylinder Pressure Calculated Results
As described earlier, an engine speed of 600 rpm was chosen for all experiments. The calibrated injection quantities have been listed in the previous chapter. For the Diesel fuel experiments, Ultra-Low Sulfur Diesel was used and it’s properties are as mentioned in the table above.
In-Cylinder Pressure
influenced by the injection pressure. In the graph, we can see that for the 10° advance case, the peak pressure for the 1200bar case is 4.58MPa, 1000bar is 4.56Mpa and the 800bar cases is 4.5MPa. For the 5° advance cases on the other hand, the peak pressures are found to be 3.65MPa, 3.59MPa and 3.34MPa for the 1200bar, 1000bar and 800bar injection pressures respectively. From these results we can conclude that the higher the injection pressure, the higher is the peak combustion pressure. Also, with rise in injection pressure, we can say the peak pressure can also be expected to be seen earlier.
Cumulative Heat Release Rate
Net Heat Release Rate
In Figure 41, the Net Heat Release graph for all six cases, have been plotted. Here we see that the heat release values are mostly similar for each injection advance case except for the 800bar, -10° case which has a slightly higher value than the other injection pressures. It can also been seen that heat release peak values occur earlier for the higher injection pressures which can be expected as this could be directly affected by which case achieves its peak combustion pressures earlier. Hence, all the 10° cases have higher heat release values than the 5° cases.
Burning Efficiency
The burning efficiency for each of the six cases has been plotted in Figure 42 and it shows the efficiencies to decreases in increasing order of injection pressure. This can be expected bases on the results of the Cumulative Heat Release graph. Also, it can be seen that the efficiencies, injection pressure for injection pressure, are higher for the 5° advance cases than the 10° cases.
P-V Diagram
IMEP Variation
The IMEP values and the variations for all six cases can be seen in Figure 44. For each injection advance case, the highest IMEP was noted for the 800bar case, followed by the 1000bar and then 1200bar cases. Also, the IMEP for each respective injection pressure was found to be higher for the 10° advance case. The standard deviation for the 800bar, -10° case was the highest while the 800bar, -5° was the lowest. For all other cases, the deviation was almost the same.
Ignition Delay
Figure 39: Diesel In-Cylinder Pressure
Figure 41: Diesel Apparent Heat Release Rate
Figure 43: Diesel PV Diagram
Figure 45: Diesel Ignition Delay
4.1.2 Combustion and Spray Images
but recorded in a different run. Care was taken to match only those images from combustions with similar characteristics like pressure, ignition delay and amount of time that combustion is visible. All videos were recorded using an f/11 aperture and the exposure was varied and is mentioned before each fuel. The natural luminosity images were color-mapped using MATLAB in which the lowest luminosity of 0 is depicted in blue and the highest 255 is depicted in red. An illustrative image of the spray injection is show in Figure 46 below to get an idea of the access to the combustion chamber. The circular prints at the corners of the intake and exhaust valves.
Figure 46: Fuel Injection Spray Image
had their flames visible before the others. Each of the cases has their luminosity visible after approximately 1012CAD after their respective ignition delays. So for example, 1000bar, -10° which has an ignition delay of 11.5CAD has its first luminosity seen 10CAD after SOC (Start of Combustion) and 21.5CAD after SOI. Also, it is observed that the 5° advance cases all had much shorter combustion durations , usually in the range of 30-50CAD whereas the 10° cases had a range from about 60-90CAD which is due to the stronger combustion resulting from the earlier ignition time. The images are spread out evenly over 4 and sometimes 2CAD depending on the flame strength with only the last few images skipped in larger intervals to show the end of combustion. The first image is that of first luminosity seen and the last image is that of the absolute last luminosity seen. Spray images for each injection pressure have been displayed with the number at the top right corner indicating CAD after injection at which fully developed spray pattern was observed.
Figure 47: Diesel 800bar spray
Figure 49: Diesel 1000bar spray
Figure 51: Diesel 1200bar spray
4.2 BTL Testing
4.2.1 Pressure Calculated Data In-Cylinder Pressure
As can been seen in Figure 53, the in-cylinder pressure is observed to be slightly higher for the -10° cases but not by as much of a difference as with Diesel. This could be attributed to the higher cetane number of BTL as compared to Diesel and also it’s higher energy value. The peak pressures however do not follow the same pattern as with diesel. For the 5° advance cases, the highest peak pressure is seen for the 1000bar cases, followed by 1200bar and then 800bar whereas it is somewhat inverted for the -10° case where the highest peak was seen in the 1200bar case, followed by the 800bar case, with 1000bar having the minimum value this time. Also as seen before, the peak pressures occur earlier for the more advance injection angles.
Cumulative Heat Release Rate (CHRR)
case where the 1200bar injection pressure with the highest combustion peak pressure, has the highest CHRR while 800 and 1000bar have very similar values and are almost identical.
Net Heat Release Rate (NHRR)
In figure 55 with the NHRR values for all the cases, we can see that the -10° have the higher heat release values with 1000bar having the highest value followed by the 800 and 1000bar cases which are almost identical. This is in direct correlating with the peak in-cylinder combustion pressures seen. For the 5° cases, the values seem near identical since their combustion pressures are quite close to one another. Also, the order in which the peak heat release values seen is with decreasing injection pressure of the 5° cases, i.e. peak values is seen first for highest injection pressure and last for lowest, and with increasing injection pressure for the 10° cases.
Burning Efficiency
In figure 56 we see that the burning efficiency is highest for the 800bar, -5° case followed by the 1200bar, -10°. This is in direct correlation seen with the CHRR graph in figure 54. The rest of the combustion efficiencies are quite similar.
P-V Diagram
injection advance cases as opposed to diesel where there was a much more visible difference. The relationship between the combustion pressures and injection advance is still maintained in that more injection advance results in higher combustion peak pressures.
IMEP Variations
In figure 58 we observed that the 800bar, -5° and 1200bar,-10° cases have the highest IMEP
values and is again very similar to the earlier observations seen the CHRR and burning efficiency charts. Also, the standard deviation was found to be the highest for the 800bar, -10° case and lowest for the 1000bar, --10° case.
Ignition Delay
Figure 56: BTL In-Cylinder Pressure
Figure 58: BTL Apparent Heat Release Rate
Figure 60: BTL P-V Diagram
Figure 62: BTL Ignition Delay
4.2.2 BTL Combustion and Spray Images
Figure 63: BTL 800bar spray
Figure 64: BTL 800bar, -10°
Figure 65: BTL 1000bar spray
Figure 67: BTL 1200bar spray
Figure 69: BTL 800bar, -5°
Figure 71: BTL 1200bar, -5°
4.3 Jet-A Testing
4.3.1 Pressure Calculated Data In-Cylinder Pressure
occurs for both injection advance cases except for the 1000bar, -10° case which has its peak occurring slightly later than the other two injection pressures.
Cumulative Heat Release Rate (CHRR)
As expected, from figure 68 we see that the CHRR curve rises earlier for the 10° case and the values seem in a close range of about 1100 to 1300 J/deg. For this advance injection case, the highest heat release value is seen for the 800bar injection pressure followed by 1000bar and lastly 1200bar. For the 5° case however, 1000bar had the highest value and by a significant amount, nearing 1500J/deg, followed by the 800bar case and then 1200 bar. The pattern here is similar to the in-cylinder pressure seen.
Net Heat Release Rate
Burning Efficiency
Overall, a general trend of increasing burning efficiency with decreasing injection pressures can be seen in figure 70 with 1000bar, -5° being the only exception and in fact having the highest efficiency. Also, it seem that the burning efficiency for the 5° is higher for each injection pressure with the exception of 800bar which is higher for the 10° case.
P-V Diagram
As can be observed in figure 71, the P-V diagram shows a significant difference between the 5° and 10° cases owing to the significant difference in peak combustion pressures for the two cases.
IMEP Variation
Ignition Delay
The ignition delay is found to be longer as usual for the 5° cases with 1000bar being the only exception as seen in figure 73. Also, unlike earlier cases, there seems to be no fixed relationship between the injection pressure and ignition delay. For the 10° case it can be seen that 1200bar has the shortest ignition delay followed by 800bar and then 1000bar. For the 10° case on the other hand, the 1000bar case has the shortest ignition delay followed by the 1200 bar case and then 800bar.
Figure 73: Jet-A Cumulative Heat Release Rate
Figure 75: Jet-A P-V Diagram
Figure 77: Jet-A IMEP Variations
4.3.2 Combustion and Spray Images
luminosity seen is at 14, 12 and 13CAD ATDC, again 1200bar being the exception to this pattern. Also, it can be seen that the flames perpetuate longer for the 10° cases with a range of 60-90CAD ATDC than the 5° cases which range from 20-40CAD ATDC.
Figure 79: Jet-A 800bar spray
Figure 80: Jet-A 800bar, -10°
Figure 81: Jet-A 1000bar spray
Figure 83: Jet-A 1200bar spray
Figure 86: Jet-A 1000bar, -5°
CONCLUSION
Experiments were conducted on three different fuels: Diesel, BTL and Jet-A. The impact of injection advance and injection pressure was tested on each fuel and in-cylinder pressure and high speed combustion images were recorded for each case. Injection advance was set to 10CAD and 5CAD before TDC and for each case of injection advance, three subcases with injection pressures of 800bar, 1000bar and 1200bar were tested. The observations made were as follows:
1. For diesel fuel, an overall pattern of higher combustion pressure attained for the 10° injection advance case was seen as compared to 5°. Also, a linear pattern of increasing combustion pressures with increasing injection pressures was seen. The burning efficiency followed a reverse trend where 5° cases had better efficiency than the 10° cases and for each advance case, the burning efficiency increased with decreasing injection pressure. It is also worth noting that the 800bar, -10° cases had the highest cumulative heat release value and burning efficiency and was very closely followed by the 800bar, -5° case, while 1200bar, -10° had the lowest heat release and burning efficiency. This suggests that lower injection pressures and less injection advance could produce more efficient combustion in CI engines for diesel fuel. The IMEP also followed a similar trend.
conducting of experiments that BTL took slightly longer to reach its peak combustion values for each respective case. The burning efficiencies for the 5° cases were lower than the 10° cases in contrast to diesel with 800bar, -5° being the only exception and in fact, having the highest combustion efficiency and heat release value. Hence it can be concluded again that a lower injection advance and lower injection pressure could be advantageous in producing more efficient combustion and hence, less emissions. 3. For Jet-A, the trend was again similar to diesel in that the 10° injection advance cases
had significantly higher combustion pressure than 5° cases. Also, the burning efficiencies for the 5° cases were generally seen to be higher than the 10° cases and is similar to that observed in the previous fuels, with 800bar, -10° being the only exception. Also, for each injection advance case it was seen that the burning efficiency increased with decreasing injection pressure with 1000bar, -5° being the only exception and in fact, having the highest efficiency. Thus it can again be concluded that the use of less injection advance and lower injection pressures could lead to more efficient combustion of fuel.
It can also be concluded that both, BTL and Jet-A could be used as suitable replacements for diesel fuel with BTL having the advantage of higher energy content and being renewable, while Jet-A could be advantageous to the army which is adopting a single fuel implementation.
REFERENCES
1. U. S. Environmental Protection Agency, Heavy-duty Diesel Engine Emission Standards, http://www.dieselforum.org/about-clean-diesel/port-and-marine. [Accessed July 2017]
2. Bowditch F. W., "A New Tool for Combustion Research a Quartz Piston Engine," SAE Technical Papers, no. 610002, 1961.
3. Mure C. R. and Rhee K. T., "Instantaneous Heat Transfer over the Piston of a Motored Direct Injection-Type Diesel Engine," SAE Technical Paper 163 - 179, 1989.
4. Lacey P. I., Frame E. I., and Yost D. M., “Bench Wear and Single Cylinder Engine Evaluations of High Temperature Lubricants for U.S. Army Ground Vehicles”, San Antonio: United States Army, 1994.
5. Liu, Haifeng, Zunquing Zheng, and Mungfa Yao. "Effects of Fuel Physical and Chemical Properties on Combustion and Emissions on both Metal and Optical Diesel Engines and on a Partially Premixed Burner." SAE International, SAE 2015-01-1918, 2015
6. Dronniou, N., Kashdan, J., Lecointe, B., Sauve, K. et al., "Optical Investigation of Dual-fuel CNG/Diesel Combustion Strategies to Reduce CO2 Emissions," SAE Int. J. Engines
7(2):2014, doi:10.4271/2014-01-1313.H
7. Espey C. and Dec J. E., "Diesel Engine Combustion Studies in a Newly Designed Optical-Access Engine Using High-Speed Visualization and 2-D Laser Imaging," SAE International, pp. 930971, 1993.
8. Eagle, W., Malbec, L., and Musculus, M., "Measurements of Liquid Length, Vapor Penetration, Ignition Delay, and Flame Lift-Off Length for the Engine Combustion Network ‘Spray B’ in a 2.34 L Heavy-Duty Optical Diesel Engine," SAE Int. Journal of Engines 9(2):2016, doi:10.4271/2016-01-0743.
9. Sandia National Laboratories, Engine Combustion Network Database,
http://www.ca.sandia.gov/ecn , 2015. [Accessed July 2017]
10. Sandia Engine Combustion Network, Spray B Target Conditions, http:// www.sandia.gov/ecn/cvdata/targetCondition/SpBNozGeo.php. [Accessed July 2017 ]
11. Maghbouli, A., Lucchini, T., D'Errico, G., Onorati, A. et al., "Parametric Comparison of Well-mixed and Flamelet n-dodecane Spray Combustion with Engine Experiments at Well Controlled Boundary Conditions," SAE Technical Paper 2016-01-0577, 2016
Manage 2015;95:342–51.
13. G. Knothe, J. Van Gerpen, J. Krahl, The biodiesel handbook. Champaign, Illinois. AOCS Press 2005.
14. A.K. Agarwal, Biofuels (alcohols and biodiesel) applications as fuels for internal combustion engines. Progress in Energy and Combustion science 33 (2007) 233-271.
15. Olav A. Opdal, Oyvind Skreiberg. Production of synthetic biodiesel via Fischer-Tropsch synthesis. Zero Emission Resource Organization. 2006
16. Henry Ng, Munidhar Biruduganti, Kevin Stork. Comparing the Performance of
SunDiesel and Conventionl Diesel in a Light-Duty Vehicle and a Heavy-Duty Vehicle. SAE 2005-01-3776.
17. Rantanen L, Linnalia R, Aakko P, Harju T. NExBTL-biodiesel fuel of the second generation. SAE paper 2005–01-3771; 2005.
18. Sunde, K. Brekke A, B. Solberg. Environmental impacts and costs of woody Biomass-to Liquid (BTL) production and use- A review. Forest Policy and Economics 12 (2011) 591- 602
19. Moon, G, Y. Lee, K. Choi, D. Jeong. Emission Characteristics of diesel, gas to liquid and biodiesel-blended fuels in a diesel engine for passenger cars. Fuel 89 (2010) 3840-3846
20. Li, X, Z. Huang. Emission reduction potential of using gas –to-liquid and diemethyl ether fuels on a turbocharged diesel engine. Science of The Total Environment 407 (2009) 2234-2244
21. Abu-Jrai, A, J.R. Fernandez, A. Tsolakis, A. Megaritis, K. Theinnoi, R. F. Cracknell, R.H. Clark. Performance, combustion and emissions of a diesel engine operated with reformed EGR, Comparison of diesel and GTL fuelling. Fuel 88 (2009) 1031-1041 22. Abu-Jrai, A, A. Tsolakis, K. Theinnoi, R. Cracknell, A. Megaritis, M.L.Wyszynski and
S.E. Golunski. Effect of Gas-to –Liquid Diesel Fuels on Combustion Characteristics, Engine Emissions, and Exhaust Gas fuel Reforming. Comparative Study. Energy & Fuels 2006, 20, 2377-2384.
23. Clark, N, M. Gautam, D. Lyons, C. Atkinson and W. Xie. On-Road Used of Fischer- Tropsch Diesel Blends SAE paper 1999-01-2251