(Under the direction of Dr. Tiegang Fang).
by
Uddhava Anil Jawalkar
A thesis submitted to the Graduate Faculty of North Carolina State University
in partial fulfillment of the requirements for the degree of
Master of Science
Mechanical Engineering
Raleigh, North Carolina 2016
APPROVED BY:
____________________________ Dr. Tiegang Fang
Chair of Advisory Committee
_______________________________ _______________________________
Dr. Richard Gould Dr. Stephen Terry
DEDICATION
BIOGRAPHY
ACKNOWLEDGMENTS
I would like to express my gratitude towards my adviser Dr. Tiegang Fang for giving me this great opportunity to work on an optical engine, and for his words of encouragement during difficult situations. I have gained invaluable experience and knowledge under Dr. Fang’s guidance. I would also like to thank members of my committee, Dr. Richard Gould and Dr. Stephen Terry for their patience and continued support for me.
I would also like to thank my fellow researchers, Aaron McCullough for his hard work in building the initial components of the Optical Engine Test bed, my work would not have possible without it. Shawn Kim, Reuven Gomes, Ashutosh and Subhash Sriram for their invaluable inputs in the lab. It couldn’t have been possible to complete this without their assistance. Furthermore I would like to give a special thanks to Kyle Jonson for being a great friend and for his expert advice in putting together the test-bed. I’d like to additionally thank all of my fellow students under Dr. Fang. Each of them has been great to work with and they have always been eager to help with anything I may need. I would also like to thank Gary Lofton and Steve Cameron for all of the parts they have fabricated and machined for me even at short notice and also for their expert advice, I could not have been able to solve many issue without their support. The optical insert components are all Mr. Cameron’s craftsmanship. Most importantly I would like to thank the Chancellor’s Innovation Fund for supporting this project.
TABLE OF CONTENTS
LIST OF TABLES ... viii
LIST OF FIGURES ... x
CHAPTER 1: INTRODUCTION ... 1
CHAPTER 2: EXPERIMENTAL SETUP ... 19
2.1. Cummins SCE-903 ... 19
2.2. Optical Access ... 21
2.2.2 Extended Piston ... 24
2.3 Powertrain. ... 25
2.3.1 Driver Engine... 25
2.3.2 Speed Reducer ... 25
2.3.3 Couplings and shaft design ... 27
2.4 Lubrication and Coolant Systems ... 28
2.5 Exhaust System... 30
2.6 Intake System ... 32
2.7 Fuel System ... 35
2.7.1 Mechanical Components of fuel system ... 35
2.7.2 Fuel Pressure Control System ... 38
2.8 Crank Angle Degree and Exhaust TDC Detection ... 41
2.9 Fuel Injection Control Circuit ... 44
2.10 In-cylinder Pressure Data Acquisition System ... 46
2.11 High Speed Camera Set up. ... 51
2.12 Speed Sensor ... 51
CHAPTER 3: METHODS AND EXPERIMENTAL PROCEDURE ... 53
3.1 Introduction... 53
3.2 SCE-903 Experimental Procedures ... 53
3.2.2 Fuel Injector calibration ... 55
3.2.3 Pre-run preparations ... 57
3.3 Combustion Experiments ... 58
3.3.1 Experimental procedure for pressure data acquisition. ... 58
3.3.2 Experimental procedure for combustion flame imaging. ... 58
3.4 Data Analysis ... 60
3.4.1 Cylinder Volume Measurement... 60
3.4.2 In-cylinder Pressure data analysis ... 60
3.4.3 Ignition Delay ... 62
3.4.4 Heat Release Rate ... 63
3.4.5 Natural Flame Combustion Imaging and Analysis ... 64
3.5 Experimental conditions for diesel combustion testing... 65
CHAPTER 4: EXPERIMENTAL CHALLENGES AND SOLUTIONS ... 67
4.1 Optical Insert Damage ... 67
4.2 Powertrain Challenges ... 72
4.3 Oil system Challenges ... 76
4.3.1 Head Gasket leak ... 76
4.3.2 Other oil leaks and issues ... 77
4.4 Coolant system damage ... 80
4.5 Driver Engine Issues ... 81
4.5.1 Mounting base and fuel tank mounting bolt ... 81
4.5.2 Fuel tank mounting bolt ... 81
4.5.3 Mounting base ... 82
4.5.4 Radiator leaks and Exhaust muffler damage ... 82
CHAPTER 5: RESULTS AND DISCUSSION ... 84
5.1 Operating Conditions... 84
5.2 PV Diagram ... 86
5.3 In-Cylinder Pressure ... 87
5.5 Ignition Delay ... 93
5.6 Cumulative Heat Release ... 94
5.7 High Speed Combustion Visualization... 96
5.8 Limitations and Uncertainty Analysis ... 110
CHAPTER 6: CONCLUSIONS ... 113
7. REFERENCES ... 115
LIST OF TABLES
Table 1: Geometrical dimensions of N-14 and SCE-903 Optical Engines [11] ... 8
Table 2: Operating conditions for three spray targeting article [5] ... 12
Table 3: Specification for ‘Spray B’ injector [5] ... 15
Table 4: Operating conditions of the Sandia Optical Engine for ‘Spray B’ article [5] .. 17
Table 5: Results of ‘Spray B’ injector testing article... 17
Table 6: SCE-903 Engine Specifications ... 20
Table 7: Driver Engine Specifications... 25
Table 8: Speed Reducer Specifications ... 26
Table 9: Coupling Specifications ... 27
Table 10: Technical Specifications of the Intake System ... 33
Table 11: Mechanical Components of Fuel Systems and Technical Data ... 36
Table 12: Common Rail Pressure Sensor and myDAQ technical data... 39
Table 13: Technical Data for Kistler 6067B Pressure sensor ... 47
Table 14: Technical Data for National Instruments DAQ Hardware ... 48
Table 15: Technical Data for Speed Sensor ... 52
Table 16: Fuel injector calibration ... 56
Table 17: SCE-903 Operating conditions ... 65
Table 18: Operating conditions during window damage ... 68
Table 19: Original Coupling Specifications ... 72
LIST OF FIGURES
Figure 1: EPA Diesel Emission Standards... 1
Figure 2: Bowditch type optical Engine ... 3
Figure 3: Optical Engine at Tianjin University ... 5
Figure 4: IFP Optical Engine Set-up ... 6
Figure 5: Sandia National Labs Optical Engine in (a) closed and (b) open conditions .... 9
Figure 6: Sandia Optical Engine setup for three spray targeting article [5] ... 13
Figure 7: Schileren imaging for vapor penetration on Sandia Optical Engine [5] ... 16
Figure 8: SCE-903 Test Bed ... 20
Figure 9: Optical Access on SCE-903... 21
Figure 10: Quartz Insert Assembly ... 22
Figure 11: Quartz Insert Assembly Exploded View ... 23
Figure 12: Extended piston with Optical Insert Assembly ... 24
Figure 13: Driver Engine and Speed reducer assembly ... 26
Figure 14: Powertrain between the driver and SCE-903 ... 28
Figure 15: Lubrication and Coolant Systems ... 29
Figure 16: Schematic for Lubrication and Coolant Systems ... 30
Figure 17: Exhaust System for Driver ... 31
Figure 18: Exhaust System for SCE- 903 ... 32
Figure 19: Mounting adapter for Intake assembly ... 33
Figure 21: Intake System and MAP sensor on the SCE-903 ... 34
Figure 22: Graph depicting the calibration of MAP sensor. ... 35
Figure 23: Fuel System Schematic... 36
Figure 24: Fuel Injector and Adapter assembly ... 37
Figure 25: Fuel Lines and Common Rail and Fuel Tank Mountings ... 38
Figure 26: Fuel Rail Pressure Control System ... 40
Figure 27: Fuel rail pressure control LabVIEW program. ... 41
Figure 28: Shaft Encoder, Speed sensor and Hall Effect sensor ... 42
Figure 29: Ex TDC and other signals observed on an oscilloscope (two cycles). ... 43
Figure 30: Circuit diagram for CAD, Ex TDC and Injection Trigger. ... 44
Figure 31: Injection Control System Schematic ... 45
Figure 32: Kistler pressure transducer, Model 6067B ... 47
Figure 33: Data Acquisition Process for In-cylinder Pressure ... 49
Figure 34: LabVIEW VI for In-cylinder Pressure recording. ... 50
Figure 35: LabVIEW block diagram for In-cylinder Pressure recording. ... 50
Figure 36: High Speed Camera Schematic ... 51
Figure 37: Speed sensor mounting on SCE-903 ... 52
Figure 38: Fuel Injection and High Speed camera trigger synchronization. ... 59
Figure 39: In-cylinder pressure graph during window damage. ... 69
Figure 40: Quartz optical window insert defects and damages ... 70
Figure 42: Original powertrain design ... 73
Figure 43: Sheared original coupler ... 74
Figure 44: Modified powertrain ... 75
Figure 45: SCE-903 cylinder head and oil leaks ... 76
Figure 46: New oil return line with oil strainer ... 78
Figure 47: Balancing piston with counter weight and holes ... 79
Figure 48: Coolant lines... 80
Figure 49: Fuel tank mounting bolt failure ... 82
Figure 50: Exhaust muffler cracks ... 83
Figure 51: Motored In-Cylinder Pressure ... 85
Figure 52: PV Diagram for all Six Cases ... 86
Figure 53: IMEP Comparisons for six cases. ... 87
Figure 54: In-Cylinder Combustion Pressures for advanced fuel injection (-10 CAD) . 88 Figure 55: In-Cylinder Combustion Pressures for late fuel injection (-5 CAD) ... 89
Figure 56: Apparent Heat Release rate plots for all cases ... 91
Figure 57: Ignition delay for all six cases... 93
Figure 58: Cumulative Heat Release rates for all cases ... 94
Figure 59: Burning efficiency for SCE-903 ... 95
Figure 60: Fuel Spray High Speed Image ... 96
Figure 62: Case 1: Comparative analysis of AHRR, In-Cylinder Pressure and
combustion images ... 98 Figure 63: High Speed Combustion Images for case 2; 1000bar, -10 ... 101 Figure 64: Case 2 - Comparative analysis of AHRR, In-Cylinder Pressure and
combustion images ... 101 Figure 65: High Speed Combustion Images for case 3; 1200bar, -10 ... 103 Figure 66: Case 3 - Comparative analysis of AHRR, In-Cylinder Pressure and
combustion images ... 103 Figure 67: High Speed Combustion Images for case 4; 800bar, -5 ... 105 Figure 68: Case 4 - Comparative analysis of AHRR, In-Cylinder Pressure and
combustion images ... 105 Figure 69: High Speed Combustion Images for case 5; 1000bar, -5 ... 106 Figure 70: Case 5 - Comparative analysis of AHRR, In-Cylinder Pressure and
combustion images ... 107 Figure 71: High Speed Combustion Images for case 6; 1200bar, -5 ... 108 Figure 72: Case 6 - Comparative analysis of AHRR, In-Cylinder Pressure and
CHAPTER 1: INTRODUCTION
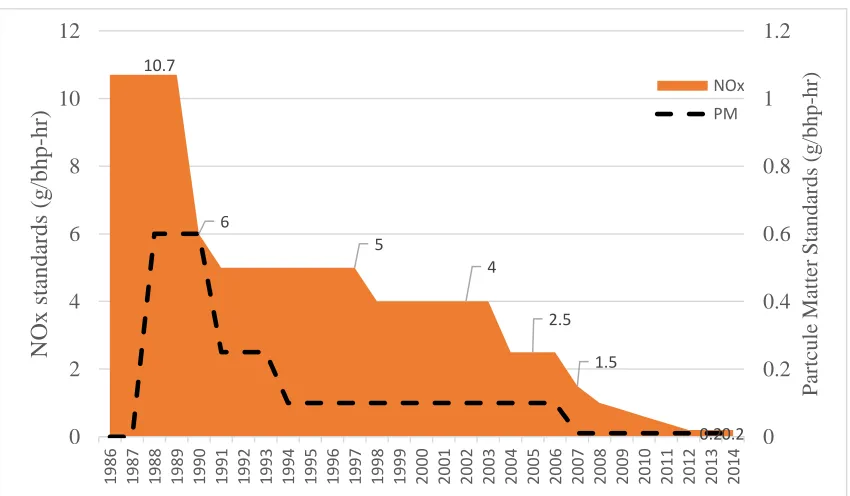
In the advent of alarming events like global climate change and global warming, the emission norms for internal combustion engines are progressively being tightened. These stringent emission norms have pushed for highly efficient engines, which deliver maximum performance demanded by the end-user while minimizing its carbon footprint. Diesel engines are able to offer both these features due to their inherent benefits of higher thermal efficiency and better reliability. But with these advantages, the pitfalls of exhaust emission that include NOx and particulate matter are a liability, especially in the face of progressively stricter EPA emission norms quantified in the graph below [9].
Figure 1: EPA Diesel Emission Standards 10.7 6 5 4 2.5 1.5 0.20.2 0 0.2 0.4 0.6 0.8 1 1.2 0 2 4 6 8 10 12
1986 1987 1988 1989 1990 1991 1992 1993 1994 1995 1996 1997 1998 1999 2000 2001 2002 2003 2004 2005 2006 2007 2008 2009 2010 2011 2012 2013 2014
Diesel Engines have always been popular in the heavy-duty transportation industry and provide great possibilities for further development of eco-friendly engines. Although to tap into this resource, it was important to devise methods to better understand the process of combustion which is the most fundamental part of an internal combustion engine. Researchers have foraged to understand in-cylinder combustion process for over a century and yet many parts of this process are not fully understood. Complicated computational models are limited by their ability to account for the highly unsteady and turbulent nature of in-cylinder combustion. Often these models consume huge amounts of valuable computational time and resources. In an attempt to get quick results and reduce the disparity between the actual combustion processes and the assessments of a combustion process, experimental engines with optical access to the combustion chamber were developed since the 1930’s [2]. These powerful tools empowered engineers and researchers to be able to visually analyze the combustion process in great detail.
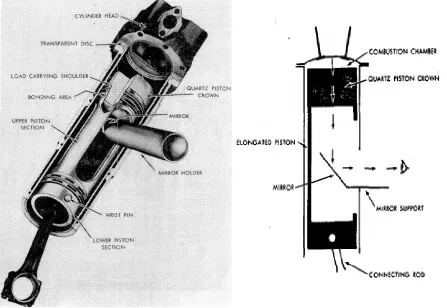
(a) Sectional view of Engine (b) Schematic of the working principle Figure 2: Bowditch type optical Engine
The original Bowditch editorial extensively discusses the various operating limitations and structural considerations for the design of such an optical engine. The most notable limitations are window fouling due to lubricating oil, lower firing rate due to optical parts and so on which shall be discussed in further detail subsequently.
and development considerations is provided in chapter 2 and was published in reference 1. Originally modified from a Cummins marine engine for research purposes by Cummins it was designated as SCE-903 and employed for two known research studies. The first publication was by a research group at Rutgers University in New Jersey in late 1980’s titled “Instantaneous Heat Transfer over the Piston of a Motored Direct-Injection Type Diesel Engine” [4]. This study employed 10 thermocouples to gather instantaneous heat flux from 1/7th of the surface of the firing piston, while the engine was motored at varying engines speeds and intake pressures. It concluded that although the instantaneous heat flux data could be used for building heat transfer prediction models, it could not be used to verify heat transfer correlations with variation of location especially in a fired engine.
A second study utilizing the SCE-903 was for evaluating high temperature lubricants conducted by the United States Army for a period of three years until 1993. The research was aimed at developing novel lubricants for use in future low heat rejection (LHR) engines by simulating the SCE-903 as a LHR. After testing six lubricants it was concluded that test oil designated as ‘oil D’ successfully completed 200 hours of testing at 275° C without significant degradation or wearing of parts. [3]
One such Bowditch optical engine depicted in Figure 3 was utilized by researchers at Tianjin University, China in 2015 to understand the effects of physical and chemical properties of fuels on combustion in optical diesel engine. [12]
Figure 3: Optical Engine at Tianjin University
varied EGR from zero to ~60% covering both conventional and low temperature combustion. Their results indicate that use of bio-oxygenated blends generates predominantly blue flames in the earlier phases of combustion and reduced soot luminosity. It is hence concluded that, while both fuels result in lower soot emissions as compared to diesel, the lower cetane number of DMF causes highest ignition delay, and hence lowest soot emission.
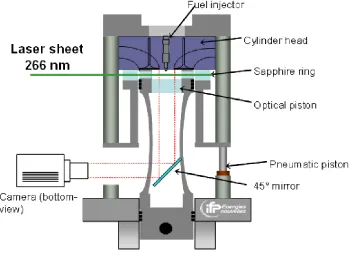
In France another Bowditch type optical diesel engine depicted in Figure 4 is available at the French Institute of Petroleum, abbreviated as IFP for the French name Institut Français du Pétrole. It is a 499cc single cylinder, light duty DI diesel with 15.6 compression ratio.
An article titled “Optical Investigation of Dual-fuel CNG/Diesel Combustion Strategies to Reduce CO2 Emissions” was published employing the IFP optical Engine in 2014 [10]. In an attempt to reduce CO2, research for dual-fuel combustion strategies using
compressed natural gas (CNG) and diesel fuel in the IFP optical engine was presented by Dronniou, N et. al. [10] Experiments for wide equivalence ratios were performed by supplying a premixed mixture of CNG, air and nitrogen while performing direct injection of diesel surrogate fuel that is a high reactivity, low sooting fuel blend. Optical diagnostics techniques employed were, high speed imaging of combustion luminosity to understand dynamic combustion events, and OH* chemiluminescence imaging. 2D planar laser-induced fluorescence (2D PLIF) was also performed to map fuel distribution at dual-fuel ignition. The study concluded that at low equivalence ratio combustion progressed slowly from near-wall region to the central part, which resulted in an increase in unburned hydrocarbons (UHC). Whereas at high equivalence ratios, backward flame propagation beginning in the near-wall region was observed in conjunction with mixture mixing mechanisms that aided the flame propagation. Dronniou et. al. [10] predicted that these remarkable flame propagation mechanisms would greatly reduce if not eliminate knocking in dual-fuel engines with high compression ratios running at high loads. These findings could open up new avenues for high power density engines which also can also be fuel efficient and environmentally friendly.
A heavy duty optical engine closer to SCE-903 in terms of size is located at Sandia National Laboratories’ Combustion Research Facility (CRF) in Livermore, California. Developed by Dr. Espey and Dr. Dec in 1993, this state of the art facility has empowered copious amounts of publications in the past two decades. The optical access engine at CRF is a single cylinder, direct injection, 4 stroke diesel engine with dimension listed in Table 1 and compared with the SCE-903 optical Engine.
Table 1: Geometrical dimensions of N-14 and SCE-903 Optical Engines [11]
N-14 Engine SCE-903 Engine
Engine Type Single-Cylinder,
Four-Stroke, DI Diesel
Single-Cylinder, Four-Stroke, DI Diesel
Combustion chamber Quiescent, direct injection Quiescent, direct injection
Number intake valves 2 2
Number of exhaust valves 1* 2
Bore 139.7 mm 139 mm
Stroke 152.4 mm 121 mm
Displacement 2.34 liters 1.83 liters
Compression Ratio 11:1 15:1
* In this optically accessible diesel engine, one of the two exhaust valves of the production cylinder head was replaced by a window and periscope.
feature of this engine is the separating upper liner that can be dropped down as shown in Figure 5b for rapid cleaning of all windows.
The multiple windows allow use of various optical diagnostic techniques except high speed photography and it is worthwhile understand these techniques due to their direct applicability to the SCE-903 test bed.
Utilizing this engine a paper titled “Diesel Engine Combustion Studies in a newly designed Optical-Access Engine using High-Speed visualization and 2D Laser Imaging” was published by Espey et. al. [11]. Three optical diagnostic techniques namely (a) natural flame high speed luminosity imaging, (b) laser induced incandescence imaging (LII) and (c) elastic (Mie) scattering imaging were used in this study. For a reference diesel fuel, at low fuel load they observed, first luminosity at 5.3 CAD (crank angle degrees) before TDC (top dead center) shortly after start of injection (SOI) coinciding with the start of premixed combustion and, the last flame luminosity at 28 CAD after TDC coinciding with the end of computed apparent heat release. During this period combustion was not seen to occur near the injector but the penetration of the leading edge of combusting fuel jet into the squish region was observed. This study is relevant to SCE-903 test bed because natural flame luminosity similar to this is expected in the SCE-903 combustion chamber and will be discussed later.
Figure 6: Sandia Optical Engine setup for three spray targeting article [5]
narrow-angle floor targeting, soot and CO formation is higher near the cylinder head due to redirected fuel jet from the piston bowl & reduced jet-jet interactions. (c) for wide-angle piston-bowl-lip targeting, emissions are higher as oxidation of soot, UHC and CO is reduced owing to diminished jet rebounding from the bowl. Furthermore additional soot is formed in the squish region as fuel jet is deflected towards it.
This article provides a better understanding of application of different injection strategies for emission reduction of DI diesel engines. These findings are valuable for design and development of new injectors such as the one under development at the North Carolina State University. The diesel combustion data presented in this thesis for SCE-903 Optical Engine can be utilized for similar future investigations.
Table 3: Specification for ‘Spray B’ injector [5]
Figure 7: Schileren imaging for vapor penetration on Sandia Optical Engine [5]
Table 4: Operating conditions of the Sandia Optical Engine for ‘Spray B’ article [5]
Conclusively the study incorporated actual engine combustion testing data for ‘Spray B’ fuel injector that included lift of length, ignition delay and so on are noted in the Table below. Here LL stands for liquid length, ID for ignition delay and H stands for Flame lift-off length.
This article provides SCE-903 researchers a glimpse of the best injector and combustion testing research carried out by the optical engine research community. The ignition delay estimations using the apparent heat release rate plots calculated are directly applicable to the diesel combustion data presented in this thesis and is very similar to the methods described in Chapter 4 of this thesis.
CHAPTER 2: EXPERIMENTAL SETUP 2.1. Cummins SCE-903
A heavy duty optical engine namely Cummins SCE-903 was developed from the Cummins VTA-903T commercial engine by separating a quarter of the original V8. The resulting single vee consisting of two cylinders was modified such that one cylinder would be the optical firing cylinder while the other is utilized for inertial balance. An exact description documented by the U.S. Army [3] is as follows:
“The SCE-903 block consists of Cylinder Nos. 7 and 8 separated from an 8-cylinder block at the midplane of Cylinder No. 5. This configuration allows for two main bearing webs, two camshaft bearing webs, the rear-mounted camshaft gear train, rear engine cover, flywheel, and flywheel housing to remain. The front of the engine is closed off with 16-mm (0.625-in.) steel plate fastened to the cylinder block with socket head cap screws.”
Table 6: SCE-903 Engine Specifications
Engine Type Single-cylinder direct injection diesel
Bore 139 mm
Stroke 121 mm
Displacement 1.83 l
Compression Ratio 15:1
Connecting Rod Length 208.1 mm
Crank Arm Radius 61.5 mm
2.2. Optical Access
To enable researchers with optical access to the combustion chamber further modification to the firing piston of the SCE-903 were made by a former research fellow. These modifications are briefly discussed in the sections below and their detailed descriptions can be found in reference 1.
2.2.1 Optical Insert
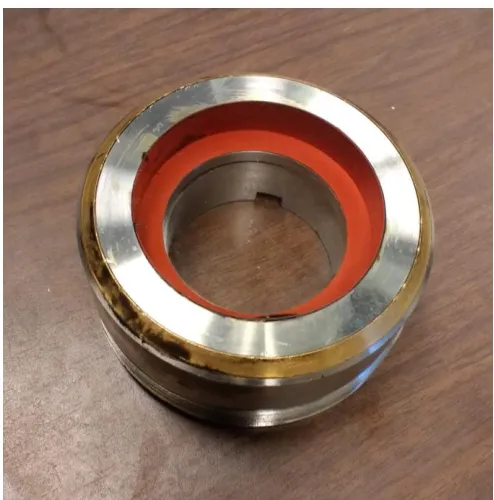
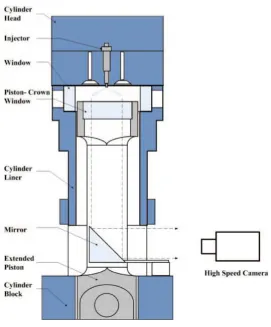
The SCE-903 was further modified to grant optical access to the combustion chamber by using a Bowditch type design that requires a window on the piston crown [2]. This window was designed using a circular quartz insert mounted in a stainless steel retaining cup as illustrated in Figure 10 below. The dimensions of the quartz window were selected based on stress calculations using finite element analysis (FEA) for an in-cylinder pressure of 100 bar. A replaceable copper gasket was added under the quartz insert to cushion the high stress concentration observed on the lower periphery of the window. RTV adhesive was used to secure the quartz insert in place against, small inertial forces acting upwards due to piston acceleration at TDC. An optical access that is diametrically 2.5 inch wide is achieved using a quartz insert. [1]
Figure 11: Quartz Insert Assembly Exploded View
2.2.2 Extended Piston
The optical insert assembly discussed above is fastened in an extended piston using a bronze seal ring and a threaded cap mounted below the optical insert as shown in the Figure 12 below. The bronze seal ring greatly improves the sealing of the combustion chamber around the optical insert. A special spanner was also necessary for ergonomic mounting and dismounting of the optical insert assembly because a conventional tool could not be used on the custom designed threaded cap.
Figure 12: Extended piston with Optical Insert Assembly
Extended Piston Optical Access
Cut out Stainless Steel Retaining Cup Copper Gasket
Bronze Seal Ring
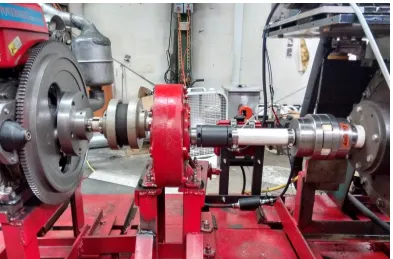
2.3 Powertrain. 2.3.1 Driver Engine
The SCE-903 optically modified engine is driven by a 1.2 L single cylinder diesel engine equipped with a standard 3.8 kW electrical starter powered by a 12 Volt automotive battery. The technical specifications for the driver are listed in Table 7 and a photo can be seen in Figure 13.
Table 7: Driver Engine Specifications
Model CHANGFA ZS1115G
Type Single-cylinder, four-stroke, direct injection
Bore 115 mm
Stroke 115 mm
Displacement 1.195 liters
Average piston speed 8.44 m/s
Compression ratio 17:1
Rated power 14.7 kW at 2200 rpm
Mean effective pressure 739.75 kPa
Fuel consumption 238 g/kW-hr
Oil consumption 1.47 g/kW-hr
Injection pressure 18.13±0.49MPa
Cooling method Water cooled evaporation
Net weight 185 kg (408 lb.)
Overall dimensions 858 × 450 × 699 mm
2.3.2 Speed Reducer
engine to drive the SCE -903 and also permits lower RPM of the SCE-903 for testing. The speed reducer is depicted in Figure 13 and its technical data can be found inTable 8.
Table 8: Speed Reducer Specifications
Model 200
Type Single reduction parallel shaft drive
Gear type Helical
Ratio 3:1
Input and output shaft diameters 1.5 in.
Dry weight 37 kg
Lubrication oil type Synthetic 75W-90 or equivalent
Lubrication oil quantity 24 oz.
2.3.3 Couplings and shaft design
The powertrain design from the driver to the SCE-903 utilizes a custom adapter, two commercial heavy duty couplings and a commercial muff coupling as shown in the Figure 14. The coupling between the driver engine and the speed reducer transmits power via a rubber center which not only ensures complete power transmission but also compensates for any opposing torques. On the output side the speed reducer has a 1.5 in driven shaft whereas the SCE-903 has a 2 in input shaft which necessitated the use of a heavy duty Lovejoy coupling. Advantage of using these couplings was the tolerance of misalignments in the shafts that they could handle. It is also meant for high torques and is specifically designed for frequent starting and stopping operation. The detailed tolerances and specifications of the couplings can be found in the Table 9 below.
Table 9: Coupling Specifications Coupling between Driver and speed reducer
Coupling Model Martin Quadra-Flex 6507K5
Max RPM rating 5250 RPM
Max torque rating 725 in.-lbs.
Max misalignment parallel, axial 0.02 in , 0.125 in
Max misalignment angular 1°
Coupling between the speed reducer and SCE-903
Coupling Model Lovejoy Coupling 6408K22
OD of the coupler 4.625 in
Max RPM rating 4200 RPM
Max torque rating 6225 in.-lbs.
Max misalignment parallel, angular 0.015 in
Muff coupling for drive shaft extension
Coupling model 9800T6 – OD 2.5 in
Max torque rating 5000 RPM
Figure 14: Powertrain between the driver and SCE-903
To bridge the distance between the speed reducer and the SCE-903 the driven shaft of the speed reducer was extended using a commercial muff coupling details of which are included in the Table 9. It is designed for high torque as the SCE-903 requires high torque.
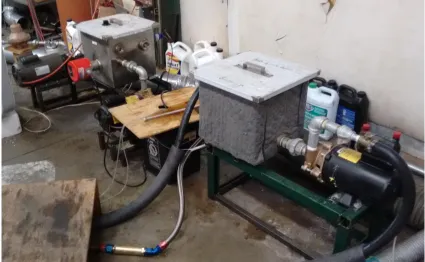
2.4 Lubrication and Coolant Systems
liquid level switch and a 1000W electric heater. Approximately 9 gallons of Shell Rotella 15W-40 engine oil is required and is supplied at 70 psig pressure and 170° F temperature via a 2HP Daytona rotary gear pump. The level switch drives the sump pump intermittently to ensure that the oil level in the reservoir as well as the engine oil pan is maintained at a pre-set level.
Similar to the lubrication system the coolant system is also a heated closed loop system that circulates standard 50% coolant, and 50% distilled water mixture at 170° F temperature. This systems consists of a 7 gallon coolant reservoir, a 1000W heater and a 0.5 HP WEG rotary pump. The schematic below depicts a detailed layout of both these systems with the cooling water circulation system for the in-cylinder pressure sensor discussed later.
Figure 16: Schematic for Lubrication and Coolant Systems
2.5 Exhaust System
Figure 17: Exhaust System for Driver
Figure 18: Exhaust System for SCE- 903
2.6 Intake System
Table 10: Technical Specifications of the Intake System
Intake Filter Spectre Conical HPR Air filter
Dimensions 6 in * 6.5in
Filter media Pre-oiled cotton gauze
Intake manifold diameter 3 inches
MAP sensor Model GM 12223861
MAP Operating pressure 40 to 304 kPa
MAP Operating Voltage 5.1 V ± 0.36
Figure 19: Mounting adapter for Intake assembly
Figure 20: Intake system
Figure 22: Graph depicting the calibration of MAP sensor.
2.7 Fuel System
2.7.1 Mechanical Components of fuel system
Fuel system design is very crucial for research engines like the SCE-903, because they not only need to have durability and dependability similar to a normal diesel engine, but also require a great deal of flexibility and superior control. For this project flexibility of the fuel systems was very important because it needs to supply different types of fuels. Secondly high degree of control is necessary since the SCE-903 engine runs in skip fire mode, meaning there are 3 combustion cycles followed by 10 motored cycles. This skip fire operation mode is achieved by precise control over fuel injection by the experimenter. Figure 23 gives the details of the hardware of the fuel systems which includes a fuel tank, a low pressure pump, a fuel
96.56 y = 62.229x + 3.6
R² = 0.9998
0 50 100 150 200 250 300 350
0 0.5 1 1.5 2 2.5 3 3.5 4 4.5 5 5.5
In ta ke Pr es su re (kPa )
Voltage Signal (V)
filter, a high pressure pump and a commercial fuel injector. Original VTA-903 used a 1980’s series injector but the SCE-903 is equipped with a modern 6 nozzle Bosch fuel injector mounted in a metal adapter to match the cylinder head dimensions. Figure 24 shows the custom designed adapter and fuel injector asse[mbly and Table 11 gives the technical specifications of all the components.
Table 11: Mechanical Components of Fuel Systems and Technical Data
Component Model
Common rail Bosch 18985
High pressure fuel pump Bosch CR/CP/1S3/R70/10 – 16S
Fuel pump motor GE 5K49TN4333AX
Fuel filter CAT 1R-0751
Injector Bosch 0445110816
Injector Nozzle diameter 152 micrometer
Fuel spray cone angle 160°
Figure 25: Fuel Lines and Common Rail and Fuel Tank Mountings
2.7.2 Fuel Pressure Control System
The schematic in Figure 26 depicts the process of fuel pressure control that uses a virtual PID (Proportional-Integral-Derivative) control loop built in LabVIEW. A PID controller was chosen for its simplicity and flexibility over a wide range and capability to continuously monitor fuel pressure. The recommended P, I and D values that exhibited best control in practice are 0, 0.05 and 0 respectively.
Table 12: Common Rail Pressure Sensor and myDAQ technical data Common rail pressure sensor
Common rail pressure sensor Bosch 0281002283
Max voltage output 5V
Operating range 0 to 1500 bar
Full scale output 0.5 to 4.5 V
NI myDAQ
Input/ Output Range ±10 V
Sampling rate 200 kS/s single channel
Accuracy 100 ppm of sample rate
detailed description and working principles of the high pressure pump can be found in reference 1. Ex. control voltage output is constant at 1.56V for fuel pressure setting of 400 bar.
Figure 26: Fuel Rail Pressure Control System Fuel Rail pressure
sensed
Bosch Pressure Sensor
Fuel pressure read by myDAQ (ai0)
NI myDAQ device
Fuel pressure reading and set point compared
LabVIEW virtual PID Controller
Output control voltage generated (ao0)
NI myDAQ device
HPP Solenoid actuated and fuel rail pressure set viaBosch
Figure 27: Fuel rail pressure control LabVIEW program.
2.8 Crank Angle Degree and Exhaust TDC Detection
Figure 28: Shaft Encoder, Speed sensor and Hall Effect sensor
detail in Section 2.9. The fuel injection signal is 10 degrees before compression TDC that is easily recognizable from the peak of the pressure signal recorded on channel 4.
Figure 29: Ex TDC and other signals observed on an oscilloscope (two cycles).
Figure 30: Circuit diagram for CAD, Ex TDC and Injection Trigger.
2.9 Fuel Injection Control Circuit
TDC. This can also be calculated in seconds using Equation 1 where td is the time between Ex
TDC and the following SOI.
𝑡
𝑑=
𝜃𝑁∗360° …. Eqn 1 where, N – Number of revolutions per second (RPM/60)
θ – SOI in CAD from Exhaust top dead center
The quantity of fuel is controlled by changing the injection duration, and is calibrated to 46 mg per injection. This value was derived by experimentation of various operating conditions for the SCE-903, which will be explained in detail later in this document.
The injection circuit consists of an injection switch, the black box, a function generator and an injector driver circuit as shown in Figure 31. As explained in the previous section CAD and Ex TDC are precisely detected and employed further for triggering fuel injection in the SCE-903. Injection switch was added with an AND operation and only when the switch, shown in the circuit diagram in Figure 31 above, is turned on, will fuel injection begin. Thus it lets the user decide, if and when fuel shall be injected into the combustion chamber. The AND operation reads the position of the injection switch as well as the Ex TDC and only if both inputs are high, it triggers the injection circuit.
But the precise timing and duration of fuel injection is controlled via the function generator. The injection duration (tinj) and the injection timing are set in the function generator,
and it is triggered via the injection switch. Once triggered the function generator delays the signal by td calculated using Equation 1 inputted in delay A. The injection duration is controlled
by input to delay B, and is set by the experimenter to A + tinj . Injection duration for the various
cases presented in this paper are calibrated so that precisely 46 mg of fuel is injected each time. The calibration shall be explained in detail in latter sections.
2.10 In-cylinder Pressure Data Acquisition System
Figure 32: Kistler pressure transducer, Model 6067B
The connecting cable type 1919 is a high temperature and high sensitivity cable with two layers of metal braided shielding and a BNC connector on the other end.
Table 13: Technical Data for Kistler 6067B Pressure sensor
Range bar 0 …… 250
Overload bar 300
Operating temperature range °C -50 …. 350
Cooling water flow, pressure l/min, bar 0.3 - 0.5, ≤6
Sensitivity pC/bar ≈−25
Sensitivity shift ( 50° to 350° C) % ≤±2
Linearity, all ranges % FSO ≤±0,5
is then read and stored on the computer using National Instruments (NI) real time data acquisition (DAQ) hardware-software package with details in Table 13.
Table 14: Technical Data for National Instruments DAQ Hardware
DAQ card PCI-MIO-16E-4
Input Range ±0.05 V to ±10 V
Max sampling rate 500 kS/s single channel
Accuracy 99.97% during a 24hr recording period Analog Inputs
Outputs
16 single ended, 8 differential channels 2 channels, all 12 bit resolution
Counters/Timers 2 up/down, 24-bit resolution
Connector block BNC-2110 to instruments & PCI bus to computer Application software LabVIEW, Measurement Studio etc.
Figure 33: Data Acquisition Process for In-cylinder Pressure
The LabVIEW virtual instrumentation or VI and the block diagram can be seen in Figure 34 and 35. The Ex TDC and CAD signals are inputted to the BNC-2110 block at user1 and AI Start respectively. Ex TDC signal triggers the LabVIEW program and it begins recording the in-cylinder pressure from the transducer. CAD signal acts as a marker for each pressure value received from the transducer and is used to co-relate and store pressure data. The encoder delivers 0.5 CAD resolution, which means 720 CAD signal per revolution and 1440 per cycle. As CAD is the marker, we are able to gather 1440 data points for every 4 stroke cycle of the SCE-903 from the existing DAQ system.
Pressure and CAD data recorded and stored via LabVIEW program. Analog to digital signals, co-relate to CAD
NI Data Acquisition Card (PCI-MIO-16E-4)
Analog reading input via BNC cable
NI BNC-2110 Connector Block
Pressure reading amplified to volts
Kistler 5004 Charge amplifier
In-cylinder pressure sensed (in pC)
Figure 34: LabVIEW VI for In-cylinder Pressure recording.
2.11 High Speed Camera Set up.
The SCE-903 is equipped with a Phantom v4.3 high speed camera that is capable of recording a 90,000 frames per second. A Nikkor 105 mm zoom lens with built in UV filters was used, typically set with an aperture of 11. The aperture setting and the exposure setting of 3 µs is kept constant across all experiments.
The high speed camera is synchronized with fuel injection in the combustion chamber using the injection trigger via the function generator as shown in Figure 36.
Figure 36: High Speed Camera Schematic
2.12 Speed Sensor
This change in resistivity causes a change in the output voltage from the sensor generating a square wave signal. A digital counter reads the frequency of the square wave and dynamically displays the speed on the 21 segment display. The external magnetic field is applied by a small circular permanent magnet fixed to a rotating plate on the crankshaft of the SCE-903. The sensor requires a 12V DC input voltage supplied from AC to DC voltage adapter. Technical data for the sensor can be found in Table 15 and the sensor mounting is displayed in Figure37.
Table 15: Technical Data for Speed Sensor
Sensor make and model NJK-5002C
Supply voltage 8V to 12V
Operating range 5 – 9999 RPM
Detection Range 1mm – 10 mm
CHAPTER 3: METHODS AND EXPERIMENTAL PROCEDURE 3.1 Introduction
In this chapter, experimental procedures developed for operating the SCE-903 test bed are discussed in detail. The SCE-903 test bed is a large and complex system involving numerous sub-systems and hence the author has chosen to outline the methods, safety precautions and procedures separately. This chapter shall discuss fuel calibration and injection testing procedures, engine operating procedures and operating conditions. Two types of data for in-cylinder combustion is acquired from the current test bed – one is the in-cylinder pressure data and second is the natural combustion flame images. The experiments to acquire these two data sets and methods for data analysis are also discussed in this chapter.
3.2 SCE-903 Experimental Procedures 3.2.1 Safety precautions
The following precautions should be taken before running the test-bed for human safety and also to prevent system damage.
Experimenters are required to wear safety goggles and ear protection during each run. Proper closed-toe footwear is mandatory and gas masks available in the lab are recommended for use while running the system.
During operation all personnel should be positioned either behind the driver engine or well in front of the SCE-903 safety shield. Stand clear of any rotating parts, and ensure all personnel are outside the plane of rotation of flywheel and couplers.
Ensure each bolt clamping base of the driver engine, speed reducer and the SCE-903 are torqued down to approximately 100 ft-lb. There are 17 of these 5/8” bolts clamping the mounting stands to the base plate.
Ensure all mounting bolts for the driver engine and the speed reducer are tightened such that the damping pads are compressed slightly. Ensure the three flywheel adapter mounting bolts are tightened.
Confirm that all set-screws for shaft keys and couplers are secured tightly. There are eleven of these – one on the driver engine adapter, two on each side of the rubber center coupler, 4 on the muff coupling sleeve between the speed reducer and SCE-903, and one on each side of the SCE-903 Lovejoy coupling.
Check the optical piston cap, and confirm it is snug fit. Refrain from over-torqueing. Ensure the exhaust opening is free of any debris during operation, debris can be forced
into the root blower and cause damage.
Regularly check oil levels in the SCE-903 and the driver engine, they must be half full. Remove all tools and loose objects from the test-bed. Thoroughly check the system
During fuel calibration carried out outside the engine precaution must be taken. Proper eye protection and safety equipment should be used, proper clothing is necessary as pressurized diesel particles can be injurious, if in contact with the skin.
3.2.2 Fuel Injector calibration
It is important to ensure that the quantity of fuel injected into the combustion chamber has been empirically verified using the existing experimental setup. Fuel quantity was calibrated for all the six cases presented in this thesis. Actual in-cylinder pressure during compression of 25 bar [1] was accounted for during fuel injector calibration, which yields accurate mass of fuel injected into the combustion chamber during experiments.
A highly sensitive Mettler AE100 weigh scale with a least count of 0.1 milligrams is used along with a closed container lined with fuel absorbing material. Procedure for fuel calibration is as follows:
1. Mount the fuel injector outside SCE-903 using proper supports. Ensure all the fuel lines are connected tightly and securely.
2. Test run the fuel system and test fuel injection for proper functioning.
3. Place the container on the scale and tar the dry weight of the container when the reading stabilizes.
5. Switch on the fuel pumps, fuel control systems and set the fuel pressure in LabVIEW virtual instrumentation panel to required value, accounting for motoring pressure. Set the appropriate injection duration on the function generator as discussed in Section 2.11.
6. Now inject fuel in the container 100 times which yields a measurable amount of fuel. 7. Weigh the container and record the weight of the injected fuel (mf).
8. Repeat this procedure at least five times and average the values of mass of fuel injected to account for abnormalities and small pressure fluctuations.
Stable diesel combustion was observed at 1000 bar fuel pressure, with 1ms injection duration and hence was selected as a base case for fuel quantity calibration. The mass of fuel injected for this case was calculated to be 46 mg. The Table 16 below displays all fuel injection durations with their calibrated fuel quantities for approximately 46 mg of injected fuel. The air fuel ratio is calculated assuming 80% volumetric efficiency.
Table 16: Fuel injector calibration Fuel
Pressure (bar)
Injection Duration Weight of fuel per Injection
(mg)
AF Ratio Equivalence Ratio Milliseconds CAD
(@ 600 rpm)
800 1.14 4.104 46.52 36.1511 0.401
1000 1.00 3.600 46.11 36.166 0.400
3.2.3 Pre-run preparations
It is necessary to simulate actual engine operating conditions and ensure proper data acquisition during testing. To achieve this following pre-run preparations are necessary for both the sets of experiments:
The oil and cooling systems are equipped with electric heaters. Engine coolant and oil are heated to 170° F and optical combustion chamber warmed up for at least 2 hours. Special care is necessary for the in-cylinder pressure sensor as output signal drift is a
common problem posed by Kistler sensors used in oily environments. Sensor and connecting cable should be relatively oil-free during testing. If necessary the sensor may be dismantled and thoroughly cleaned with special electrical cleaners.
Check the sensor signal for drifts after cleaning. If drifts higher than ±30 millivolts/sec are observed warm up the charge amplifier for 60 minutes [15] and check insulation of all wires and all BNC connections.
Verify that the pressure sensor cooling water system is running and water is clean of any oil or coolant deposits. It should be cleaned at regular intervals.
Switch on the function generator before connecting any ancillary circuits to protect other circuits from any output surges then connect all the necessary cables.
3.3 Combustion Experiments
Experimental procedures followed during combustion testing in the SCE-903 test bed are outlined in the following Sections. The safety checklist and the pre-run preparations should be completed before each test run.
3.3.1 Experimental procedure for pressure data acquisition.
All data presented in this report was recorded at engine speeds of 600 rpm. To simulate actual engine operating conditions the optical combustion chamber is heated to 170° F. To prevent over-heating of the optical piston crown and avoid window fouling the engine was operated in skip fire mode, where optical piston was fired thrice every 10 motoring cycles. Cylinder pressure and fuel injection pressure were monitored and digitally recorded during all experiments. The first combustion cycle was selected from the skip fire operation mode. The in-cylinder pressure measurements were recorded at half crank-angle-degree (CAD) increments and averaged over 20 combustion cycles. The step by step experimental procedures are outlined in detail in Appendix A of this thesis.
3.3.2 Experimental procedure for combustion flame imaging.
images throughout the piston stroke. At an engine speed of 600 rpm and the selected frame rate corresponds to 3 frames for every 2 CAD interval. For each test case three sets of combustion images were recorded and the typical combustion images will be presented. The high speed camera is synchronized by triggering both fuel injection and the camera at the same moment via the function generator depicted via a schematic in Figure 38. Consequently every combustion video begins recording from SOI. The procedure for recording combustion videos outlined in detail in Appendix A of this thesis.
3.4 Data Analysis
In cylinder pressure data and combustion images obtained by from the experiments is processed via excel programming and MATLAB code. The formulae and functions utilized for combustion analysis are discussed in this Section.
3.4.1 Cylinder Volume Measurement
The in-cylinder volume is calculated utilizing the engine geometry and known crank angle degrees. The clearance volume (Vc) for the SCE-903 was physically measured to be
128.57 cubic centimeters. The formula used to calculate cylinder volume [24] derived using the slider-crank mechanism is at any crank angle (θ) is:
𝑉
𝑉𝑐= 1 +
1
2(𝑟𝑐 − 1) ∗ [𝑅 + 1 − 𝑐𝑜𝑠𝜃 − (𝑅
2 − 𝑠𝑖𝑛2𝜃)1/2] ………. Eqn 2
where R is ratio of connecting rod length to crank radius V is volume at crank angle θ,
Vc is clearance volume,
rc is compression ratio
3.4.2 In-cylinder Pressure data analysis Pressure pegging
metrics like peak pressure and heat release rate. Several methods of pressure pegging have been useful to researchers before [14] the most common of which are: [13]:
1. Reference cylinder pressure measurements at intake BDC: In this method the in-cylinder pressure measurements at fixed crank angles near IBDC are equated with intake manifold absolute pressure (MAP). [15]
2. Fitting a polytropic compression index to the in-cylinder compression pressure measurement: This is a very popular and simple method but selecting a proper polytropic compression index can prove to be a challenge.
3. Use another pressure transducer lower in the cylinder to reference the piezoelectric pressure transducer: While this method is most accurate, it has severe limitations for practical application. Installing a second pressure transducer near BDC in the cylinder is difficult, time consuming and costly.
The first method is simplest and is known to yield good results at low speeds and part loads. As the engine rpm for all experiments presented is low (600 rpm) the data presented in this thesis is pegged by referencing in-cylinder pressure over the intake stroke with intake manifold absolute pressure.
Pressure correction formula used for every pressure data point is
𝑃𝑎𝑐𝑡𝑢𝑎𝑙 = 𝑃𝑚𝑒𝑎𝑠𝑢𝑟𝑒𝑑− 𝑃𝑐𝑜𝑟𝑟𝑒𝑐𝑡𝑖𝑜𝑛 ………. Eqn 3 Where
Where Pa is average intake pressure measured inside the combustion chamber and Pi is the
intake manifold absolute pressure measured by the MAP sensor.
This corrected pressure data is then further smoothened using a seven point average across all 1440 data points and then analyzed on a pressure versus crank angle plot.
Indicated Mean Effective Pressure (IMEP)
Indicated mean effective pressure is a relative engine metric which quantifies the engines ability to perform work and is independent of engine size. Excel calculates IMEP using the following formula:
𝑖𝑚𝑒𝑝 = ∆𝜃
𝑉𝑠 ∑ 𝑝 ∗
𝑑𝑉
𝑑𝜃 ………. Eqn 4
where Vs is the swept volume, p in cylinder pressure and dV is instantaneous change in volume
This equation yields gross IMEP when equated across the 4 stroke cycle and pumping imep in the intake and exhaust stroke range. [16]
3.4.3 Ignition Delay
3.4.4 Heat Release Rate
Combustion chamber of a direct injection compression ignition engine like the SCE-903 can be modeled as a single open system, with only mass flow of fuel across the system boundary, assuming intake and exhaust valves are completely closed. Applying the first law of thermodynamics to this system the following Equation for apparent net heat release rate derived Heywood [24] is used:
𝑑𝑄𝑛
𝑑𝜃 = 𝛾 𝛾−1 𝑝 ∗
𝑑𝑉 𝑑𝜃 +
1 𝛾−1𝑉
𝑑𝑝
𝑑𝜃 ……… Eqn 5
where Qn is apparent net heat release rate in Joules per degree
P is in-cylinder pressure in Pascals V is in-cylinder volume in cubic meters
γ is the ratio of specific heats taken to be 1.325
This Equation computes the amount of heat added by the fuel, which produced the measured pressure variations. It is based on the following assumptions:
Contents of the cylinder can be modeled as an ideal gas, and R assumed constant Sensible enthalpy of injected fuel is negligible
Mixture is assumed to be uniform across the combustion chamber.
γ – the ratio of specific heat of combustion gases is assumed to be a mean across the combustion processes.
experiments. Hence the small errors (<1 Joules per CAD) due to crevice flows will not change the conclusions reached in this thesis and are excluded.
The above Equation can be used to closely approximate the cumulative heat release rate by integrating the net heat release rate over the complete combustion process as follows:
𝑄𝑐 = ∫
𝑑𝑄𝑛
𝑑𝜃 𝜃
𝜃𝑠𝑡𝑎𝑟𝑡 𝑑𝜃 ………….. Eqn 6
where Qc is the cumulative heat released by the fuel during combustion
θstart is the start of fuel injection in CAD
θis the end of power stroke in CAD
In the future a fairly accurate estimate of the gross heat released over complete combustion process could be made with the incorporation of a heat transfer model like one’s presented by Woschni or Anand [17, 18, and 24]. Although the conclusions reached in this thesis will not change because the relative errors in heat release calculations shall be negligible. Thus heat transfer losses are also excluded during heat release approximations.
3.4.5 Natural Flame Combustion Imaging and Analysis
soot particles are formed and due to combustion heat begin burning with intense yellow light. The yellow color is detected in high speed images and is known as soot luminosity. [8, 9]
Theses combustion images further processed to yield a better resolution of the luminosity values of each frame. These characteristic combustion images at selected CAD for each case are presented in the results section.
3.5Experimental conditions for diesel combustion testing
The data presented in this thesis is utilized to set baseline operating characteristics of the SCE-903 optical engine with the quartz insert assembly for diesel fuel. Since the SCE-903 combustion chamber with the quartz insert had never been fired, known operating regions for the engine were not available. Hence the optimum operating conditions were selected based on some combustion trials conducted on the SCE-903, by varying engine speed, fuel injection pressure and timings and heating temperatures of oil and coolant. For the settings presented in Table 17 below, best combustion images and pressures were observed.
Table 17: SCE-903 Operating conditions
Engine Speed 600 rpm
CHAPTER 4: EXPERIMENTAL CHALLENGES AND SOLUTIONS
Experimental combustion research is generally accompanied with practical challenges and issues and the SCE-903 test bed is no exception. The SCE-903 test bed is a recently constructed hefty system that requires close attention to multiple variables. It is the first time the test bed is utilized for rigorous testing and hence it is important to document any major problems. The major challenges faced as well as the solutions devised by the author while gathering combustion data presented in this thesis are discussed briefly in this chapter. Main issues like damage to the optical widow insert, failures of heavy duty couplers, coolant system issues etc. are discussed below.
4.1 Optical Insert Damage
Engine Operating Conditions
The SCE-903 was originally developed by the U.S. Army for testing lubricants due to which combustion testing was never carried out in the modified combustion chamber. Hence it was necessary to understand the operating characteristics of SCE-903 with the new optical access geometry. During one such experiment with the operating conditions proposed in Table 18resulted in catastrophic failure of the optical window. Fuel injection timing was advanced to 20 CAD BTDC, which typically increases in-cylinder pressure and hence power output of a normal diesel engine. To limit the pressure rise in the optical engine fuel quantity was reduced to 50% of the base case. Albeit these precautions the peak pressure observed during this experiment was 7.5 MPa, which is 2.5 MPa higher than the base case of 1000 bar fuel pressure at 10 CAD BTDC fuel injection timing.
Table 18: Operating conditions during window damage
Engine Speed 600 rpm
Coolant& Oil Temperature ~ 170° F Fuel Injection Pressure 800 bar
Injection duration 0.8 millisecond Injection advance 20 CAD BTDC
Fuel quantity 24.94 mg
In-Cylinder Pressure
increase of pressure can be attributed to the dominantly pre-mixed combustion mode observed in SCE-903, which is discussed in detail in later Sections. Advancing fuel injection timing to 20 CAD BTDC allowed the diesel fuel to vaporize and mix extremely well with the air in the combustion chamber. Furthermore the air temperature in the combustion chamber at 20 CAD BTDC, was not high enough for the diesel to combust, which resulted in a lean but extremely well mixed almost uniform fuel-air mixture.
When the piston reached compression TDC this fuel-air mixture caused instantaneous combustion, akin to a small explosion, releasing a high amount of heat. This caused the pressure to suddenly spike from 27 bar to an alarming 73 bar in only 3 CAD. Resulting in a pressure loading of 15.333 bar/CAD, which was higher than the design rating for the window. This coupled with other reasons caused the window to crack. Combustion images recorded during this event have also been presented in later Sections.
Figure 39: In-cylinder pressure graph during window damage.
0 1 2 3 4 5 6 7 8
0 50 100 150 200 250 300 350 400 450 500 550 600 650 700 750
Reasons for failure of Window Material
The original quartz window insert was recycled from another experimental setup that uses lasers in previous experiments. Laser beams are passed into a combustion chamber via quartz window inserts of small diameter. Sometimes due to errors in operation the laser beams cause miniscule damage to the optical inserts rendering them useless for laser based experimentation. As seen in Figure 40 the original insert used in the SCE-903 had these miniscule internal voids. During normal operation of the SCE-903 these flaws did not adversely affect combustion, but they did compromise the structural rigidity of the piston crown. These were weak spots in the window and served as starting points for cracks or other deformations during unexpected high pressure spikes such as the one experienced during this run. The resulting crack in the optical window is shown Figure 40b, the voids where it originated can be seen Figure 40a on the left.
(a) (b) Figure 40: Quartz optical window insert defects and damages Internal voids caused by laser
Figure 41: High Speed images recorded during this event
The high speed combustion images shown in Figure 41, depict the crack developing in the optical window. The first image shows the start of combustion with the fuel injector tip visible at the center. In the second image a turbulent pre-mixed combustion flame is evident and in the last two images the window crack due to high in-cylinder pressure is seen.
Modifications to the system
The window insert was replaced with a new quartz window that does not have similar structural weak spots. Special care was taken while assembling the new insert so that no minor edge defects arise during assembly. RTV adhesive was used to hold the window in the cup holder and was cured for one week.
4.2 Powertrain Challenges
The original powertrain of the SCE-903 suffered from an alarming failure of the coupling rubber center during testing. The rubber center (highlighted by red box in the Figure below underwent fatigue failure as the operating conditions exceeded its design capacity.
Original powertrain design
The original powertrain design from the driver to the SCE-903 utilized a custom adapter, two commercial heavy duty couplings and a universal joint as shown in the Figure 42.
The couplings with a rubber center not only ensured complete power transmission but also compensated for any opposing torque’s that may arise when the optical engine is fired. The detailed tolerances and specifications of the old couplings can be found in the Table 19 below. Although the tolerance on the engine were ensure to be within limits in static condition, the rubber center experienced excess vibrations and shock loading and resulted in fatigue failure.
Table 19: Original Coupling Specifications
Coupling Model Martin Quadra-Flex 6507K9
Outer diameter of coupling 8.625 in
Max torque rating 3600 RPM
Max RPM rating 4530 in.-lbs.
Max misalignment parallel, axial (in) 0.032 in , 0.125 in
Figure 42: Original powertrain design
Reasons for failure of rubber center
torque higher than the rated torque of the rubber center. Hence the sudden high jerk acting on the rubber center during every run, eventually resulted in fatigue failure shown in Figure 43.
Figure 43: Sheared original coupler
Modifications to the system
and stopping the system. This design eliminated the root cause of failure of the rubber center by creating a secure support for the coupler from both sides and eliminating the high torques acting on the rubber center. The possibilities for shaft whirling were also eliminated ensuring that a recurrence of such unsafe event is prevented. The technical specifications of the new coupler can be found in Table 20 below.
Table 20: New coupling Specifications
Coupling Model Lovejoy Coupling 6408K22
Max torque rating 4200 RPM
Max RPM rating 6225 in.-lbs.
Max misalignment parallel 0.015 in
Max alignment angular 0.5°
4.3 Oil system Challenges
Similar to most IC Engines the SCE-903 Engine also faced various issues with the oil system. The details and solution for these are discussed below
4.3.1 Head Gasket leak
A sizable amount of oil leaking into the coolant system was observed when a thick layer of oil was seen in the coolant reservoir. The possible reasons for this leak were, a damaged head gasket, damaged oil lines or oil leaking past the threads of the head bolts. This was a serious problem and to verify, the cylinder head assembly was removed and closely examined. Some oil deposits were observed on the head gasket, leaking past the head bolts and can be seen highlighted by red circles in the Figure 45 below.
The smaller hole marked in blue are coolant passage ways and oil can be seen leaking into them past the heal bolts and the head gasket. Hence the head gasket was replaced with a new one cut out from the original VTA-903 head gasket at the mid-plane of the 5th cylinder. The head bolt threads were also sealed with thread locking material as a precautionary measure, to prevent any leaks past the threads into the cooling water jacket.
4.3.2 Other oil leaks and issues
In addition to the head gasket leak, oil leaks were also observed on the lower most part of the cylinder, past the oil sump return line. The reason for this leak was the improper fastening of the return oil plug on the bottom of the oil pan. The oil pan was detached and appropriate fastening created for the return plug along with sealants from both sides to prevent any further recurrence of such an event.
Oil line leaks and balance piston cap
rated for 1000 psig pressure and 350° F temperature. An oil strainer was also installed to protect the return pump from any metal pieces that rarely may pass through the sump.
Figure 46: New oil return line with oil strainer
Balance piston cap
Figure 47: Balancing piston with counter weight and holes

![Figure 7: Schileren imaging for vapor penetration on Sandia Optical Engine [5]](https://thumb-us.123doks.com/thumbv2/123dok_us/1340186.1166960/31.612.197.431.123.394/figure-schileren-imaging-vapor-penetration-sandia-optical-engine.webp)