ii ABSTRACT
JONES, SHARON TORRENCE. Technology Integration in the Teaching and Learning Process in Career and Technical Education Programs in North Carolina. (Under the direction Dr. James Bartlett.)
Career and technical education (CTE), historically known as vocational education, is a collective term used to identify high school curricula designed to teach students job skills and prepare them for employment (Lynch, 2000). Transformations in the workforce have created a demand for teachers to be technologically literate and adept at using technology as a part of their teaching methods (Gaytan, 2006).
The purpose of the study was to examine North Carolina CTE instructor’s level of technology integration and related factors that could be used to predict technology integration including: perceived technology anxieties, barriers, and perceived teaching effectiveness. The research methodology included a survey design utilizing the
frameworks of the Technology Acceptance Model (TAM) and the Kotrlik/Redmann Technology Integration Scale (KRIS). The sample was drawn from CTE teachers who attended the 2009 Summer Conference in North Carolina.
iii
iv
Technology Integration in the Teaching and Learning Process in Career and Technical Education Programs in North Carolina
by
Sharon Torrence Jones
A dissertation submitted to the Graduate School of North Carolina State University
in partial fulfillment of the requirements for the Degree of
Doctor of Education
Adult and Community College Education
Raleigh, North Carolina 2011
APPROVED BY:
_________________________________ ______________________________ Dr. Brad Mehlenbacher, Member Dr. Joe R. Busby, Member
_________________________________ _____________________________ Dr. Diane D. Chapman, Member Dr. James E. Bartlett, Chair
ii
DEDICATION
I dedicate this dissertation to my family- my Mom, Dad and brother David, and my in-laws- who have given me unconditional love and have been my cheerleaders as I have progressed through this journey. This paper is also dedicated to my fellow cohort colleagues, Lisa Martin and Patrice Mitchell for their consistent support and
iii
BIOGRAPHY
I am a Career and Education teacher in Charlotte Mecklenburg Schools and have been teaching for 5 years. My first teaching position was in Apex, NC teaching computer programming and web development. Currently my position at Phillip O. Berry Academy of Technology includes teaching SAS programming, web development, and computer programming.
iv
TABLE OF CONTENTS
Page
LIST OF TABLES ... vi
LIST OF FIGURES ... ix
CHAPTER I. INTRODUCTION ... 1
Statement of the Problem ... 4
Statement of Purpose ... 6
Research Objectives ... 7
Significance of the Study ... 8
Definition of Terms... 10
Theoretical Framework ... 13
Conceptual Framework ... 17
Limitations and Delimitations... 18
II. LITERTATURE REVIEW ... 19
Technology Adoption Versus Technology Integration ... 20
Technology Acceptance Model ... 28
Kotrlik and Redmann Technology Integration Scale ... 32
Technological History and Education ... 39
Constructs Influencing Technology Integration ... 43
Summary ... 56
III. METHODOLOGY ... 58
Introduction ... 58
Research Design ... 59
Participants ... 60
Sampling ... 62
Instrumentation ... 65
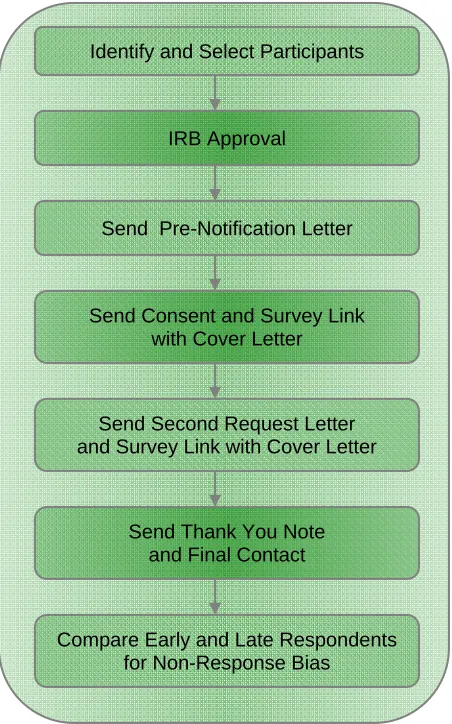
Data Collection ... 69
Data Analysis ... 71
v
Table of Contents (Continued) Page
IV. FINDINGS ... 77
Data Collection ... 78
Pre Data Analysis ... 79
Analysis of Research Objectives ... 90
Summary ... 129
V . CONCLUSIONS, DISCUSSION OF FINDINGS, AND RECOMMENDATIONS ... 131
Discussion of Findings ... 133
Recommendations ... 143
Limitations ... 148
REFERENCES ... 150
APPENDICES ... 161
A: Timeline to Complete the Study ... 162
B: Budget to Complete the Study ... 163
C: Request to Use Instrument – KRIS ... 164
D: Permission to Use Instrument – KRIS ... 165
E: KRIS Instrument ... 166
F: Request to Use Instrument – TAM ... 172
G: Permission to Use Instrument – TAM ... 173
H: TAM Instrument ... 174
I: IRB Approval ... 176
vi
LIST OF TABLES
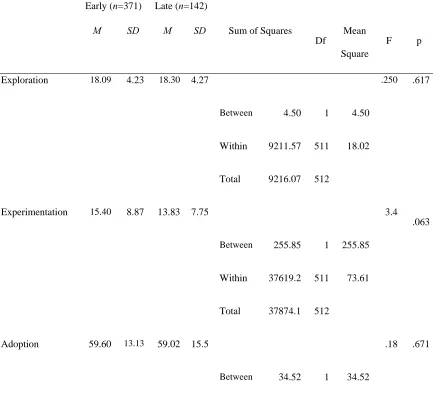
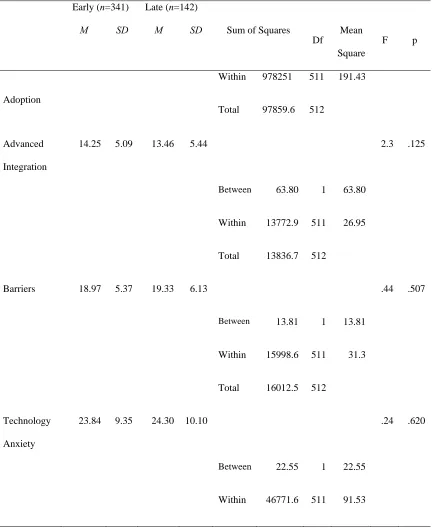
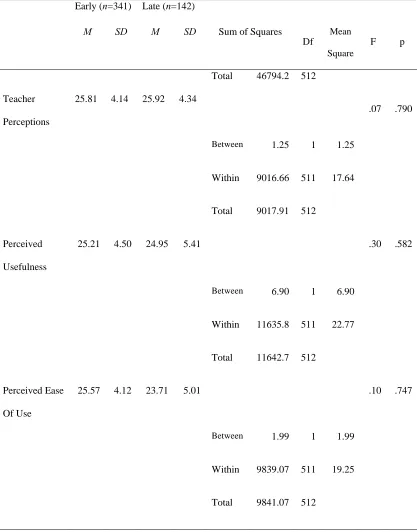
Table Page Table 3.1 Enrollment and Teachers by Program Area ... 61 Table 3.2 Teachers by Discipline, 2009 CTE Summer Conference ... 61 Table 3.3 Stratified Sample Calculations for North Carolina CTE Teachers ... 65 Table 4.1 Analysis of Variance Comparison of Early and Late Respondents on
Technology Integration with Exploration, Experimentation, Adoption, Advanced Integration, Barriers, Technology Anxiety and Teacher
Perceptions, Perceived Usefulness, and Perceived Ease of Use ... 80 Table 4.2 Chi Square Comparison of Early and Late Respondents by
Categorical Demographic Characteristics of Gender, Age, and
Years of Teaching ... 82
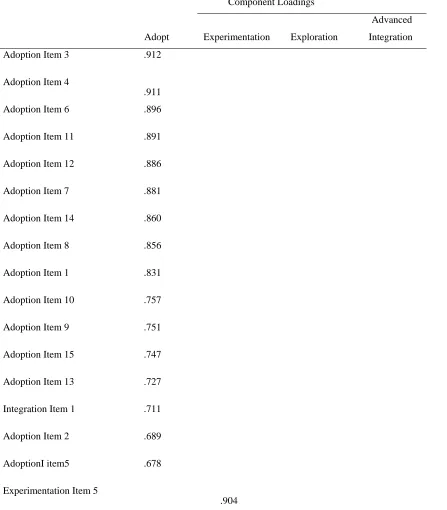
Table 4.3 Factor Loadings of KRIS Scale Items Adoption, Advanced
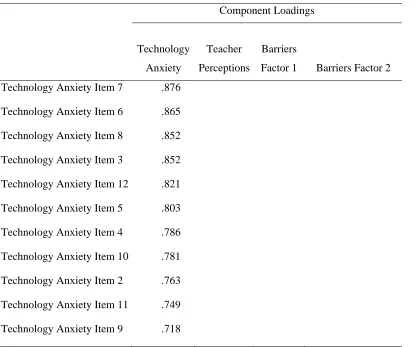
Integration, Experimentation, and Exploration ... 85 Table 4.4 Factor Analysis of KRIS Scale Items Barriers, Teaching Perceptions,
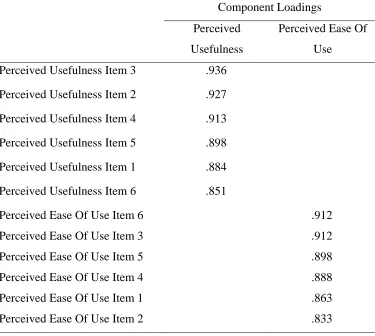
and Technology Anxiety ... 88 Table 4.5 Factor Analysis of TAM Scale Items Perceived Usefulness and
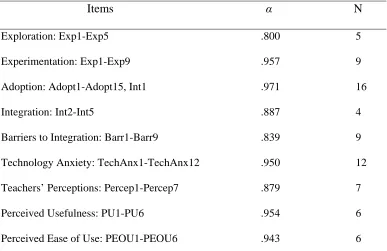
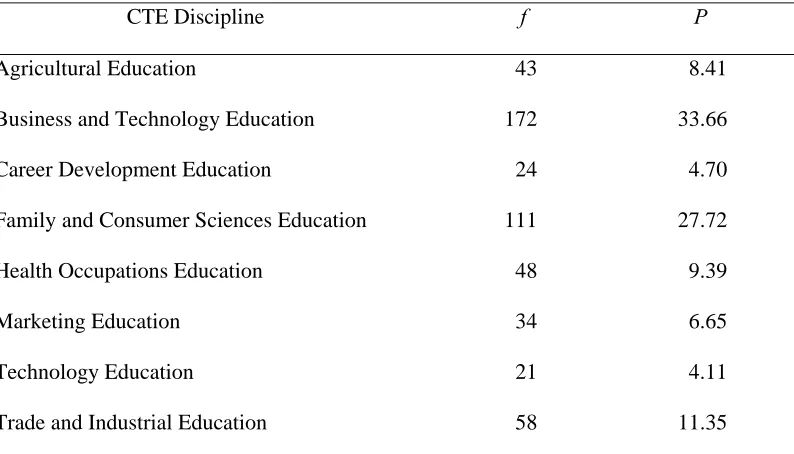
Perceived Ease of Use, ... 89 Table 4.6 Reliability, Cronbach’s Alpha of Variables for KRIS and TAM Scales ... 90 Table 4.7 Participant Frequencies and Percents by CTE Discipline ... 91 Table 4.8 Frequencies and Percentages of Participants Age Range,
Years of Teaching and Gender ... 92 Table 4.9 Frequencies and Percentages of Sources of Technology Training
for CTE Teachers ... 93
Table 4.10 Means and Standard Deviations for CTE Teachers on the Individual Items for KRIS Subscales of Adoption, Exploration, Advanced
vii List of Tables (Continued)
Table 4.11 Grand Means and Standard Deviation on Summated Items for KRIS Subscales of Adoption, Exploration, and Advanced Integration,
and Experimentation ... 98 Table 4.12 Frequency and Percentages of Participants Responses for Individual
Items for the Four Levels of Integration: Exploration,
Experimentation, Adoption, and Advanced Integration ... 100 Table 4.13 Grand Means and Standard Deviations on Summated Items for
KRIS Subscales of Barriers, Perceptions, and Technology Anxiety ... 104 Table 4.14 Means and Standard Deviations on Summated Items for
CTE Teachers on the Individual Items for the KRIS Subscale of
Barriers to Technology Integration ... 105 Table 4.15 Frequency and Percentages of Participants Responses for
Individual Items for the KRIS Subscale Barriers ... 106
Table 4.16 Means and Standard Deviations for CTE Teachers on the Individual Items for KRIS Subscale Perceptions
of Teaching Effectiveness ... 107
Table 4.17 Frequency and Percentages of Participants Responses for Individual Items for the KRIS Subscale Perceptions
of Teaching Effectiveness ... 108
Table 4.18 Means and Standard Deviations for CTE Teachers on the
Individual Items for the KRIS Subscale Technology Anxiety ... 109 Table 4.19 Means and Standard Deviations for CTE Teachers on the
Individual Items for the KRIS Subscale Technology Anxiety ... 110
Table 4.20 Grand Means and Standard Deviations on Summated Items for
TAM Subscales of Perceived Usefulness and Perceived Ease of Use ... 111 Table 4.21 Means and Standard Deviations for CTE Teachers on the
Individual Items for the TAM Subscales of Perceived Usefulness
viii List of Tables (Continued)
Table 4.22 Frequency and Percentages of Participants Responses for
Individual Items for the TAM Subscale Perceived Usefulness ... 113 Table 4.23 Frequency and Percentages of Participants Responses for
Individual Items for the TAM Subscale Perceived Ease of Use ... 114 Table 4.24 Relationship between the KRIS Variables and the TAM’s
Perceived Usefulness as Measured by Pearson’s Correlation ... 115 Table 4.25 Relationship between the KRIS Variables and the TAM’s
Perceived Ease of Use as Measured by Pearson’s Correlation ... 116 Table 4.26 Multiple Regression Analysis in Exploring the Variance to the
Technology Integration Scale Exploration (KRIS) ... 118 Table 4.27 Stepwise Multiple Regression Analysis to Explore if KRIS
Variables and TAM Variables Explain Significant Amount of
Variance in Exploration ... 120 Table 4.28 Multiple Regression Analysis in Exploring the Variance to the
Technology Integration Scale Experimentation (KRIS) ... 121 Table 4.29 Stepwise Multiple Regression Analysis to Explore if KRIS
Variables and TAM Variables Explain Significant Amount of
Variance in Experimentation ... 122 Table 4.30 Multiple Regression Analysis in Exploring the Variance to the
Technology Integration Scale Adoption (KRIS) ... 124 Table 4.31 Stepwise Multiple Regression Analysis to Explore if KRIS
Variables and TAM Variables Explain Significant Amount of
Variance in Adoption ... 125 Table 4.32 Multiple Regression Analysis in Exploring the Variance to the
Technology Integration Scale Advanced Integration(KRIS) ... 127 Table 4.33 Stepwise Multiple Regression Analysis to Explore if KRIS
Variables and TAM Variables Explain Significant Amount of
ix
LIST OF FIGURES
Figure Page
Figure 1.1 Original Technology Acceptance Model ... 15
Figure 1.2 Conceptual Framework for the Study ... 17
Figure 2.1 Final Technology Acceptance Model ... 30
1
CHAPTER ONE
INTRODUCTION
Technology is becoming an integral part of many jobs within the workforce (Atkinson, 2000; Plomp, Anderson, & Law, 2009). Bailey and Stefaniak (2002) stated that “computer systems have permeated virtually every facet of organizations” (p. 5), and the field of education is not immune to rapid changes regarding the use of technology. In a study of career and technical education teachers, Redmann and Kotrlik (2004) stated, “The rapid changes occurring in society and in technology have had tremendous impact on the educational community as it prepares individuals for the workplace” (p. 76). CTE teachers face a unique challenge regarding technology because they are both
professionals in the workforce and participants in a profession that prepares people to enter the workforce. Career and technical education is a discipline that has been created to better prepare students to use technology in the workforce, employers are challenging their employees not only to understand and use technology, but to find innovative ways to enhance the uses of technology (Jacobsen, 2001; Redmann & Kotrlik, 2004). Despite the support and investment schools have placed in acquiring technology, concern exists that technology still remains underutilized (Fabry & Higgs, 1997).
2
ISTE, 2008). Providing valuable life skills to American students is the goal of CTE, and the belief that technology can increase learning remains strong. However, the successful integration of computers in the classroom depends largely on how teachers embrace and use technology practices (Fabry & Higgs, 1997).
Since the creation of CTE, economic developments have had major influences on the content and direction of curriculum in the secondary schools (Rojewski, 2002). CTE was enacted to prepare students for jobs resulting from the industrial revolution. The beginning of federal legislation shaping vocational education was the Smith-Hughes Act (Lynch, 2000), which emphasized a call for a curriculum that would meet the needs of the working class (Lynch, 2000). Developments to accommodate the “working class” in school curricula have remained relatively gradual until recently, when economists declared a “new economy” (Rojewski, 2002, p.32). A new economy is one that includes manufacturing, globalization of business, information handling, business management practices, and fierce competition (Rojewski, 2002). The change in society from sole manufacturing environments to a multi-tasking, information-technology-based
environment has created diverse problems in our educational system (Rojewski, 2002). The adoption of new technology in business and industry is placing additional emphasis on the need for training and education (Rucker & Reynolds, 2002).
3
and industrial professions. Teachers are a subset of all educators and are unique because they often have the predominant responsibility of teaching workforce development programs (Brand, 2008). CTE teachers assist in preparing students to pursue academic and technical studies in the workforce, post-secondary education, and beyond (Belland, 2009).
Changes in the workforce due to the technological revolution have created a demand for CTE educators to be computer and technologically literate (Redmann & Kotrlik, 2004; Kotrlik & Redmann, 2005). Additionally, these changes are challenging CTE professionals to adapt to using technology in their teaching methods to prepare students for the workforce. Specifically, the National Educational Technology Standards by the International Society of Technology Education (ISTE) (2008) states that teachers should “develop technology-enriched learning environments that enable all students to pursue their individual curiosities.” Pursuing their thoughts and ideas allows students to become active participants in their own educational goals, learning processes, and progress assessments (ISTE, 2008). As a result, CTE teachers need to master technological skills to be prepared to teach their students for these changing
environments (ISTE, 2008; Brand, 2008). Because many jobs in the future, especially those within the CTE fields, will involve technology, it is critical for students to have the education and skills to perform in the 21st century workplace (McCoy, 2001; ISTE 2008; Brand, 2008).
4
classrooms (Prawat, 1992; Jacobsen, 2001; Baylor & Ritchie, 2001; Bitner & Bitner, 2002). While administrators can support the use of technology, the adoption of
technology and its integration into the classroom lies in the hands of teachers (Jacobsen, 2001; Bitner & Bitner, 2002). Teachers who ensure these constant technological changes are included in the classroom are critical factors for CTE to produce highly qualified students to enter the workforce.
Researchers have cited CTE teachers as the most active in exploring the potential of using technology in the teaching/learning process and in adopting technology for regular use in instruction (Redmann, Kotrlik, & Douglas, 2003; Bower, 1998; Hutt, 2003; Redmann & Kotrlik, 2004). However, they are not very active in experimenting with technology or with advanced technology integration (Kotrlik, Redmann, & Harrison, 2000; Huitt, 2003; Redmann & Kotrlik, 2004; Kotrlik & Redmann, 2005). For
information technology to be truly effective in education a re-engineering of structure or paradigm shift needs to emerge, one of learning and continued investment in CTE
teachers to be confident in the integration of technology in the teaching and learning process (Ensminger, 2008).
Statement of the Problem
5
face-to-face interactions are becoming obsolete, while the digital networks are creating a new economy of business and increasing rapidly (Atkinson, 2000).
Today’s educators have wider access to computer technology and are beginning to recognize it as a powerful tool in the teaching and learning process (Machnaik, 2002). While this impacts all education, CTE is especially impacted due to the technical nature of the discipline. CTE has evolved from practical education to prepare professionals for the workplace to a field that is highly technologically driven (Lynch, 2000). Technology impacts CTE teachers as they educate students for the workforce. CTE teachers do not only teach technology applied to students’ future roles in the workforce; they are being encouraged to use this technology in their instruction. If teachers are not using and teaching current technology, it places students at a disadvantage when trying to enter the workforce or further their educations (Lynch, 2000).
6
CTE teachers are integrating technology. In other studies of technology adoption (Mellon 1999; Huitt, 2003), there have been links between technology usage and anxieties,
attitudes, beliefs, and experiences. Without understanding what impacts CTE teachers’ technology integration, it is hard to provide effective in-service training, professional development opportunities, and teacher education program preparation. Because the topic of technology for teaching and learning is emerging as one of the forces leveraging educational reform (Jacobsen, 2001), it is critical for those providing professional
development opportunities to understand the perspectives of CTE teachers. Districts face difficulties providing students with the best education to prepare them for the workplace; therefore, research to increase student preparation is imperative to offer students the knowledge they need to succeed.
Statement of Purpose
The purpose of this study was to examine North Carolina CTE instructors’ levels of technology integration and related factors that can be used to predict technology integration, including perceived technology anxieties, barriers, and perceived teaching effectiveness. To assess both the levels of integration and the factors that predict integration, the Kotrlik and Redmann Technology Integration Scale (KRIS) was used. The Technology Acceptance Model (TAM) was used to assess the levels of technology acceptance. This study examined CTE teachers’ integration of technology in the
7
then examined the relationship between the levels of integration and the factors. Finally, the researcher determined if the factors sought to explain technology integration explain a significant proportion of the variance in the level of integration within the CTE
instructors’ classrooms.
Research Objectives
This study utilized a quantitative survey design to examine technology integration by CTE teachers. In addition to describing the sample on basic demographic
characteristics (gender, age, years of experience, education experience), the following research objectives guided the study:
• Research Objective 1 – Describe the level of career and technical educators’
technology integration with the four constructs of integration (exploration, experimentation, adoption, and advanced integration) as measured by the Kotrlik and Redmann Technology Integration Scale (KRIS).
• Research Objective 2 – Describe career and technical educators’ perceptions of
technology usefulness and ease of use in the teaching and learning process, as measured using the Technology Acceptance Model (TAM) developed by Davis (1989).
• Research Objective 3 – Explore the relationships between career and technical
8
• Research Objective 4 – Explore which aspects of demographic variables;
technology integration factors; and perceptions of such factors as technology anxieties, barriers, and teaching effectiveness explain a significant proportion of the variance in technology integration within each of the four levels of technology integration.
Significance of the Study
9
relationship between what is learned in the classroom and what is needed outside of the classroom, and this has been a valuable contribution of the situated learning movement” (Anderson et al., 1996, p. 5).The career focus integrated with technology to prepare them for the workforce often gives students a sense of direction.
Today, information is readily available from numerous sources (ACOT2, 2008). These technology innovations democratize information, giving students direct access to their future knowledge in an organized, indexed, and affordable way, with resources and instruction available around the clock (Lynch, 2000). These changes affect the role of educators even more dramatically (ACOT2, 2008). “Educators must become more than information experts; they must also be collaborators in learning, leveraging the power of students, seeking new knowledge alongside students, and modeling positive habits of mind and new ways of thinking and learning” (ACOT2, 2008). To make these transitions, teachers must be well versed in knowing and using technology. It is important to
understand the current status of the CTE field in terms of integrating technology. Additionally, it is important to understand why CTE teachers are integrating the technology.
Identifying the extent that CTE teachers are integrating technology into their classrooms will contribute to the creation of a CTE teacher profile and development strategies to increase technology integration. Economists are widely pointing out that it is no longer a post-agricultural or post-industrial world (Lynch, 2000). Instead, the
10
where there is still a focus on career education, but the lessons are more general in nature than they are job specific (as cited in Rojewski, 2002, p. 34). Employers are increasingly looking for employees to be able to work effectively, demonstrate competence in general education (reading, writing, calculating, and computing), solve problems, effectively use technology, use interpersonal skills, and work with others (Jacobsen, 2001). This
ultimately leads back to education and the importance of CTE and its role in the new economy.
“In the educational community, the level of technology integration can deeply affect what teachers do and what their student’s experience” (Redmann et al., 2003, p. 30). There has been a plethora of research on the teacher in general and on the use and integration of technology into the classroom (Kotrlik & Redmann, 2004); however, there has been very little research on the CTE teacher. CTE provides students with hands-on, business-related experience that assist in their preparation for the workforce (Jacobsen, 2001). The technologies from CTE afford students the tools to explore, experiment, construct, converse, and reflect on what they are doing, so they can learn from they are doing (Machnaik, 2002). Therefore, it is critical that CTE teachers integrate technology into instruction and the curriculum because it is part of the new economy.
Definition of Terms
The terms defined below are used throughout this study.
11
sometimes referred to as technical education, as the learner directly develops expertise in a particular group of techniques or technology (Public Schools of North Carolina, 2003).
• Career and Technical Teacher Education (Vocational Teacher Education) – “Programs that prepare individuals to teach occupational skills in high schools, trade schools, community colleges, agricultural and technical colleges, adult continuing education programs, armed forces training, and industry” (Collins & O’Brien, 2003, p. 376).
• Teaching/Learning Process – “The implementation of instructional activities that result in student learning” (Redmann & Kotrlik, 2004, p. 78).
• Technology – “Instructional high-tech media such as computers (e-mail, Internet, listervs, CD-ROMs, computer-based software, laser disc players, interactive CDs, 35d) and digital imaging (digital cameras, scanners, digital video, digital
camcorders, etc.)” (Redmann & Kotrlik, 2004, p. 78).
• Technology Integration – “Employing the Internet, computers, software, CD-ROMs, interactive media, satellites, teleconferencing, and other technological means in instruction to support, enhance, inspire, and create learning” (Redmann & Kotrlik, 2004, p. 78).
• Agricultural Education – “Agricultural education in North Carolina employs the phrase ‘food, fiber and environmental systems’ to describe a very broad field, best defined by the National Research Council as, ‘A field that encompasses the production of agricultural commodities, including food, fiber, wood products, horticulture crops, and other plant and animal products’” (Public Schools of North Carolina, 2003).
• Business and Technology Education – “Provides students with meaningful instruction for and about business. Instruction in Business and Information Technology Education encompasses business skills and techniques, an
understanding of basic economics, and business attitudes essential to participate in the multinational marketplace as productive workers and consumers” (Public Schools of North Carolina, 2003).
12
• Family and Consumer Sciences Education – “Prepares students for careers working with individuals and families, as well as for competence in the work of their own families. The concept of work, whether in a family or career, is central to the program area” (Public Schools of North Carolina, 2003).
• Health Occupations Education – “Seeks to meet present and predicted needs for health care workers within a health care delivery system that is characterized by diversity and changing technologies” (Public Schools of North Carolina, 2003). • Marketing Education – “Prepare students for advancement in marketing and
management careers and future studies in community and technical colleges or four-year colleges or universities. It encompasses activities within production, as well as aspects of consumption. It is as specific as procedures for inventory control and, at the same time, as general as the creativity needed in effective promotion.” (Public Schools of North Carolina, 2003).
• Technology Education – “Helps students develop an appreciation and
fundamental understanding of technology through the study and application of materials, tools, processes, inventions, structures and artifacts of the past and present. Technology may be defined as ‘How people modify their natural world to suit their purposes’ (from Technology for All Americans)” (Public Schools of North Carolina, 2003).
• Trade and Industrial Education – “Secondary program to prepare students for careers in six of the ten North Carolina Career Pathways. While completing course sequences in these pathways, students participate in instructional units that educate them in standardized industry processes related to: concepts, layout, design, materials, production, assembly, quality control, maintenance,
troubleshooting, construction, repair and service of industrial, commercial and residential goods and products” ( Public Schools of North Carolina, 2003). • Technology Acceptance Model – “An information theory that models how users
come to accept and use a technology” (Davis, 1989, p. 319).
• Perceived Usefulness – “The degree to which a person believes that using a particular system would enhance his or her job performance” (Davis, 1989, p. 320).
13
Theoretical Framework
Davis’ (1989) Technology Acceptance Model (TAM), shown Figure 1.1,
provided the theoretical framework for this research. This research examined the level of technology integration by CTE teachers based on attitudes, beliefs, and experience. Adapted from the Theory of Reasoned Action (TRA) (Fishbein & Ajzen 1975; Ajzen & Fishbein, 1980), the TAM draws on the theoretical basis of the TRA to specify linkages among beliefs, user attitudes, intentions, and actual behavior. The theory of reasoned action derived from previous research started out as the theory of attitude, which led to the study of attitude and behavior. Hale, Householder, & Greene (2003) state that the theory was “born largely out of frustration with traditional attitude-behavior research, much of which found weak correlations between attitude measures and performance of volitional behaviors” (p. 259).
14
performed the behavior” (p. 127). Miller continues to explain that “a person’s attitude, combined with subjective norms, forms his/her behavioral intention” (p. 127).
People accept or reject information technology for a variety of reasons and tend to use or not use a technology application to the extent they believe it will help them
perform their job better, which is referred to as perceived usefulness (PU) (Davis, 1989; Hale et al., 2003). However, even if users believe that a given application is useful, they may at the same time believe that the system or technology is too hard to use and
therefore do not actively learn how to use the system or technology (Davis, 1989). Davis, Bagozzi, and Warshaw (1992) say “because new technologies such as personal
computers are complex and an element of uncertainty exists in the minds of decision makers with respect to the successful adoption of them, people form attitudes and intentions toward trying to learn to use the new technology prior to initiating efforts directed at using” (p. 670). Attitudes and intentions formed that influence the
performance benefits of usage can out weigh the effort of using the application, this is called perceived ease of use (PEOU) (Davis, 1989). PU and PEOU are the constructs that create the basis of the TAM framework.
15
determinant of PU and is a direct and indirect determinant of attitude (Venkatesh & Morris, 2000). The context of this model explains PU as users’ perceptions of the degree to which using the system will improve their job performance and PEOU as the belief that the system will be free of effort (Davis, 1989). Davis et al. (1989) also proposed that these constructs mediate the effects of external variables.
Figure 1.1
Original Technology Acceptance Model (Davis, et al., 1989, p. 985)
Although the TAM has a similar theoretical structure to the TRA, the theories differ in two key areas:
The subjective norm from the TRA is omitted from the TAM model due to “…its uncertain theoretical and psychometric status.” Second, perceived usefulness, in addition to attitude has a direct effect on behavior intention in the TAM. Finally, the two belief variables, perceived usefulness and perceived ease of use are treated as priorities in the TAM and are two distinct variables influencing attitude towards using (Davis et al., 1989, p. 986).
From multiple disciplinary vantage points, PU and PEOU are indicated as fundamental and distinct constructs that are influential in decisions to use information technology (Davis, 1989). TAM assumes that beliefs about PU and PEOU are always the primary determinants of use decisions (Mathieson, 1991). This was a conscious choice on the part
Perceived Usefulness
Perceived Ease of Use
Attitude Towards Using
Behavioral Intention
16
of Davis et al. (1989), because they wanted to use "a belief set that . . . readily generalizes to different computer systems and user populations" (p. 988, as cited in Mathieson, 1991, p. 179).
Across the literature, researchers have acknowledged the parsimony robustness of the TAM, and the ease with which it can be applied in different situations (Venkatesh, 2000; Chua, 1996; Davis et al., 1989). Researchers have conducted several studies to examine the relationship between PEOU, PU, AT and the usage of other information technologies in recent years (Lederer, Maupin, Sena, & Zhuang, 2000; Venkatesh & Morris, 2000; Szanja, 1994; Adams, Nelson, & Todd, 1992; Davis et al., 1989). Their research has supported the TAM in that PEOU and PU can predict AT; that can predict the usage of that technology. “The research then validates TAM using several different applications including primarily e-mail, voice mail, word processing, and spreadsheets” (Lederer et al., 2000, p. 6). Gaining an understanding of the antecedents of PEOU and PU will enable the development of more meaningful design and training interventions to improve user acceptance and use of information technologies (Venkatesh, 2000).
Davis’s TAM model will be used in this research to study and determine the influence PU and PEOU have on technology integration among CTE teachers.
17
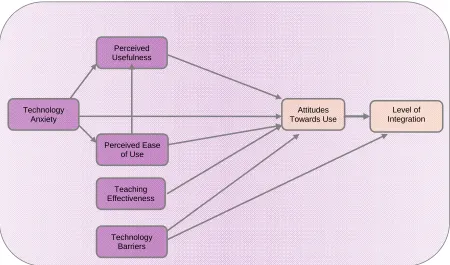
Conceptual Framework
The conceptual framework emerged from the overall framework, the TAM. The TAM examines behavioral intentions that jointly determine individuals’ attitudes towards perceived usefulness. PEOU is a direct determinant of PU and a direct and indirect determinant of attitude (Davis et al., 1989). In the conceptual framework of this study, PU refers to users’ perceptions of the degree to which using the system will improve their teaching and learning processes, and their PEOU that the technology will be effortless (Davis, 1989).
Figure 1.2
Conceptual Framework for the Study Perceived Ease
of Use Perceived Usefulness
Technology Anxiety
Teaching Effectiveness
Technology Barriers
Attitudes Towards Use
18
The conceptual framework shown in Figure 1.2 offers the foundation for the thought process of this study, and shows how the dependent variables (PU, PEOU, technology anxiety, teaching effectiveness, and technology barriers) ultimately affect how teachers integrate technology into their classrooms.
Limitations and Delimitations
Limitations
The study is limited by the sample of secondary CTE teachers. It is also limited by the self-reported perceptions and responses from the CTE teachers. In addition, there is a limitation in the narrow literature regarding CTE teachers and technology integration: such narrow literature often results similar perspectives from the same authors in different studies.
Delimitations
19
CHAPTER TWO
LITERATURE REVIEW
The body of literature on the use and integration of technology in the classroom provided the basis for this study. This study was designed to determine the extent to which CTE teachers are integrating technology into their classrooms. The researcher also sought to determine the variables and factors that influenced integration of technology. CTE teachers’ experiences were examined in relation to the Technology Acceptance Model (TAM) (Davis, 1989) and the Kotrlik and Redmann Technology Integration Scale (KRIS) (Redmann & Kotrlik, 2003).
20
Technology Adoption Versus Technology Integration
Society has embraced computer technology and allowed it to reinvent the ways we create, find, exchange, and even think about information (Pierson, 2001). The teacher of the future must not only be accomplished in instructional techniques and technology, but also in the integration of technology into the curriculum (Pierson, 2001). The following questions arise: what is technology adoption vs. technology integration, why should we integrate and not just adopt, and how do we integrate?
What is Technology Adoption?
Since early in 20th century, various "new" educational technologies have been touted as the revolutionary pedagogical wave of the future (Lohr, 1996). Technologies have been adopted and integrated into the curriculum with varying degrees of success; integrations include classroom films, programmed learning devices, language
laboratories, educational television, computer-assisted instruction, and, more recently, interactive videodisc (Lohr, 1996). Each technology was widely perceived as meeting a need, and each gained a measure of initial commitment of resources from a high-level administrative or legislative entity (Gumport & Chun, 1999). Gumport & Chun (1999) conclude that the adoption and diffusion process generally followed by administrators is what has been termed the "traditional model", a top-down process in which
21
Use of technology in education has been growing in the United States steadily with recent governmental pushes (Thacker, 2007). Computers have traditionally been used by educators to organize and store huge amounts of data, perform research on the internet, supplement classroom instruction, and transmit educational courses via the Internet to students (Thacker, 2007). Budin (1999) reported that teachers did not see computers as part of the normal classroom process and often used them for ancillary activities (as cited in Kotrlik & Redmann, 2005).
There are a number of adoption models, two of the most notable are Rogers’ Diffusion of Innovations and Hall and Louck’s Concerns-Based Adoption Model. These two theories explain technology adoption through stages. Rogers Innovation Decision Process Theory proposes that there are five distinct stages to the process of diffusion. The stages are:
1. Knowledge - when the person or group begins to learn and know about a new innovation
2. Persuasion - the person begins to form attitudes through interactions with others
3. Decision - there is a drive to seek additional information and a decision is made
4. Implementation - as regular use is attempted more information is sought 5. Confirmation - Continued use is justified or rejected based on the evidence of
benefits or drawbacks (Rogers, 1995, p. 36)
22
Hall and Loucks' (1979) Concerns-Based Adoption Model evaluated the lack of teacher investment in innovations. Their model describes the seven levels of concern that teachers experience as they adopt a new practice:
1. Awareness - Teachers have little concern or involvement with the innovation. 2. Informational- Teachers have a general interest in the innovation and would
like to know more about it.
3. Personal- Teachers want to learn about the personal ramifications of the innovation. They question how the innovation will affect them.
4. Management- Teachers learn the processes and tasks of the innovation. They focus on information and resources.
5. Consequence- Teachers focus on the innovation's impact on students. 6. Collaboration- Teachers cooperate with other teachers in implementing the
innovation.
7. Refocusing- Teachers consider the benefits of the innovation and think of additional alternatives that might work even better
(Hall and Louck, 1979, p. 40)
While the above models explain the adoption and diffusion of innovations in general, they are not specific models describing technological innovations. These two models do not engage in the concept of teachers and technology. However, there is research that looks at the implementation of technology in the classroom.
23
1. Entry - teachers struggle to cope with and establish order in the transformed classroom.
2. Adoption - the beginning of adoption into the traditional classroom 3. Adaptation - while traditional teaching methods still predominate, but now
supported with technology
4. Appropriation - with increasing confidence teachers become confident and pedagogically innovative
5. Invention - creativity including active experimentation by teaches and students (Dwyer et al., 1991, p. 48)
This study offered first insights into the technology being used in the classroom; however, the study was limited because Apple sponsored the study. Participants involved were given technology to use and, therefore, were at an advantage to adopt the
technology (Dwyer et al., 1991). This research laid the groundwork for researchers to begin to understand the levels of adoption/integration in classrooms, and Apple has continued research with the ACOT2, Apples’ research from the 2000’s, project.
Over the past 35 years, computers have moved into U.S. schools at an
24
America has long been a bastion of controlling educational approaches (Skinner, 1968). While constructivist models of education have been proposed and propagated in the U. S., educational institutions in this country have been resistant to the significant change that they advocate (Skinner, 1968). The implementation of computers is widely seen as adoption of technology; however, teachers are prone to return to their original pedagogical models and disregard technology.
What is Technology Integration?
Proof exists that computers have been implemented in classrooms since the early 1980’s (Pownell & Bailey, 2002). According to Fabry and Higgs (1997), the Report on the Effectiveness of Technology in Schools reported fifteen years ago; “more that 18.1 million computers were installed in the nations 109,000 public and private K-12 schools” (p. 388). Plomp et al. (2009) found that 100 percent of schools have computers and Internet connections. During the school year of 2004-2005, there were four students for every one computer (Belland, 2009). Even though investments in instructional
technology have increased over the past decade, it does not mean that teachers know how to use the technology (Gaytan, 2006). Therefore, an inference can be made that
computers are in schools, but are not being utilized.
25
Over a decade ago, Dockstader (1999) explained that technology integration is not simply integrating 30 minutes of computer skill time or using application software without a purpose; it is actively implementing the software with a purpose. Dockstader (1999) continued with the idea that defining what technology integration “is and is not is the first step in deciding how to integrate it into the classroom” (p. 73).
Redmann & Kotrlik (2004) define technology integration as “employing the Internet, computers, CD-ROMS, interactive media, satellites, software, teleconferencing, and other technological means in instruction to support, enhance, inspire, and create learning” (p. 4). Barron, Kemker, Harmes, and Kalaydjian (2003) define technology integration as “a tool for research, communication, productivity, and problem solving, with the goal of cross-curriculum attainability” (p. 504). Each of these definitions showcase the complete use if technology to enhance and encourage learning. Computer skills take on new meaning when they are integrated within the curriculum (Jacobsen, 2001).
Global analysts around the world acknowledge the rapid evolution of a
26
must reach a new paradigm of efficiently incorporating technology in every facet of the curriculum to enhance both learning and teaching (Thacker, 2008). Technology
integration should focus organizing the goals of the curriculum and technology into a coordinated and harmonious whole (Redmann & Kotrlik, 2005).
When promoting alternative approaches to learning and teaching, technology can open new channels of innovation to help students meet higher standards and perform at increased levels (George, 2000). Thirteen years ago, the Office of Technology
27
communication tool (Barron et al., 2003, p. 504). Overall the studies found low usage of technology in the classroom.
Technology does not exclusively include computer usage; it also includes other devices. Most related research describes technology simply as the use of a computer, but technology reaches far beyond the computer. Therefore, this study looks at both computer usage and other technological devices that can be integrated into the curriculum.
Compare/Contrast
Both technology adoption and technology integration are methods to increase the use of technology in both the classroom and the workplace. However, technology
adoption refers to “the decision to use specific technology for an intended outcome or purpose” (Ensminger, 2008, p. 333), and technology integration refers to “the specific practices and amount of use that occurs once a technology has been implemented” (Ensminger, 2008, p. 334). Studies of diffusion and adoption assist in explaining the reasons that technology is accepted or rejected in education (Davis, 1989). Properly achieving integration occurs when technology tools support curricular goals, and help students to effectively reach higher expectations. Seamless technology integration creates more actively engaged students. (Redmann & Kotrlik, 2004).
Uses of technology are often grounded in the eighteenth century models of
28
can spearhead serious institutional reform because they create real change (Privateer, 1999). The debate continues today as those in education battle over the importance of implanting technology into the classroom (Deubel, 2007).
Real change can not occur unless there is a paradigm shift from the eighteenth century model of only teaching to the twentieth century model of learning. Society must move from the notion of schooling, which is instilling the basics using lecture and memorization (Deubel, 2007) to a focus on education that incorporates “21st century skills, such as critical thinking and problem-solving skills, computer and technology
skills, and communication” (Deubel, 2007). Privateer (1999) stated over a decade ago, “Innovational uses of technology, grounded in traditional notions of teaching, will not bring about important reforms to education and create first rate learning environments” (p. 62).
Technology is continuously changing. It is an ongoing process. It demands continual learning and change is not always easy. The initial human reaction to change is resistance and resistance makes for slow change, but change is inevitable (Davis, 1989).
Technology Acceptance Model
29
1989). Davis’ TAM model relates specifically to the study and will be the theoretical framework to assess CTE teachers’ integration of technology.
Individuals are constantly making decisions about accepting, adopting, and using computer and information technologies (Venkatesh & Davis, 1996). Research has explored the determinants of these decisions, and has revealed PEOU and PU as key determinants of intention to use (Venkatesh & Davis, 1996). TAM uses two specific beliefs: (a) PEOU, the user’s perception of the amount of effort required to use the system and (b) PU), the user’s perception of the degree to which using the system will improve his or her performance in the workplace (Venkatesh & Davis, 1996). User intentions have proved to be better predictors of system usage than competing predictors, such as realism of expectations, motivational force, value, and user involvement and satisfaction (Venkatesh & Davis, 1996).
Versions of TAM
30
were only used in seven of the studies and only measured PU and PEOU. These two belief variables, PU and PEOU, are central to the original TAM referenced in the theoretical framework (Figure 1.1). In the initial testing by Davis et al. (1989), the AT was omitted due to the casual link between belief and intention. PU and PEOU show a strong link towards behavioral intention to use, even though attitudes towards technology may not be positive (Davis et al., 1989, p. 990).
Venkatesh and Davis (1996) recommended improving the model by incorporating “external variables” as underlying determinants of the belief variables that fully mediate the influence of external variables on the attitude and use variables, as shown in Figure 2.1 below.
Figure 2.1
Final Technology Acceptance Model (Venkatesh & Davis, 1996, p. 453)
External variables examined in research include computer self-efficacy, information, quality, importance of the system, computer anxiety, social influence, perceived
accessibility, training and support, trust, and social presence. Indirectly, external variable can influence attitude, subjective norms, PEOU, or PU (Legris et al., 2003). The research
External Variables
Perceived Usefulness
Perceived Ease of Use
31
performed by Legris et al. research noted that there is no clear pattern with respect to the choice of which external variables are considered in a given study.
Analysis of TAM
In a critical review of the TAM (Venkatesh & Davis, 1996; Chau, 1997;
Venkatesh, 2000; Legris et al., 2003) conclude that the TAM is a useful model. However, it has to be integrated on a broader scale to include variables related to human and social change processes and to the adoption of the innovation model (p. 191). These researchers underline three limits of TAM research: involving students, type of application, and self-reported use (Legris et al., 2003). Legris et al. (2003) reviewed over 30 studies involving the TAM and only nine involved students. And the applications examined were limited to office software or systems development applications, and TAM only actually measures the variance of self-reported use (Legris et al., 2003).
A key purpose of the TAM is to provide a basis for tracing the impact of external variables on internal beliefs, attitudes, and intentions (Venkatesh, 2000). The TAM is a theoretical model that helps in understanding why individuals integrate or reject
32
Review of literature on TAM describes the robustness of the framework and the ease with which it can be applied in different situations (Venkatesh, 2000). In validation of the robustness, several studies have been conducted to confirm its reliability and validity. Through the test-retest method, results showed that correlations between PEOU and PU were high (Hendrikson, Massey, & Cronan, 1993). Szanja (1994) found that the instrument had predictive validity for intent to use and self-reported use. The sum of this research confirms the validity of the instrument and to support its use with different populations of users (Venkatesh, 2000). Chau’s (1997) research supported that PU and PEOU are hypothesized and empirically supported as fundamental determinants of user acceptance.
As the TAM has grown and developed to include subjective norms, it continues to show the significance of perceived use and perceived usefulness on integrating
technology. This instrument can continue to assist in understanding individuals’ perceptions of technology and how to proceed to understand those perceptions.
Kotrlik and Redmann Technology Integration Scale
33
(Zhao & Cziko, 2001). Therefore, the impact of computers on existing curricula is still very limited (Zhao & Cziko, 2001). The TAM and KRIS frameworks can be used together to find common ground and resolution for the resistance to technology in the classroom.
In the educational community, the level of technology integration can deeply affect what teachers do and what their student’s experience (Redmann et al., 2003). With technological advances, many traditional methods of teaching are not as effective or efficient for learners, who now need lifelong skills and the ability to cope with changing work environments (Barron et al., 2003). The importance of teachers’ influence on technology has often been downplayed. Teacher’s enthusiasm toward use of technology can affect students’ feelings toward technology. Developing and encouraging teachers’ technological pedagogical content knowledge (TPCK) can increase technology
perceptions (Mishra & Koeheler, 2005). Teachers have both content knowledge and pedagogical knowledge (West & Graham, 2007). But there is also knowledge about how to use educational technologies effectively to teach a particular content area, and this is the area of TPCK that schools should invest in developing (West & Graham, 2007).
34
their research. Kotrlik and Redmann (2004) define technology integration as "employing the Internet, computers, CD-ROMs, interactive media, satellites, teleconferencing, and other technological means in instruction to support, enhance, inspire and create learning" (p. 77). The researchers also include that the implementation of technology will be influenced by the teaching and learning process. The teaching/learning process is defined as the implementation of instructional activities that result in student learning (Redmann & Kotrlik, 2004).
Kotrlik and Redmann’s first influence in creating the technology integration scale was from the research of Ringstaff et al. (1991), who worked on the Apple Classrooms of Tomorrow (ACOT) project. The project was a research and development collaboration among public schools, universities, research agencies, and Apple Computer, Inc. The study examined the role of both teachers and students as they adapted to teaching and learning in technology-rich classrooms (Ringstaff et al., 1991). The researchers looked at change over time with respect to teaching strategies and student learning. Consistent with research on classroom innovation, teachers in ACOT classrooms continued to rely on traditional teaching strategies during the early years of the project, despite radical physical changes in their classrooms (Ringstaff et al., 1991). By collecting data over an extended period of time, however, research showed gradual shifts in teachers’ beliefs about learning and teaching, and the consequences these changing beliefs had on
35
While reformers argue about the most efficient way to promote school change, one consistent finding is that, whatever its form, the process of educational change is typically slow and painstaking (Ringstaff et al., 1991). Increasing attention is being paid to the idea that lasting change in the classroom must be accompanied by changes in teachers’ beliefs about the purpose and nature of instruction, and that these belief systems are remarkably resistant to change (Redmann & Kotrlik, 2004). To assist with the notion of change in the classroom, the researchers labeled the stages of instructional evolution in the ACOT classrooms as mentioned previously in the review: entry, adoption, adaptation, appropriation, and invention (Ringstaff et al., 1991, p. 5). These stages show the process that teachers and students went through as they progressed through the study and utilized the technology. These stages were also used in the development of a technology
integration scale versus a technology adoption scale.
Kotrlik and Redmann also used Russell’s stages of technology adoption and email as a basis for their model. Russell (1995) evaluated the six stages adult learners pass through as they become confident in the adoption of technology looking to determine how adult students learn new technologies. The relevance of the computing experience can
36
necessity for students to develop a knowledge base and to assimilate new learning into an existing model. Russell’s six stages offer a formal developmental schema for how naive email learners develop and increase their confidence in using the new technology until the technology becomes background to the relevant task at hand (Russell, 1995, p. 175). From this research, Kotrlik and Redmann were able to develop a model that would be applicable to understanding the integration of a variety of technologies in the teaching and learning process to expand from Russell’s research on the use of email.
Because the base literature revolves mainly on computer implementation/adoption and email use, Kotrlik and Redmann formulated their model to include all areas of technology. Technology has grown to encompass much more than just computers and, therefore, requires a modified model to discuss both adoption and integration of the technology. Through research on the use of technology, Kotrlik and Redmann deducted several factors that can or will influence the integration of technology. These factors include perceived integration barriers, perceived teaching effectiveness, technology anxiety, training sources, and technology availability (Redmann & Kotrlik, 2004). After the researcher’s review of the literature, these factors revealed the most potential for explaining teachers' technology integration. To evaluate these factors, the
37
1. Exploration – Thinking About Using Technology. Teachers seek to learn about technology and how to use it.
2. Experimentation – Beginning to Use Technology. Physical changes start to occur in classrooms and laboratories. Instructors focus more on using technology in instruction by presenting information using presentation software and doing a few instructional exercises using spreadsheets, databases, word processors, games, simulations, the Internet, and/or other technology tools.
3. Adoption – Using Technology Regularly. Physical changes are very evident in the classroom and/or laboratory with technology becoming a focal point in the classroom and/or laboratory organization. Instructors employ presentation software and technology-based instructional exercises using games,
simulations, spreadsheets, databases, word processors, the Internet or other technology tools as a regular and normal feature of instructional activities. Student-shared responsibility for learning emerges as a major instructional theme.
4. Advanced Integration – Using Technology Innovatively. Instructors pursue innovative ways to use technology to improve learning. Students take on new challenges beyond traditional assignments and activities. Learners use
technology to collaborate with others from various disciplines to gather and analyze information for student learning projects. The integration of
technology into the teaching/learning process leads to a higher level of learning. (Redmann et al., 2003, p. 34)
38
learning paradigms. Educators can place themselves in one of the phases and understand the technological abilities associated with the phase.
The scales and all demographic items for the KRIS were developed by Kotrlik and Redmann. The face and content validity of the instrument were evaluated by an expert panel of educators, university faculty, and teachers enrolled in doctoral programs (Redmann et al., 2003; Redmann & Kotrlik, 2004; Kotrlik & Redmann, 2005). Changes were made by a validation panel and after the pilot test. Robinson, Shaver, and
Wrightsman’s standards for reliability of Cronbach’s Alpha, from their 1991 book
Measure of Personality Social Psychological Attitudes, were used to evaluate the factor’s
reliability (Redmann & Kotrlik, 2004). From these scales, the factors showed excellent reliability and were as follows: “Technology Integration Scale - .93; Exploration subscale - .82, Experimentation subscale - .95, Adoption subscale - .97, Advanced Integration subscale - .88, Barriers scale - .87, and Teaching Effectiveness scale - .90” (Redmann & Kotrlik, 2004, p. 37).
Through this scale, researchers can evaluate where teachers are in the technology integration process and use the knowledge to create learning opportunities. Kotrlik and Redmann have created a simple and easily-understood framework that evaluates a variety of technological devices and can be used to change the way technology is integrated into education at the secondary and the university levels. Limitations from the scale include restrictions in study location; however, the limitation opens opportunities for further use of the scale throughout the United States. The limitation also provides additional
39
Technological History and Education
Fulton (1999) described technology adoption in classrooms as a half-filled glass of water. Optimists look at the glass as half full, but others see the glass half empty. An optimistic view shows that schools have computers with a ration of around six students per computer (Fulton, 1999). According to Becker (1998), nationally, 43 percent of school computers are located in computer labs, compared to 48 percent in classrooms. As of 1998, 90 percent of schools are wired for Internet access and 30 percent of teachers have access to the Internet in their classrooms (Becker, 1998).
On the less optimistic side, a survey by Education Week found that 40 percent of teachers reported that students do not use technology at all during a typical week (Fulton, 1999). Another 30 percent said their students only use technology for approximately one hour each week (Fulton, 1999). Teachers, administrators, and parents are finding that using technology requires more than adding Internet access or placing computers in a classroom. Technology affects the ways teachers teach, students learn, and administrators operate (Norum, 1999). Roles and teaching and learning strategies are changing because technology fosters the use of more student-centered learning strategies (Norum, 1999). The trend and history of technology shows the vast and rapid changes that technology has offered to education.
40
captain’s hat to showcase a story about a calculator built for the Navy (Campbell-Kelly & Aspray, 2004). Technology even played a role in 1890 when the punched card tabulating machine was created (Campbell-Kelly & Aspray, 2004; Brown & Presley, 2003). These inventions are markings of the long history of technology.
Molnar (1997) contends the history of computers in education has been variously characterized as an “accidental revolution” (p.63). “The arrival of new technologies for education has often been accompanied with bold predictions for its transformation but this can also conjure up a collective sense of social deja vu” (Gumport and Chun, 1999, p. 6). History has shown the slow acceptance and benefits of technology. Some predicted that the spread of television would eliminate illiteracy and the Ford foundation predicted it as the “the greatest opportunity for the advancement of education since the introduction of printing by moveable type” (Gumport and Chun, 1999). But television did not do all that was predicted because it took decades for education to see the full advancement of television. This same course continues to be followed as new technology emerges. Pownell and Bailey (2002) contend that there are four predominant waves in the revolution of computers in education beginning in the 1960s and progressing until the present, with each decade bringing forth new technologies, but none as quick as our current decade.
The mainframe computer, which was introduced in the 1960s and 1970s,
41
postsecondary schools. Later, mainframes were used for computer assisted instruction and tutorials” (Pownell & Bailey, 2002, as cited in Chapman, 2003, p. 23). Although there was some infiltration of the mainframe into educational facilities, the majority of computer use was for scientific and military applications (Campbell-Kelly & Aspray, 2004). The personal computer Altair was developed in the 1970s.
Elements that we take for granted today, such as having a computer on our desk that is equipped with a monitor and a mouse, were not conceivable until the 1970s (Campbell-Kelly & Aspray, 2004). In 1970, Marcian Hoff, an engineer at Intel Corporation invented the microprocessor, which was an entire CPU on a single chip. With this, the microcomputer, or personal computer, was born in 1975 (Brown & Presley, 2003). In 1976, Stephen Wozniak and Steven Jobs designed and built the first Apple computer (Brown & Presley, 2003). “The Macintosh Apple computer was the first to use a Graphical User Interface (GUI), which provided a visual output instead of text output commands and made the computer easier to use” (Newby, Stepich, Lehaman, & Russell, 2000, as cited in Chapman, 2003, p. 23). Not far behind the introduction of the Apple computer, IBM designed and produced the IBM-PC (Personal Computer) (Brown & Presley, 2003). This created direct competition and a market for personal computer use. The 1970s introduced the microchip, GUI, and the personal computer, which classifies the decade as the second wave of technology revolution (Pownell & Bailey, 2002).
42
facilities worked. According to Pownell and Bailey (2002), this error created the third wave of the technology revolution. This wave crossed decades including the 1980s and 1990s and involved the Internet and the World Wide Web. Although the Internet had been around since 1969, when the government created it as a better way to move
information, it did not become available to the public until the 1990s (Leiner et al., 2003). To facilitate communication between the U.S. Department of Defense and military
researchers, the department created a set of networks call ARPAnet (Advanced Research Projects Agency Network) (Brown & Presley, 2003). In the late 1980s, the military portion of ARPAnet became known as MILnet and the National Science Foundation funded a non-military network called NSFnet (Brown & Presley, 2003). Thousands of government, academic, and business computer networks were given remote access to NSFnet and, by the late 1980s, the term Internet was used to describe the information superhighway that was developed (Leiner et al., 2003).
“Just beginning is the fourth wave of the revolution of computers and this includes all the wireless, hand held devices, and other small computer oriented
electronics” (Pownell and Bailey, 2002, as cited in Chapman, 2003, p. 26). Smaller, more powerful electronics that can be transported and used in any capacity are the next
43
computers depends largely on how teachers embrace and use computers (Fabry & Higgs, 1997).
The past decades have created waves of technology development and, through technology, new teaching methods have emerged. The goal of this study is to examine constructs that influence technology integration and determine where CTE teachers fall within each of the four levels of technology integration.
Constructs Influencing Technology Integration
Bandura (1986) contends that recognition of individuals’ beliefs are closely linked with the decisions and choices that they make during the choices inherent in everyday life. Davis (1989) extends this notion with his belief that perceptions of use and ease of use influence how individuals will accept or reject a new technology. A body of research on individual beliefs and educators suggest that the beliefs teachers hold directly affect both their perceptions and judgments of teaching and learning (Clark & Peterson, 1986; Clark & Yinger, 1987; Fulton, 1999; Redmann & Kotrlik, 2004; Ertmer, 2005;
Ensminger, 2008). This study will examine the following constructs: gender, years of experience, perceived teaching effectiveness, technology anxiety, and barriers to integrating integration.
Gender and Technology Integration
44
using new technologies (Venkatesh & Morris, 2000). Outside of the information systems research, a significant body of information exists supporting the general viewpoint that social influence and gender do, indeed, play a critical role in influencing behaviors in a wide variety of domains (Venkatesh & Morris, 2000, p.116). Psychology research studying gender differences in decision making processes indicates that schematic processing by women and men is different (Bem and Allen, 1974; Wajcman, 1991). Therefore, gender schemas can be considered a normative guide that causes unconscious or internalized action (Venkatesh & Morris, 2000, p. 117). Bem and Allen (1974) argue that women and men encode and process information using different socially constructed cognitive structures that, in turn, help determine and direct individuals’ perceptions (as cited in Venkatesh & Morris, 2000).
45
Women's profound alienation from technology is accounted for in terms of the historical and cultural construction of technology as masculine... If technical competence is an integral part of masculine gender identity, why should women be expected to aspire to it? (Wajcman, 1991, p. 22)
Wajcman’s passion for gender becomes clear from the statement above. The gender slant towards boys/men to be more inclined to want to learn and understand computers,
ultimately costs women an equal chance of wanting to aspire to use technology.
The literature discussed thus far shows a profound difference between males and females and their relationships with technology, where males have been found to use technology more. However, the literature is also a bit controversial. Results from
researchers Spotts et al. (1997) showed that males rated their knowledge and experience with some innovative technologies higher than females ranked themselves. But, regarding frequency of use, no significant differences were found, with the exception of video, where females indicated slightly more frequent use. Both rated technologies as important to instruction (p. 421). Kotrlik and Smith’s (1989) research found no significant
46
However, when doctoral students were surveyed, men demonstrated more comfort with a computer and the Internet (Ray et al., 1999).
Research shows contradictory evidence of gender influence on technology integration (Kotrlik & Smith, 1989; Spotts et al., 1997; Ray et al., 1999). However, the literature does not focus specifically on CTE teachers; therefore, gender could be a factor in determining whether a CTE teacher will integrate technology. This study will seek to evaluate this construct and its significance in technology adoption.
Years of Experience
47
Dexter, Anderson, & Becker (1999) found that teachers with less than 10 years of experience were more likely to change and adapt to new ideas. Veteran teachers made changes as well, but these were more slight and gradual. One of the veteran teachers in the study stated:
When I started out (integration technology) I was insecure, and, as such, I wanted to dominate the classroom. I still believe that the teacher should be organized in the classroom, but I think that he can organize his classroom in such a way that there is a lot more student participation. The easiest way to control a class is simply to lecture and run through [the material]. In many ways the kids think that is a great education…But they are very, very, passive and they are not active… (Dexter, Anderson, & Becker, 1999, p. 9)
The quote above shows the significance of an educator making a change to implement technology. Although insecurities, resistance, and pedagogy created barriers at first, the paradigm began to shift to when more students became more active. Teachers will need a period of time working and adjusting to technology before they become proficient. The years of experience with computers can go hand-in-hand with years of experience. Hadley and Sheingold (1993) contend that teachers need five to six years working with technology to develop expertise, and, when the teachers reach this level, they change their instructional strategies in the classroom environment.
Perceived Teaching Effectiveness
The specific relationship of technology integration to teachers’ perceived teaching effectiveness has not been directly addressed in the literature beyond the research