A Study on Reverse Top-K Queries Using
Monochromatic and Bichromatic Methods
S.Anusuya
1, M.Balaganesh
2P.G. Student, Department of Computer Science and Engineering, Sembodai Rukmani Varatharajan Engineering
College, Vedharaniyam, Tamil Nadu, India1
Associate Professor, Department of Computer Science and Engineering, Sembodai Rukmani Varatharajan Engineering
College, Vedharaniyam, Tamil Nadu, India2
ABSTRACT: Normally Top-k queries are widely used for retrieving a ranked set of ‘k’ most objects based on the individual user preferences. As an example in online market places customer typically search a ranked set of products that satisfy their needs. From the perspective of a manufacturer, it is imperative that her products appear in the highest ranked positions for many different user preferences. Otherwise the product is not visible to the potential customers. In this paper, we propose a query type namely reverse top-k which leads to a query type that instead returns the set of customers those find a product that belongs to the top-k result of their preferences. It is necessary for the manufacturer to know the market condition based on the competition. The two versions of the proposed query are monochromatic and bichromatic which are introduced in this paper. In monochromatic a geometric interpretation is provided to acquire an intuition of the solution space. In case of bichromatic two query processing techniques are introduced, namely an efficient threshold based algorithm and an algorithm based on materialized reverse top-k views.
KEYWORDS:top-k query, reverse top-k query, user preferences, linear query functions.
I.INTRODUCTION
In fact, ranked queries have been studied extensively in database literature due to their popularity in many applications, such as decision making, recommendation rising, and data mining tasks. Many proposals have been made in order to
improve the efficiency in answering ranked queries. Now a day’s most applications return to the user only a limited set
of data points that are interesting for the user, therefore it is very important for a manufacturer that her products are returned in the highest ranked positions for as many different user preferences as possible. However the existing work studies only top-k queries from the perspective of customers that seek products matching with their preferences. In this paper, we study reverse top-k queries for business analysis. From the perspective of manufacturers who are interested in the impact of their products to customers, compared to their competitors existing products. Given potential products which are the user preferences for which this product is in the top-k query result set? For this, we propose reverse top-k queries and study two versions of the query monochromatic and bichromatic techniques. In monochromatic there is no knowledge of user preferences and the manufacturer aims to estimate the impact a potential product would have on the market. In bichromatic, a dataset with user preferences are given. The reverse top-k query returns those preferences that rank a potential product highly.
are used to identify whether a point belongs to the reverse skyline or not. Through extensive experiments with both real-world and synthetic datasets, show that our algorithms can efficiently support reverse skyline queries. The enhanced approach improves reversed skyline processing by up to an order of magnitude compared to the algorithm without the usage of pre-computed approximations.
Monochromatic and Bichromatic Reverse skyline search [6] explains Reverse skyline queries over uncertain databases have many important applications such as sensor data monitoring and business planning. Due to the existence of uncertainty in many real-world data, answering reverse skyline queries accurately and efficiently over uncertain data has become increasingly important. In this, model the probabilistic reverse skyline query on uncertain data, in both monochromatic and bichromatic cases, and propose effective pruning methods to reduce the search space of query processing. Moreover, efficient query procedures have been presented seamlessly integrating the proposed pruning methods. Extensive experiments have demonstrated the efficiency and effectiveness of our proposed approach with various experimental settings. Evaluating top-k queries [14] explains that the threshold algorithm read all grades of an
object once seen from a sorted access. Here no need to wait until the lists give ‘k’ common objects. The sorted access
is repeated until the top-k answer is seen. The threshold algorithm performs more random access than Fagin algorithm. It performs (m-1) random access for each object. It requires only bounded buffer space. Top-k query processing [8] explains that a query in a multimedia database means combining graded attributes by using aggregation function. The
aggregation function gives overall grade of object and return ‘k’ objects with highest overall grade. Top-k query
processing means finding ‘k’ objects that have the highest overall grades. For that the algorithms like, Fagin algorithm
and threshold algorithm are used.
.
The work in this paper is divided in two Methods. 1) Monochromatic2) Bichromatic. In the proposed system user express their preferences through linear top-k queries. Preferences are defined by assigning weight to each of the scoring attributes, indicating the importance of each attribute to the user. From the perspective of manufacturer, it is important that a product is returned in the highest ranked position for as many user preferences as possible. Estimate the impact of a product compared to their competition products. Advertise the products to potential customer.. A novel
query type namely reverse top – k query is defined. The two versions of reverse top-k query are used, namely
monochromatic and bichromatic. In monochromatic there is no knowledge of user preferences is required and the aim is estimate the impact of a potential product in the market. Analyse the geometric properties for two-dimensional case of monochromatic reverse top-k query and provide the algorithmic solution. In case of bichromatic a data set with user preferences are given and a reverse top-k query returns those preferences that rank a potential product highly. Here an
efficient and progressive threshold – based algorithm called Reverse top – k threshold algorithm is introduced.
II. PROPOSED SYSTEM
In the proposed system user express their preferences through linear top-k queries. Preferences are defined by assigning weight to each of the scoring attributes, indicating the importance of each attribute to the user. From the perspective of manufacturer, it is important that a product is returned in the highest ranked position for as many user preferences as possible. Estimate the impact of a product compared to their competition products. Advertise the products to potential
customer.. A novel query type namely reverse top – k query is defined. The two versions of reverse top-k query are
used, namely monochromatic and bichromatic. In monochromatic there is no knowledge of user preferences is required and the aim is estimate the impact of a potential product in the market. Analyse the geometric properties for two-dimensional case of monochromatic reverse top-k query and provide the algorithmic solution. In case of bichromatic a data set with user preferences are given and a reverse top-k query returns those preferences that rank a potential product
highly. Here an efficient and progressive threshold – based algorithm called Reverse top – k threshold algorithm is
introduced.
III. PROBLEM DEFINITION
Recently, the support for rank-aware query processing has attracted much attention in the database research community. Top-k queries retrieve only a ranked set of k objects that best match the user preferences, thus avoiding overwhelming
result sets. Since most applications return to the user only a limited set of ranked results based on the individual user’s
users express their preferences through linear top-k queries, which are defined by assigning a weight to each of the scoring attributes, indicating the importance of each attribute to the user. This model is in agreement with the notion of preference and is widely adopted in related work. A novel query type, namely the reverse top-k query, which can be
expressed as follows: “Given a potential product, which are the user preferences for which this product is in the top-k query result set? The two versions of the query are: monochromatic and bichromatic reverse top-k queries. In the former, there is no knowledge of user preferences and the aim is to estimate the impact of a potential product in the market. In the latter, a data set with user preferences is given and a reverse top-k query returns those preferences that rank a potential product highly.
IV.REVERSE TOP QUERIES
A reverse top-k query(RTOPK) is defined by a user specified product ‘p’ and returns the weighting vectors ‘w’ for
which p is in the top-k result set. Reverse top-k queries are essential for manufacturers to assess the impact of their products in the market based on the competition. The versions of reverse top-k queries are Monochromatic and Bichromatic. The geometric interpretation of the monochromatic reverse top-k query is provided to acquire the intuition of the solution space. Here, there is no knowledge of user preferences and a manufacturer aims to estimate the impact of the product on the market. It returns partitions of the solution space, when no user preferences are given but the distribution of them is known. The bichromatic identifies user those who are interested in a particular product by giving a known set of preferences. For bichromatic the following techniques namely efficient threshold based algorithm and an algorithm based on materialized reverse top-k views are used.
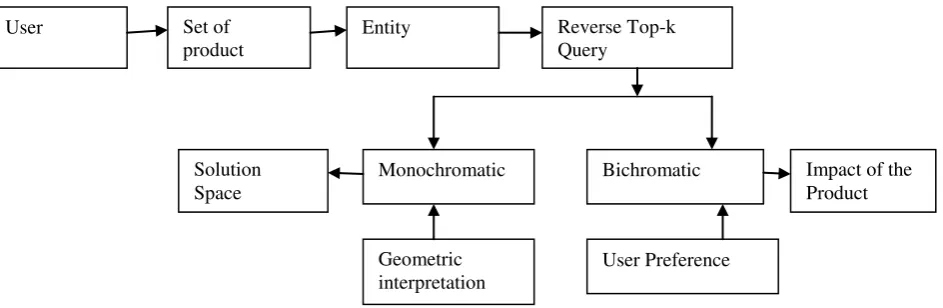
Fig 1 Data Flow Diagram of the Proposed System
Above figure shows the data flow diagram of the proposed system, in which set of products are the products in the market and based on the user preferences the impact of the product is found. If the geometric interpretation is provided then the monochromatic provide the intuition of the solution space.
V.MONOCHROMATIC QUERIES
The monochromatic queries are defined that, given a point q, a positive number k and a dataset S, the result set of the
monochromatic reverse top-k query is the locus for which there exists p in TOPk(wi) such that fwi(q) ≤ fwi(p). Given a
dataset S, monochromatic reverse top-k query returns all weighting vectors w, for which query point q ∈ TOPk (w). Let
us assume that W denotes the set of all valid assignments of w. It is not possible to enumerate all possible assignments
of w ∈W, since the number of possible vectors w is infinite. On the other hand, the solution space W can be split into a
finite set of partitions Wi ( Wi = W, Wi = ∅), such that query point q has the same ranking position for all the weighting
vectors w ∈ Wi. Then, the result set of the monochromatic reverse top-k is a set of partitions Wi of the solution space
W. The solution space W can be split into a finite set of non-adjacent partitions such that query point q has the same
User Set of
product
Entity Reverse Top-k
Query
Monochromatic Bichromatic
Solution Space
Impact of the Product
Geometric interpretation
rank for all the weighting vectors. The monochromatic version identifies partitions of the solution space that satisfy the query. And it is useful for business analysis to estimate the impact of a product when no user preferences are given but the distribution of them is known.
VI.BICHROMATIC QUERIES
The bichromatic is defined as follows, given a point q and a positive number k, as well as two datasets S and W, where
S represents data points and W is a data set containing different weighting vectors, a weighting vector wi ∈ W belongs
to the bichromatic reverse top-k result set of q, if and only if ∃p ∈ TOPk(wi) such that fwi (q) ≤ fwi (p). For a
bichromatic reverse top-k query, two datasets S and W are given, where S contains the data points and W the different
weighting vectors that represent user preferences. Then, the aim is to find all weighting vectors wi ∈ W such that the
query point q ∈ TOPk(wi). Here we use a threshold based algorithm for bichromatic reverse top-k query, which
discards the weighting vectors that cannot contribute to the result set, without evaluating the corresponding top-k queries. Based on the user preferences the impact of the product in the market is found.
VII.THRESHOLD BASED METHOD
For bichromatic a threshold based method is used. It reduces the number of top-k evaluations by discarding weighting vectors. RTA sorts the weighting vectors based on pair wise similarity. Top-k queries are defined by similar vectors, and have similar result sets. First evaluate the top-k query, and calculate a threshold. For each weighting vector there may be possibly a prune based on threshold and refine the threshold. In each repetition a threshold is set based on the previously computed top-k result sets; in order to discard the next weighting vectors without top-k query evaluation. RTA is used for processing reverse top-k queries for arbitrary data dimensionality.RTA discards candidate user preferences without processing the respective top-k query processing. In addition to that an indexing structure based on space partitioning which materializes reverse Top-k views in order to further improve reverse top-k query processing. This method consistently out performs a brute force algorithm by one to three orders of magnitude in terms of required number of top-k evaluations. Numerical non negative values are considered for weights. Smaller scoring values are preferable.RTA aims to reduce the number of top-k query evaluations, based on the observation that top-k queries defined by similar weighting vectors return similar results. Hence RTA exploits already computed top-k result sets to avoid evaluating weighting vectors that cannot be in the reverse top-k result set. Therefore, in each repetition a threshold is set based on the previously computed top-k result set P. Given a set of points P, the maximum value corresponds to the worst scoring value for any point in the set based on wi and is used as a threshold during the reverse top-k evaluation. Initially RTA computes the top-k result for the first weighting vector that belongs to the result set and kept in main memory buffer. The score of the query point q based on the vector wi is computed and compared against buffer value and if it is not greater than wi buffer, then wi is added to the result set. Before, we take the next weighting
vector (wifl) and we set the threshold equal to the wifl.
VIII. EXPERIMENTAL EVALUATIONS
In this section, we present an extensive experimental evaluation of reverse top-k queries. All methods are implemented in c# .net and run on a 3 GHz Dual Core AMD processor equipped with 2GB RAM. The block size is 8KB. As far as the data set S is concerned both real and synthetic data collections are used. For the uniform data set, all attribute values are generated independently using a uniform distribution. We evaluate the performance of RTA; the RTA performs more random access than Fagin algorithm. The TA performs (m-1) random access than Fagin algorithm. The TA is equal to instance optimal for every monotone aggregation function, over every database (excluding wild guesses) also,
it is optimal in much stronger sense than Fagin’s Algorithm If it is a strict monotone aggregation function then, the
Optimality ratio = m + m (m-1)cR/cs and it is a best possible (m = # attributes) one. If random access not possible (cr =
0) then, the optimality ratio = m. If sorted access not possible (cs = 0) then, the optimality ratio is equal to infinite. The
IX. CONCLUSIONS
By using the Reverse top – k queries the potential impact of a product is found. In this proposed system reverse top-k
query is introduced which retrieves all weighting vectors for which the query point belongs to the top-k result set. The proposed query type is important for market analysis and for estimating the impact of a product based on the user preferences and the competitors products. The two versions of Reverse top-k query Monochromatic and Bichromatic are studied. For monochromatic reverse top-k query only a data set of products is given. For bichromatic reverse top-k query a set of weighting vectors is also available. Thereafter, we present an efficient threshold based algorithm for computing bichromatic reverse top-k queries, which discards candidate user preferences, without the need to evaluate the associated top-k query. The experimental evaluation demonstrates the efficiency of the proposed algorithms.
REFERENCES
[1] Akbarinia, R. Pacitti, E. and Valduriez, P.(2007), ‘Best Posit. Akbarinia, R. Pacitti, E. and Valduriez, P.(2007), ‘Best Position Algorithms for Top-k Queries’ Proc. Very Large Data Bases (VLDB).
[2] Chang, Y.-C. Bergman, L.D. Castelli, V. and Smith, J.R.(200), ‘The Onion Technique: Indexing for Linear Optimization Queries’ Proc. ACM SIGMOD.
[3] Dellis, E. and Seeger, B.(2007), ‘Efficient Computation of Reverse Skyline Queries’ Proc. (VLDB ’07).
[4] ] Hristidis, V. Koudas, N. and Papakonstantinou, Y.(2001), ‘A System for the Efficient Execution of Multi-Parametric Ranked Queries’ Proc. ACM SIGMOD.
[5] Korn, F. and Muthukrishnan, S.(2000), ‘Influence Sets Based on Reverse Nearest Neighbor Queries’ Proc. ACM SIGMOD.
[6] ] Lian, X. and Chen, L. (2008), ‘Monochromatic and Bichromatic Reverse Skyline Search overUncertain Databases’ Proc. ACM SIGMOD. [7] ] Rosenkrantz, D.J. Stearns, R.E. and Lewis II, P.M.(1977), ‘An Analysis of Several Heuristics for the Traveling Salesman Problem’ SIAM J.
pp. 563-581.
[8] Ronald Fagin, Amnon, L and Moni Naor (2011), ‘Top-k query processing’
[9] Vlachou, A. Doulkeridis, C. Kotidis, Y. and Norvag, K.(2010), ‘Reverse Top-k Queries’ Proc. IEEE 26th Int’l Conf. Data Eng. (ICDE) [10] Vlachou, A. Doulkeridis, C. Nørva°g, K. and Kotidis Y.(2009), ‘Identifying the Most Influential Data Object and swith Reverse Top-k Queries’
Proc. Very Large Data Base Endowment.
[11] Wan Q. Wong, R.C.-W. Ilyas, I.F. and Peng, Y.(2009), ‘Creating CompetitivProducts’ Proc. Very Large Data BaseEndowment
[12] Xin, D. Chen, C. and Han, J. (2006), ‘Towards Robust Indexing for Ranked Queries’ Proc. 32nd Int’l Conf. Very Large Data Bases
(VLDB ’06).
[13] L. Zou and L. Chen, “Dominant Graph: An Efficient Indexing Structure to Answer Top-k Queries,” Proc. IEEE 24th Int’l Conf.Data Eng.
(ICDE ’08), pp. 536-545, 2008.
[14] ] A. Marian, N. Bruno, and L. Gravano, “Evaluating Top-k Queries over Web-Accessible Databases,” ACM Trans. Database Systems, vol. 29, no. 2, pp. 319-362, 2004.