Scholarship@Western
Scholarship@Western
Electronic Thesis and Dissertation Repository
1-28-2013 12:00 AM
Simplified Tools for Performance-Based Design of Reinforced
Simplified Tools for Performance-Based Design of Reinforced
Concrete Frames Exposed to Fire
Concrete Frames Exposed to Fire
Salah El-Din F. El-Fitiany The University of Western Ontario
Supervisor
Dr. Maged A. Youssef
The University of Western Ontario
Graduate Program in Civil and Environmental Engineering
A thesis submitted in partial fulfillment of the requirements for the degree in Doctor of Philosophy
© Salah El-Din F. El-Fitiany 2013
Follow this and additional works at: https://ir.lib.uwo.ca/etd
Part of the Structural Engineering Commons
Recommended Citation Recommended Citation
El-Fitiany, Salah El-Din F., "Simplified Tools for Performance-Based Design of Reinforced Concrete Frames Exposed to Fire" (2013). Electronic Thesis and Dissertation Repository. 1151.
https://ir.lib.uwo.ca/etd/1151
This Dissertation/Thesis is brought to you for free and open access by Scholarship@Western. It has been accepted for inclusion in Electronic Thesis and Dissertation Repository by an authorized administrator of
(Integrated Article)
by
Salah El-Din Farouk El-Fitiany
Graduate Program in Civil and Environmental Engineering
A thesis submitted in partial fulfillment of the requirements for the degree of
Doctor of Philosophy
The School of Graduate and Postdoctoral Studies The University of Western Ontario
London, Ontario, Canada
ii
Abstract
Fire safety of Reinforced Concrete (RC) buildings is an important design aspect that ensures structural integrity during fire events. As new codes are moving from prescriptive methods towards performance based design and full scale experiments and numerical simulations are expensive and time consuming. Practitioners are in need of rational design tools to assess the strength and serviceability of individual RC elements and the structure as a whole during a fire event. This thesis provides such tools for RC frames.
A previously developed sectional analysis method is extended to cover RC beams subjected to fire from three sides. An extensive parametric study is conducted to propose simple equations expressing the equivalent stress-block parameters at elevated temperatures. These equations can be utilized by designers to estimate the flexure capacity of RC beams exposed to fire.
A novel method to track the behavior of continuous RC beams during standard fire exposure is proposed and validated. The proposed method is based on separating the effects of thermal deformations and vertical loads. The effective flexural stiffness and the thermal deformations of fire-exposed RC beams are estimated using simple expressions that are developed based on a comprehensive parametric study. Designers can apply the proposed method to assess the structural fire safety of RC continuous beams.
A simple method to construct the full interaction diagram of RC columns exposed to fire is developed and validated. An existing simplified heat transfer method is extended to predict the average temperature distribution. A number of reasonable approximations are assumed to allow reaching a closed form solution for the concrete compressive forces that correspond to a specific strain distribution. The closed form solution provides formulas that engineers can use to sketch the interaction diagrams.
iii
Keywords
iv
They will ask thee concerning the Spirit. Say: "The Spirit is by
command of my Lord, and of knowledge ye have been vouchsafed but
little."
Holy Quran, Chapter 17,
Verse 85
To my wonderful parents, Enas, Farouk, Wafaa, and Ahmed To my beloved wife Marwa
To my beautiful daughter Laila To my siblings Eman, Omar, and Mohamed
And,
v
Co-Authorship Statement
vi
Acknowledgments
I am deeply thankful to Dr. Maged Ali Youssef for his supervision, guidance, and care during my research program. Dr. Youssef has devoted a lot of his time as a research advisor and mentor to me during my doctoral studies. During the past five years, we’ve had a meeting nearly every week even when he was travelling or on vacation. Dr. Youssef’s enthusiasm and encouragement not only contributed to my technical development but also helped me in terms of personal growth.
The Natural Science and Engineering Research Council, the Government of Ontario, and the University of Western Ontario all provided me with financial support.
I’d like also to thank my late colleague, Mr. Mohamed Moftah, for sharing his knowledge and valuable references in structural fire safety with me which was really helpful to me. I gratefully acknowledge the assistance provided by Ghaly, Dessouki, Hadir, and Eltalmas for proofreading parts of this thesis prior to submission.
vii
Table of Contents
Abstract ... ii
Co-Authorship Statement ... v
Acknowledgments... vi
Table of Contents ... vii
List of Tables ... xiv
List of Figures ... xv
List of Abbreviations, Symbols, and Notation... xx
Chapter 1 ... 1
1 Introduction ... 1
1.1 Development of Compartment Fires ... 1
1.1.1 Stage 1: Growth (Pre-Flashover) ... 1
1.1.2 Stage 2: Flashover Phenomenon ... 2
1.1.3 Stage 3: Post-Flashover... 2
1.1.4 Stage 4: Decay ... 3
1.2 Standard Time-Temperature Curve ... 3
1.3 Fire Severity ... 3
1.3.1 Time Equivalence ... 4
1.3.2 Minimum Load Capacity Concept ... 4
1.4 Prescriptive Methods ... 4
1.5 Performance-Based Fire Design ... 5
1.6 Spalling ... 6
1.7 Research Objectives ... 6
1.8 Outline of Thesis ... 7
viii
Chapter 2 ... 11
2 Stress-Block Parameters for Reinforced Concrete Beams during Fire Events ... 11
2.1 Research Significance ... 12
2.2 Sectional Analysis at Ambient Temperature ... 12
2.3 Sectional Analysis at Elevated Temperatures ... 13
2.3.1 Concrete and steel constitutive models ... 15
2.3.2 Heat transfer model ... 19
2.4 Analysis Steps of RC Beams under Fire Loading ... 26
2.4.1 Validation of the sectional analysis methodology ... 26
2.5 Stress-Block Parameters at Ambient Temperature ... 29
2.6 Stress-Block Parameters at Elevated Temperatures ... 30
2.6.1 Behavior of beams subjected to sagging moments during fire ... 32
2.6.2 Stress-block parameters for beams subjected to sagging moments ... 35
2.6.3 Flexural capacity for beams subjected to sagging moments ... 38
2.6.4 Calculation of stress-block parameters for beams subjected to Hogging moments ... 41
2.6.5 Stress-block parameters for beams subjected to hogging moments ... 43
2.6.6 Flexural capacity for beams subjected to hogging moments ... 46
2.7 Summary and Conclusions ... 46
2.8 Acknowledgments... 47
2.9 References ... 47
2.10 Appendix I ... 49
2.11 Appendix II ... 52
Chapter 3 ... 54
3 Simplified Method to Analyze Continuous RC beams during Fire Exposure ... 54
ix
3.2 Sectional Analysis at Elevated Temperatures ... 55
3.3 Statically Determinate RC Beams during Fire ... 58
3.3.1 Simply supported beam (sagging moments) ... 58
3.3.2 Cantilever beam (hogging moments) ... 60
3.4 Moment–Curvature Relationships of Fire-Heated RC Sections ... 61
3.5 Statically Indeterminate RC Beams during Fire ... 63
3.5.1 Proposed method for continuous RC beams ... 63
3.5.2 Validation of the proposed methodology ... 66
3.5.3 Modeling and analysis of B-124 ... 67
3.6 Evaluation of Thermal and Effective Stiffness Parameters ... 74
3.6.1 Unrestrained thermal curvature ... 76
3.6.2 Proposed expressions for the unrestrained thermal curvature ... 78
3.6.3 Effective flexural stiffness ... 80
3.6.4 Proposed expressions for the effective flexural stiffness ... 81
3.6.5 Practical application of the proposed method ... 83
3.7 Summary and Conclusions ... 84
3.8 Acknowledgments... 85
3.9 References ... 85
Chapter 4 ... 87
4 Practical Method to Predict the Axial Capacity of RC Columns Exposed to Fire ... 87
4.1 Axial Behavior of RC Columns Exposed to Fire ... 88
4.1.1 Section Analysis Method ... 88
4.1.2 Error Analysis ... 92
4.2 Proposed Method ... 93
4.3 Average Temperature Distribution ... 94
x
4.3.2 Temperature Regions ... 96
4.3.3 Average Temperatures ... 98
4.4 Concrete Fire-induced Strains ... 99
4.5 Stress-Strain Relationships ... 101
4.5.1 Concrete ... 101
4.6 Steel... 103
4.7 Predicting the Axial Capacity ... 104
4.8 Illustrative Example ... 104
4.9 Validation ... 109
4.9.1 Lie and Wollerton ... 109
4.9.2 Dotreppe et al. ... 111
4.9.3 Hass ... 113
4.10 Summary and Conclusion ... 115
4.11 Acknowledgments... 115
4.12 References ... 115
Chapter 5 ... 118
5 Simplified Interaction Diagrams for Fire-Exposed RC Columns ... 118
5.1 Research Significance ... 119
5.2 Interaction Diagrams using Sectional Analysis ... 119
5.3 Proposed Method ... 124
5.4 Average Temperature Distribution ... 124
5.5 Concrete and Steel Constitutive Relationships ... 125
5.5.1 Concrete compressive strength ... 125
5.5.2 Thermal strains ... 126
5.5.3 Concrete strain at peak stress ... 126
xi
5.5.5 Maximum concrete strain ... 129
5.5.6 Concrete stress-strain relationships ... 132
5.5.7 Steel stress-strain relationships ... 133
5.6 Evaluation of Concrete Internal Forces ... 134
5.6.1 Concrete strain profile ... 134
5.6.2 Calculation of concrete internal forces and their locations ... 135
5.6.3 Interaction Diagram ... 137
5.7 Illustrative Example ... 138
5.8 Validation ... 144
5.8.1 Law and Gillie (2010) ... 144
5.8.2 Lie and Wollerton (1986)... 146
5.9 Summary and Conclusions ... 147
5.10 Acknowledgments... 148
5.11 References ... 148
5.12 Appendix I ... 150
Chapter 6 ... 159
6 Fire Performance of RC Frames using Simplified Sectional Analysis ... 159
6.1 Research Significance ... 160
6.2 Proposed Method ... 160
6.3 Average Temperature Distribution ... 161
6.4 Concrete and Steel Constitutive Relationships ... 162
6.4.1 Concrete strains ... 162
6.4.2 Concrete Compressive Strength ... 164
6.4.3 Concrete Stress-Strain Relationships ... 166
6.4.4 Steel Stress-Strain Relationships ... 167
xii
6.5.1 Concrete strain profile ... 170
6.5.2 Calculation of concrete internal force and its location due to ... 170
6.6 Evaluation of the Flexural and Axial Stiffnesses for a Heated Section ... 173
6.6.1 Concrete strain profile ... 175
6.6.2 Calculation of concrete internal force and its location due to ... 175
6.6.3 Calculation of concrete internal force and its location due to and ... 177
6.7 Prediction of the Behaviour of RC Frames during Fire Exposure ... 178
6.8 Error Analysis ... 179
6.8.1 Average Temperatures ... 179
6.8.2 Concrete strain at peak stress ... 181
6.8.3 Concrete Compressive Strength ... 181
6.8.4 Effect of ignoring concrete nonlinearity on ... 182
6.9 Validation Case 1 (Fang et al., 2012) ... 183
6.9.1 Predicting Average Temperature Distribution ... 185
6.9.2 Evaluation of Unrestrained Thermal Parameters ... 188
6.9.3 Evaluation of Degraded Flexural and Axial Stiffnesses ... 189
6.9.4 Modeling and Analysis of RC Subassemblage ... 192
6.9.5 Predicting the Fire Performance of the Beam-Column Subassemblage . 193 6.10 Validation Case 2 (Iding et al., 1977) ... 195
6.11 Summary and Conclusions ... 198
6.12 Acknowledgments... 199
6.13 References ... 199
6.14 Appendices ... 202
6.14.1 Appendix I ... 203
xiii
Chapter 7 ... 214
7 Summary and Conclusions ... 214
7.1 Flexural capacity of RC Beams ... 214
7.2 Fire Performance of Continuous RC Beams ... 215
7.3 Axial Capacity of RC Columns ... 216
7.4 Interaction Diagrams of RC Columns ... 217
7.5 Response of RC Frames during Fire Events ... 217
7.6 Limitations of Current Work ... 218
7.7 Recommendations for Future Work ... 219
xiv
List of Tables
Table 2-1–Parametric study cases (sagging moment) ... 31
Table 2-2–Parametric study cases (hogging moment) ... 31
Table 2-3–Parametric study results (sagging moment) ... 36
Table 2-4–Parametric study results (sagging moment) - Cont’d ... 36
Table 2-5–Parametric study results (hogging moment) ... 44
Table 2-6–Parametric study results (hogging moment) - Cont’d ... 44
Table 3-1–Parametric study cases ... 75
Table 4-1–Parametric study cases ... 92
Table 4-2–Details of Lie and Wollerton ... 110
Table 4-3- Details of Dotreppe et al. ... 112
Table 4-4-Details of Hass ... 113
Table 5-1–Parametric study cases ... 123
Table 5-2-Calculation of steel internal forces ... 143
Table 6-1–Parametric study cases ... 179
xv
List of Figures
Fig. 1-1: Fire development and stages ... 2
Fig. 1-2: Standard fire curves ... 3
Fig. 2-1-Beam B1 loading and configuration ... 14
Fig. 2-2-Heat Transfer mesh of beam B1 ... 20
Fig. 2-3-Validation of the heat transfer model (average temperature of bottom reinforcing bars)... 20
Fig. 2-4-Average temperature distributions for B1 after 1hr ASTM-E119 fire exposure ... 22
Fig. 2-5-Components of total strain at elevated temperatures ... 23
Fig. 2-6-Strain distribution and self-equilibrating forces along B1 height ... 25
Fig. 2-7-Effect of fire temperature on the moment – curvature relationship for B1 ... 28
Fig. 2-8-Validation of sectional analysis methodology by prediction the deflections of B1 during fire exposure ... 28
Fig. 2-9-Details of the studied RC beam “B4” in the parametric study ... 30
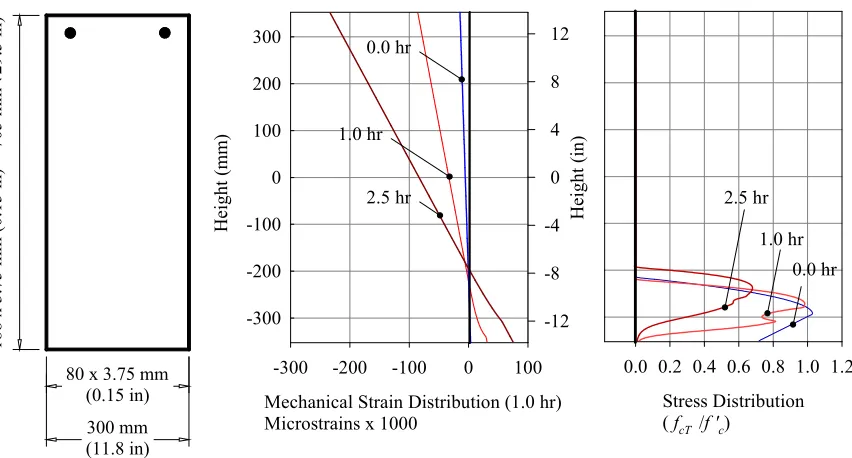
Fig. 2-10-Strain and stress distributions of B4 at 1.0 hr fire exposure ... 32
Fig. 2-11-Effect of ASTM-E119 fire duration and section width on the average strength temperatures ... 33
Fig. 2-12-Effect of ASTM-E119 fire duration and section width on the average temperature ... 34
Fig. 2-13-Effect of fire duration, RFT ratio, and section height on 1T and 1T ... 37
xvi
Fig. 2-15- Temperature contour map in C of B30 [1 F = 1.8 C + 32] ... 40
Fig. 2-16-Mechanical strain and stress distributions of B18 at different fire durations ... 42
Fig. 2-17- Effect of fire duration and other studied factors on 1T ... 45
Fig. 2-18- Effect of fire duration, RFT ratio, and section height on 1T ... 45
Fig. 3-1-Modified sectional analysis approach for RC sections exposed to fire ... 56
Fig. 3-2-Validation beams (B-123) and (B-123a)... 59
Fig. 3-3-(M)–( ) diagrams for RC beams during fire ... 62
Fig. 3-4-Analysis steps for a two-span continuous RC beam during fire ... 65
Fig. 3-5-Validation beam B-124 ... 68
Fig. 3-6-Unrestrained thermal curvature for B-124 ... 69
Fig. 3-7-Effective stiffness of B-124 during fire test ... 70
Fig. 3-8-Moment redistribution of B-124 after 1.0 ASTM-E119 fire exposure ... 71
Fig. 3-9-Mid-span deflection of B-124 ... 73
Fig. 3-10-Outer span loads of B-124 ... 73
Fig. 3-11-Typical cross-sections for the parametric study beams ... 74
Fig. 3-12- Effect of section dimensions ( , ) on ... 77
Fig. 3-13- Regression analysis of results ... 79
Fig. 3-14- Effect of tensile reinforcement ratio (ρ) on ... 80
Fig. 3-15- Regression analysis of ... 82
xvii
Fig. 4-2. Average temperature distribution ... 90
Fig. 4-3. Sectional analysis approach for axially loaded RC sections exposed to fire ... 91
Fig. 4-4. – relationships for a 305 square column at different fire durations ... 92
Fig. 4-5. Effect of different parameters on sectional analysis results ... 93
Fig. 4-6. Temperature calculation of example RC column ( /2) ... 95
Fig. 4-7. Temperature calculation of example RC column ( /2) ... 97
Fig. 4-8. Variation of at elevated temperatures ... 100
Fig. 4-9- Effect of different parameters on sectional analysis results ... 100
Fig. 4-10. Concrete stress-strain relationship at different values ... 102
Fig. 4-11. distribution of the example RC column ... 106
Fig. 4-12. Average compression stresses distribution ... 107
Fig. 4-13. Axial capacity predictions of example column ... 108
Fig. 4-14. Proposed method predictions for different experimental works ... 114
Fig. 5-1-Sectional analysis approach for four-face fire exposed RC columns ... 121
Fig. 5-2-Schematic for – relationships at different axial load levels ... 122
Fig. 5-3. Effect of ignoring on the flexural capacity of fire-exposed columns ... 123
Fig. 5-4. Effect of neglecting on the flexural capacity of fire-exposed columns ... 123
Fig. 5-5. Effect of aggregate type on the flexural capacity of fire-exposed columns ... 126
Fig. 5-6- Concrete stress-strain relationships at different elevated temperatures ... 127
xviii
Fig. 5-8. Effect of using Eq. (5) on the flexural capacity of fire-exposed columns ... 128
Fig. 5-9- - diagrams for column 2 with using different values ... 130
Fig. 5-10. Effect of descending branch length on flexural capacity ... 131
Fig. 5-11-Different cases for concrete internal compression force ... 136
Fig. 5-12. distribution of example RC column ... 138
Fig. 5-13- - diagrams for example column ... 139
Fig. 5-14. Temperature calculation of a example column ... 140
Fig. 5-15-Concrete internal compression force for example column ... 141
Fig. 5-16- Column section analyzed by Law and Gillie ... 144
Fig. 5-17- - diagrams for Law and Gillie column ... 145
Fig. 5-18- Concrete internal compression force for Lie and Woollerton3 column ... 146
Fig. 6-1-Variation of ( ) and at elevated temperatures ... 163
Fig. 6-2- Concrete stress-strain relationships at different elevated temperatures ... 166
Fig. 6-3-Sectional analysis approach for heated RC sections ... 169
Fig. 6-4- Calculation of concrete internal forces corresponding to ... 172
Fig. 6-5-( )–( ) diagrams for RC sections during fire ... 174
Fig. 6-6- Calculation of concrete internal forces corresponding to ... 177
Fig. 6-7. Effect of using on the stiffness of fire-exposed sections ... 180
Fig. 6-8. Effect of ( ) model on the stiffness of fire-exposed sections ... 181
xix
Fig. 6-10. Test setup for RC beam-column subassemblage ... 184
Fig. 6-11-Thermal Deformation of beam SEC 2-2 ... 187
Fig. 6-12-Moment redistribution after 3 ISO-834 fire exposure ... 191
Fig. 6-13-Mechanical stress analysis of beam SEC 2-2 ... 192
Fig. 6-14-Beam-column subassemblage deformation after 3 hrs ISO-834 fire exposure ... 194
Fig. 6-15- Layout for a RC frame exposed to ASTM-E119 fire ... 195
Fig. 6-16-Thermal Deformation of column SEC 1-1 ... 196
Fig. 6-17- Mechanical stress analysis of column SEC 1-1 ... 196
Fig. 6-18-External forces/moments after 1 ASTM-E119 fire exposure ... 197
xx
List of Abbreviations, Symbols, and Notation
factor used in calculating internal concrete force, equals to
factor used in calculating internal concrete force, equals to
As area of tensile steel bars
Ai area of layer i
factor to account for the aggregate type
cross-section width
, , , and constants describing concrete thermal expansion strain at elevated temperatures for different aggregate types
concrete cover or depth of neutral axis
internal compression force in concrete
concrete compression force at for variable
distribution
. concrete moment about axis at for variable
distribution
concrete compression forces at for variable
distribution
. concrete moment about axis at for variable
distribution
concrete compression force corresponding to for constant
xxi
concrete compression force corresponding to for constant
. concrete moment about axis at for constant
compression force in concrete due to self equilibrium under thermal strains
concrete compression force for constant and variable distribution
. concrete moment about axis for constant and variable
distribution
concrete compression force for variable and distributions
. concrete moment about axis for variable and distributions concrete compression force for constant and constant
. concrete moment about axis for constant and constant effective depth of tensile reinforcement
effective flexural stiffness
effective axial stiffness
ambient secant modulus for concrete
Ei modulus of elasticity of layer i
′ compressive strength for concrete at ambient temperature
c
f compression stress in concrete at ambient temperature
fy yield strength of steel bars at ambient temperature
xxii
compression stress in heated concrete
reduced yield strength of reinforcing bars at elevated temperatures
compression or tension stress in heated steel bars
.
agg
F factor to account for the aggregate type
average concrete compressive stresses
cross-section height
gross sectional second moment of inertia
hT
K confinement factor for concrete at elevated temperatures
L span between the supports (mm)
M flexural moment
nominal flexural capacity at ambient temperature
thermal moment
MnT reduced nominal flexural resistance during fire exposure
number of tensile reinforcement layers
ratio between the surface temperature and the fire temperature
and ratios between the internal and surface temperatures due to heating in the
and directions, respectively
axial load
xxiii
length of descending branch in concrete constitutive stress-strain relationship at elevated temperatures
R reduction factor for concrete compressive strength at elevated temperatures
fire duration
∗ Equivalent fire duration assuming ISO 834 standard fire
T temperature in degree Celsius [1 oF = 1.8 oC + 32]
temperature produces the same average concrete strength for the layer
algebraic average temperature of the elements within each layer
temperature rise at any point located at ( , )
algebraic average distribution along the section height
average temperature for regions affected by heating from either left or right
average temperature for regions not affected by heating from left or right
average temperature due to heating from the left and right sides
simultaneously
fire temperature
ISO 834 standard fire temperature at a modified fire duration ∗
Ti equivalent temperature at layer
Ts tension force in steel assuming yielding or reinforcement
64 8 2
1,T ,T ,T
T constants describing the reduction the concrete compressive strength at
elevated temperatures for different aggregate types
xxiv
, horizontal and vertical coordinates for any point within the column/beam section, origin located at bottom left of the section
, boundaries of internal concrete compression force measured in direction
yi distance between the center of area of layer i and the center of area of the
cross-section.
boundary of fire affected regions
, constants of average temperature fitting equation
, constants define the linear variation of mechanical strain ( ) in
direction
, constants define the linear variation of unrestrained thermal strain ( ) in direction
Z slope of the descending branch of the concrete constitutive stress-strain
relationship
1
and1 stress-block parameters at ambient temperature
T
1
and 1T stress-block parameters at elevated temperatures
total concrete strain at elevated temperatures
th
unrestrained thermal strain of concrete
tr
transient creep strain in concrete
c
instantaneous stress-related strain
equivalent linear thermal strain
xxv self induced thermal strains
equivalent mechanical strain in concrete during fire exposure
equivalent mechanical strain in steel during fire exposure
o
strain at maximum stress of unconfined concrete at ambienttemperatures
εoT value of at peak stress
ultimate/crushing concrete compressive strain at elevated temperatures
compression strain corresponding to the flexural capacity
Δ difference between and ( ) equals to 0.02
Δεc incremental centroidal axial strain
∆ time step
total curvature
unrestrained thermal curvature
mechanical curvature
Δψ incrementalcurvature
axial or flexural load level or column slenderness ratio
L
preloading level
compression reinforcement ratio
tensile reinforcement ratio
Γ compartment time factor
xxvi
max
maximum allowable deflection
max
Chapter 1
1
Introduction
Fire is a chain of exothermic chemical reactions, which release energy in the form of heat and light 1,2. A fire needs three essential elements: a combustible material, oxygen, and a source of heat. The lack of any of these elements will stop the exothermic reaction and extinguish the fire. If fire cannot be extinguished within a reasonable amount of time, preventive and/or protective measures significantly reduce the loss of life and damage to property. Preventive, also known as active measures, includes: installation of alarm and smoke control systems and sprinkles. It can also include controlling hazardous contents and providing access for fire fighters. Protective, or passive, measures includes: ensuring adequate compartmentation, control of flammability of the structure fabric, planning fixed escape routes (egress paths), and retaining adequate structural performance during fire events. The latter is the main scope of this dissertation.
1.1 Development of Compartment Fires
Structures are required to be divided into compartments: vertically, horizontally, or a combination of the two1. This requirement is to limit the spread of the fire. It also allows phased evacuation of multi-storey structures to addressing critical floors first. The development of compartment fires, Fig. 1-1, can be broken down into four phases: growth, flashover, post-flashover, and the decay period 3,4.
1.1.1 Stage 1: Growth (Pre-Flashover)
Tempera
tur
e
Growth
Flasho
ver
Fully developed
fire Decay
Time
standard fire natural
fire
e.g. ASTM-E119 ISO 834
controlled fire. The pre-flashover stage is often ignored in the fire response calculations of civil structures.
Fig. 1-1: Fire development and stages
1.1.2 Stage 2: Flashover Phenomenon
Human intervention can increase the air supply by opening a door or a window. This increase causes combustion spread over the full area of the compartment. This spread is known as “flashover”. It results in a rapid temperature fire increase and the development of the fire in a very short period.
1.1.3 Stage 3: Post-Flashover
Fire duration (t) (min)
0 30 60 90 120 150 180
Fir
e
t
e
mp
er
a
tur
e
(
T
) (
o C
)
0 200 400 600 800 1000 1200
ASTM-E119
ISO 834
Hydrocarbon fire
1.1.4 Stage 4: Decay
When the combustible materials in the room start to be fully burnt, the rate of combustion decreases and the temperature in the compartment starts decreasing.
1.2 Standard Time-Temperature Curve
As shown in Fig. 1-2, each natural fire has its own temperature-time relationship. Standard temperature-time relationships provide a basis of comparison between standard fire test and real fires for judging on the safety of a structure. The most widely used standard temperature-time relationships are: the American ASTM-E119 2, the international ISO 834 2, and the Eurocode Hydrocarbon. Standard fire curves, Fig. 1-2,
simulate a severe fire, i.e. a fully-developed fire with no decay period.
Fig. 1-2: Standard fire curves
1.3 Fire
Severity
Ingberg (1928) conducted a series of compartment tests with known fire loads to evaluate the severity of each load based 1,5. Based on these tests, it was concluded that fire severity could be characterized by the area under the temperature-time curve that is above 150
sound theoretical justification and ignored the effect of air ventilation (Robertson and Gross, 1970) 1. Thus, alternative approaches were proposed such as time equivalence and minimum load capacity.
1.3.1 Time Equivalence
There are two approaches to calculate the equivalent time ( ) corresponding to a natural fire duration ( ), Fig. 1-1. The first approach calculates such that it results in the same maximum temperature rise of the real fire. The second approach considers equivalence based on the amount of heat input.
1.3.2 Minimum Load Capacity Concept
The equivalent time ( ) is evaluated such that it results in the same reduction of the load bearing capacity that would occur in a complete burnout of a compartment 5.
1.4 Prescriptive
Methods
Concrete structures are currently being designed for fire temperatures using prescribed methods. Engineers choose floor and wall assemblies that meet specific fire ratings using minimum cross-section dimensions and minimum clear cover to the reinforcing bars 1,4,5. This minimum concrete cover ensures that the elevated temperature of steel reinforcement do not exceed its critical temperature, i.e. 593 , at which steel loses 50%
of its strength 4.
Furthermore, such methods do not account for material nonlinearity and transient creep strains which have a significant effect on the fire response of heated RC members, especially at later stages of fire exposure.
1.5 Performance-Based Fire Design
Standard fires do not consider all factors that would influence fire severity. Also, single elements are tested in isolation without considering the overall structural performance. These limitations result in uneconomic structural fire safety design. Performance-based fire design may be defined as a design approach to simulate and evaluate the performance of a structure under realistic fire loads1. Recent building codes, regulations, and standards are moving from prescriptive-based methods to performance-based approaches. Performance-based fire safety design has number of advantages over the prescriptive design that includes 6,7:
• Establishing specific safety goals that the designer should achieve.
• Permitting structural engineers to design structures to meet performance criteria allowing the use of innovative design solutions.
• Allowing cost-effectiveness and flexibility in design.
• Improving the harmonization between international regulations/codes.
• providing better knowledge of the implied structural safety level which benefits insurance contractors.
1.6 Spalling
Explosive spalling occurs in early stages of fire exposure due to the build-up of pore pressure during heating 1,4. It leads to a loss of concrete cover and rapid increase in reinforcement temperature. Thus, the fire performance of the exposed element is significantly reduced. The exact mechanism of explosive spalling is still not understood and complex to predict 1,9. High Strength Concrete (HSC) is more susceptible to explosive spalling because of its low permeability compared to Normal Strength Concrete (NSC)10. The thesis is focusing on NSC and thus spalling is not accounted for.
1.7 Research
Objectives
As new codes are moving towards performance based design approach, engineers are in-need of simple and rational design tools to assess the structural integrity of RC buildings during fire events. To address some of the challenges faced by engineers, this thesis aims at developing simplified tools to:
1) Evaluate the flexural capacity of fire-exposed RC beams
2) Predict the fire performance of continuous RC beams
3) Predict average temperature distribution in heated concrete sections
4) Assess the flexural/axial capacity of fire-exposed RC columns
5) Predict the overall behavior of indeterminate RC frames during fire exposure
1.8 Outline of Thesis
This thesis is prepared in an “Integrated-Article Format” following the guidelines described in Western University-School of Postdoctoral and Graduate Studies (SPGS), General Thesis Regulations.
Chapter 2
Fire safety is a critical criterion for designing reinforced concrete (RC) structures. New codes are moving towards Performance-based design. Conducting full scale experiments and comprehensive finite element simulations are usually expensive and time consuming options for designers to achieve specific fire performance. A simplified sectional analysis methodology that tracks the axial and flexural behavior of RC square sections subjected to elevated temperatures from their four sides was previously developed and validated by the authors. In the first part of this chapter, the proposed methodology is extended to cover rectangular beams subjected to standard ASTM-E119 fire from three sides. An extensive parametric study is then conducted to study the distribution of the concrete compression stresses at different ASTM-E119 fire durations. Based on the parametric study, simple equations expressing the equivalent stress-block parameters at elevated temperatures are presented. These equations can be utilized by designers to accurately estimate the flexure capacity of simply supported and continuous beams exposed to fire temperature.
Chapter 3
simplified sectional analysis approach and is based on separating the effects of thermal deformations and vertical loads. The effective flexural stiffness and the thermal deformations of the beam are estimated using simple expressions that are developed based on a comprehensive parametric study.
Chapter 4
Existing analytical methods for the evaluation of fire safety of Reinforced Concrete (RC) structures require extensive knowledge of heat transfer calculations and the finite element method. With the introduction of performance based design, structural engineers need simple design tools to assess the capacity and performance of different elements during fire exposure. This chapter proposes a rational method to predict the axial capacity of RC columns exposed to fire. An existing simplified heat transfer method is first extended to predict the average temperature distribution along the section height. The corresponding distribution of the reduced concrete strength is then integrated to develop expressions to calculate the axial capacity of RC columns exposed to fire from four faces. These expressions provide emergency response teams with a tool to conduct a quick assessment of the integrity of a fire exposed structure to ensure the safety of their team.
Chapter 5
that can be used to estimate the average temperature distribution within the concrete section and the corresponding internal forces. The proposed formulas are validated by comparing their predictions with the experimental and analytical results by others.
Chapter 6
Fire safety of Reinforced Concrete (RC) structures is currently satisfied through fire rating requirements. As fire codes are moving towards performance based design, structural engineers need practical tools to assess the overall behavior of a structure during exposure to fire. Existing numerical methods, which predict the fire response of RC structures, have high computation demand and require knowledge of heat transfer calculations and stress analysis. This chapter proposes a simple approach to track the fire performance of RC frames during fire exposure. The derivations of a set of formulas that can be used to estimate the average temperature distribution within a concrete section, the corresponding internal forces, the effective flexural and axial stiffnesses, and the unrestrained thermal deformations are presented. Applications of these formulas to simulate the effect of fire exposure and to predict the overall behavior of RC structures during fire events are explained. The proposed method is validated by comparing its predictions with experimental and analytical results by others.
1.9 References
1. Purkiss, J.A. 1996, "Fire Safety Engineering Design of Structures ", Butterworth-Heinemann, Oxford, 342 pp.
2. Lie, T.T. 1992, "Structural Fire Protection", ASCE Manuals and Reports on Engineering Practice, no. 78, New York, NY, 241 pp.
4. Moftah M., 2008, “Numerical Modeling and Behaviour of Reinforced Concrete Members Under Fire Conditions”, University of Western Ontario, PhD thesis.
5. Andrew H. Buchanan, 2002, “ Structural Design for Fire Safety”, John Wiley & Sons.
6. Hadjisophocleous, George V., Benichou, Noureddine, and Tamim, Amal S., 1998, “Literature Review of Performance-Based Fire Codes and Design Environment”, J. of Fire Prot. Engr., vol. 9, no. 1, pp. 12-40.
7. Mostafaei, H., Sultan, M.A., and Bénichou, N. 2009, “Recent developments on structural fire performance engineering – a state-of-the-art report,” NRC-CNRC, 35 pages
8. Kodur, V.K.R., Wang, T.C. & Cheng, F.P. 2004, "Predicting the fire resistance behaviour of high strength concrete columns", Cement and Concrete Composites, vol. 26, no. 2, pp. 141-153.
9. Khoury, G.A. 2000, "Effect of fire on concrete and concrete Structure", Progress in
Chapter 2
2
Stress-Block Parameters for Reinforced Concrete
Beams during Fire Events
Concrete as well as steel reinforcing bars experience significant deterioration when subjected to elevated temperatures1. This deterioration is accompanied by the generation of thermal and transient strains which adds to the complexity of estimating the flexural capacity of a reinforced concrete (RC) section at elevated temperatures. Currently, concrete structures are designed for fire safety using prescribed methods that are based on computational modeling and experimental investigations. These methods usually specify the minimum cross-section dimensions and clear cover to achieve specific fire ratings. As new codes are moving towards performance-based design and conducting experimental tests to satisfy different fire scenarios is expensive, different design tools are needed by design engineers2. One of these tools would facilitate the estimation of the flexural behavior of a RC beam at elevated temperatures.
A simplified method to track the axial and/or the flexural behavior of square column sections subjected to fire at their four sides was previously introduced by El-Fitiany and Youssef3. This chapter starts by extending the proposed method to be applicable to RC beams exposed to fire from three sides. The overall behavior of RC beams during fire exposure is tracked by constructing the moment-curvature relationships at different fire durations. The unrestrained simply supported beam tested by Lin et al.4, Fig. 2-1a, is taken as an illustrative example for the proposed methodology. The tested beam has a normal strength concrete with carbonate aggregate and subjected to ASTM-E119 standard fire.
of this chapter presents a parametric study to evaluate the compressive stresses distribution for different rectangular concrete cross-sections. The effect of different parameters including section dimensions, reinforcement ratio, concrete strength, fire duration, and aggregate type is evaluated.
2.1 Research
Significance
The proposed simplified method extends the use of sectional analysis to be applicable at elevated temperatures. Designers are familiar with this method at ambient temperature, which allows them to use it in their fire calculations. The ultimate/nominal flexural capacity of RC beams can be evaluated at ambient temperature using equivalent stress-block parameters. No specific study was conducted to address the effect of fire temperature on such parameters. The second part of this chapter presents an extensive parametric study on the non-linear distribution of compression stresses for a number of rectangular cross-sections at different ASTM-E119 fire durations up to 2.5 hr. This chapter ends by providing simplified equations for designers to allow them to estimate the stress-block parameters at elevated temperatures.
2.2 Sectional Analysis at Ambient Temperature
At ambient temperature, RC sections are analyzed using the well-known sectional analysis approach5. For cases of single curvature, i.e. bending about horizontal axis, the concrete section is divided into horizontal discrete fibers. Utilizing the uniaxial stress-strain relationship for each fiber and taking into account equilibrium and kinematics, the mechanical behavior of the section is analyzed. To simplify the analysis, two variables can be assumed; incremental centroidal axial strain, ∆ , and incremental curvature,
cT cT n i i i n i i i i n i i i i n i i i i A E y A E y A E y A E P M 1 1 1 1 2 (1)Where Ei is the modulus of elasticity of layer i, Ai is the area of layer i, yi is the distance
between the center of area of layer i and the center of area of the cross-section.
For a given axial load, the moment-curvature behavior is obtained in two stages. In the first stage, the axial strain is increased incrementally while curvature is kept equal to zero until the required axial load is reached. In the second stage, the axial load is kept constant and the applied curvature is increased. The corresponding change in the axial strain and the moment are calculated using Eq. (1). This process is repeated until reaching the required curvature value.
2.3 Sectional Analysis at Elevated Temperatures
A'
Steel layers (As=A's= 2#19) (Ts)
Concrete layer i
yi ( h = 0.0 )
s
As
N.A.
80 x 3.81 mm = 305 mm
2#19
4#19
(T )i
94 x
3.81 mm =
358
mm
94
x 0.15
in
= 14.1
in
80 x 0.15 in = 12 in Detail
A
6.10 m [20.01 ft]
20 kN
*
w
ASTM-E119 ASTM-E119
0.75 m 1.50 m 1.50 m 1.50 m 0.75 m
2#19 4#19
[4496 Ib] [4496 Ib]20 kN [4496 Ib]20 kN [4496 Ib]20 kN
[4.9 ft] [4.9 ft] [4.9 ft]
[2.5 ft] [2.5 ft]
(a) Beam B1 elevation
(b) Cross-section and fiber model of beam B1
Fig. 2-1-Beam B1 loading and configuration
- f'c30 MPa [4351 psi]
- fy 435.8 MPa [63207 psi]
2.3.1 Concrete and steel constitutive models
The constitutive models proposed by Youssef and Moftah6 are adopted and their application to beam B1 is presented in the following sub-sections.
2.3.1.1 Concrete
compressive
strength
Hertz proposed a model7, Eq. (2), that recognizes the variation of the concrete compressive strength (f'cT) at elevated temperatures. If concrete is loaded prior to fire, f'cT
should be increased by 25% 7.
c cT R f
f' ' (2a)
for concrete with siliceous aggregate,
64 8 2 000 , 100 570 800 000 , 15 1 1 T T T T
R (2b)
for concrete with carbonate aggregate.
64 8 2 1000 690 1080 000 , 100 1 1 T T T T
R (2c)
Where R is a reduction factor, T is the temperature in degree Celsius [1 oF = 1.8 oC + 32],
and f'c is the concrete compressive strength at ambient temperature.
2.3.1.2 Fire induced strains
Total concrete strain at elevated temperatures (εtot) is composed of three terms6:
creep strain (εtr). The value of εfT at the peak stress (εoT) defines the stress-strain
relationship during the heating stage and can be predicted using the model proposed by Terro8, Eq. (3). Flexural RC elements have variant stress values within concrete
compression zone which implies different preloading levelsL for each fiber.
.002 0 ) 10 ( 5 ) 5 ( 20 ) 1 15 50 ( 2 2 2 1
2
L L o L L o L L
oT
(3)
3 6 9 2 12 3
1
3 6 9 2 12 3
2
where 2.05 10 3.08 10 6.17 10 6.58 10
2.03 10 1.27 10 2.17 10 1.64 10
o o
T T T
T T T
εth is the free thermal strain resulting from fire temperature and can be predicted using the
Eurocode model6, Eq. (4).
for concrete with siliceous aggregate,
3 3 11 6 4 10 14 ) 20 ( 10 3 . 2 ) 20 ( 10 9 10 8 .
1
T T
th
(4a)
for concrete with carbonate aggregate,
3 3
11 6
4 6 10 ( 20 ) 1.4 10 ( 20) 12 10
10 2 .
1
T T
th
(4b)
εtr is induced during the first heating cycle of loaded concrete and is considered the
largest component of the total strain. Its value can be estimated using Terro’s model8.
. ' . . . 65 0 226 3 032 0 3 0 a c c tr V f f
(5)
where
is the volume fraction of aggregates
. Is the transient creep strain for initial stress of 0.3 ′ , and is given by Eq. (6). 4 13 3 10 2 8 8 6 3
0. 43.87 10 2.73 10 T 6.35 10 T 2.19 10 T 2.77 10 T
2.3.1.3 Reinforcing steel tensile stress-strain relationship
Lie’s model1 is used to predict the reduced yield strength of reinforcing bars fyT, Eq. (7).
[ 2 ]/
lnT f T C T F
T
f o o
y
yT 0 600 3 1112
1750 900
1
(7a)
] 2 [ . F T C T f T T
f o o
y
yT 600 1000 3 1112
240 34 0
340
(7b)
Lie et al. 1 has also proposed another model which represents a general stress-strain )
(fsT sT relationship of reinforcing bars at elevated temperatures, Eq. (8). The effect of creep of steel bars is found to have a minor effect on the behavior of RC sections during fire exposure9. Thus, it is not included in this study.
sT sT
T f
f
001 0 001 0 . ) . , (
sT p (8a)
) . , ( ]) . [ , ( . ) . , ( 001 0 001 0 001 0 001 0 T f T f T f
fsT p sT p sT p (8b)
y
p f
6 10
4
(8c)
9 6 1 04 0 50 001
0 30 003 0001
. ] [ ) . ( ) . ,
(T T e( . T) .
2.3.1.4 Concrete compressive stress-strain relationship
The model proposed by Youssef and Moftah6 is adopted in this study. The model includes simplified representation of transient creep strains. The relationship between the
compressive stress, fcT, and the corresponding compressive strain, cT, is given by Eq. (9). tr oT cT tr oT cT tr oT cT cT hT
cT K f'
f
2 2 (9a)
1- cT oT tr
0.2 cT oT oT tr cThT
cT K f' Z f'
f (9b)
where, cT yT s hT f f K ' factor) t
(confinmen 1 (9c)
perimeter their to measured core concrete of volume ent reinforcem e transvers of volume s yT
f is the reduced yield strength for the stirrups at elevated temperature
Z is the slope of the descending branch of the concrete stress-strain relationship and is given by Eq. (9d)
' ' . . oT o oT c c f f Z 1000 145 29 0 3 5
0 (9d)
tr u
uT
(10)
2.3.2 Heat transfer model
Several methods were developed to predict the temperature distribution in a concrete section during fire exposure1. The Finite Difference Method (FDM) is chosen in this research because of its ability to account for irregular shapes, its accuracy, and the ease of implementation in any programming code. The boundary conditions of the FDM include the fire temperature outside the concrete. A detailed description of the FDM, in the form of prescribed equations, is given by Lie et al. 1.
For beam B1, a 45 degrees heat transfer mesh of 5.4 mm by 5.4 mm [0.21 in] square elements is generated as shown in Fig. 2-2. Based on the size of the elements, the total fire duration (t= 1 hour), is divided into time steps Δt of 4.2 seconds. Concrete’s initial moisture content is assumed to be zero due to its negligible effect on the temperature predictions1. A heat analysis based on the FDM is then conducted and the temperatures for the steel bars were found to range from 302 oC [576 oF] to 513 oC [955 oF]. Fig. 2-3 shows a comparison between the average measured temperatures of bottom steel bars by Lin et al. 1 and the FDM predictions at different fire durations. To allow using sectional analysis, the 45 degree mesh elements are converted to horizontal square mesh elements1,3. The temperature at the center of each square element, Fig. 2-2b, is taken as
Z
X
5.4 m m
3.8
1 m
m
5.4 mm
3.81 mm
Triangular mesh
square mesh Modified Z
X
3.81 m
m
3.81 mm
(a) Heat triangular mesh (Detail A) (b) Equivalent square mesh
Fig. 2-2-Heat Transfer mesh of beam B1
Fire duration (min)
0 20 40 60 80
Tempera
ture
o C
0 400 800 1200
T
em
per
at
ur
e
o F
800 1600 2400
Heat transfer model Test Lin et. al
Fire Temperature ASTM-E119
Fig. 2-3-Validation of the heat transfer model (average temperature of bottom
reinforcing bars)
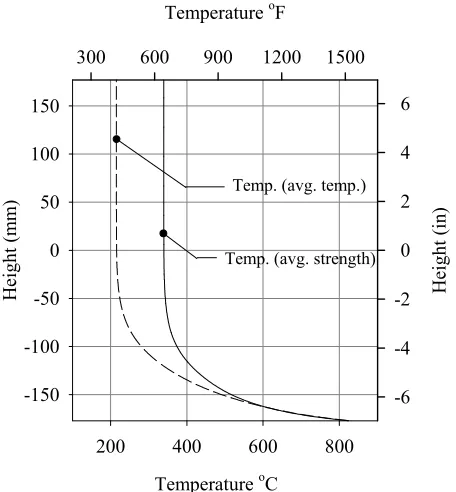
2.3.2.1 Average layer temperature
The methodology proposed by El-Fitiany and Youssef3 is adopted. The square mesh elements are grouped into horizontal fibers to simplify the use of sectional analysis. Therefore, an equivalent temperature Ti has to be assigned for each fiber to allow
estimating the concrete compressive strength, its modulus of elasticity, transient creep and thermal strains. To accurately predict the behavior using sectional analysis, El-Fitiany and Youssef3 suggested the use of two different Ti’s, one for estimating stresses
Temperature oC
200 400 600 800
H
ei
ght (
m
m
)
-150 -100 -50 0 50 100 150
Temperature oF
300 600 900 1200 1500
H
ei
ght
(
in
)
-6 -4 -2 0 2 4 6
Temp. (avg. strength) Temp. (avg. temp.)
Fig. 2-4-Average temperature distributions for B1 after 1hr ASTM-E119 fire
. . 268
2.3.2.2 Thermal and effective strain calculation
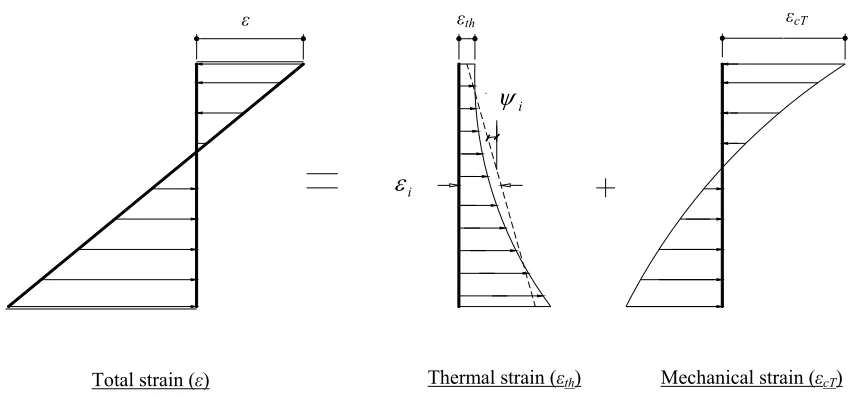
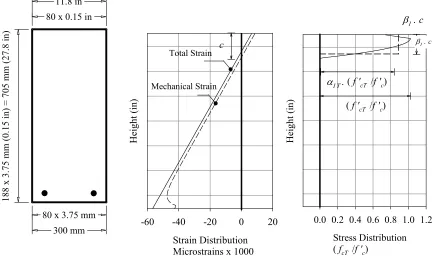
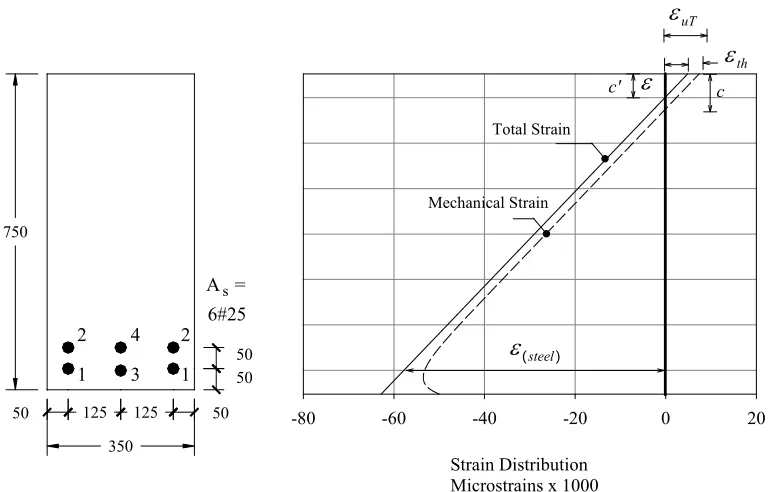
Fig. 2-5 shows the expected linear distribution of total strains (ε) under a pure bending moment (M). This linear shape is based on the fact that plane sections remain plane after loading, which is still valid at elevated temperatures11,12. El-Fitiany and Youssef3 used the same principle but the total strain was a constant value representing the case for a section exposed to fire from four sides. The distribution of εth for a rectangular cross-section
subjected to fire temperature from three sides is shown in Fig. 2-5.
For unrestrained concrete sections, the effective strain (εcT) can be calculated by
subtracting the concrete and steel’s thermal strains from the total strain. The nonlinear distribution of thermal strains results in a nonlinear effective (mechanical) strain distribution, Fig. 2-5. As Eq. (1) is only applicable for linear strain distributions, the following sub-sections propose a methodology to conduct sectional analysis for the non-linear varying effective strain distribution.
Fig. 2-5-Components of total strain at elevated temperatures
Total strain (ε) Thermal strain (εth) Mechanical strain (εcT)
ε εth εcT
i
i
2.3.2.3 Isolation of thermal strain component for beam sections
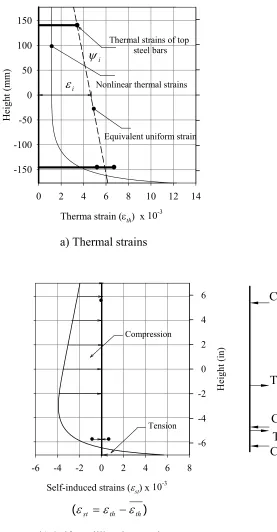
For square column sections exposed to fire temperature from four sides, details for thermal strain equilibrium are given by El-Fitiany and Youssef3. For the case of a rectangular cross-section exposed to fire from three sides, the thermal strain is expected to be asymmetric as shown in Fig. 2-5. The equivalent shape is defined by the mid-height axial strain ( ) and the curvature ( ), Figs. 2-5 and 2-6. The values of and are evaluated such that the axial forces and bending moments in concrete and steel layers resulting from the difference between the actual thermal strain distribution and are in self equilibrium. An iterative procedure is used to calculate the values of and such that the forces, shown in Fig. 2-6b, produce zero axial force and zero moment. Concrete tensile strength is neglected in the analysis.
Fig. 2-6a shows the nonlinear thermal strain distribution for the studied beam B1 after 1 hr standard ASTM-E119 fire exposure. The presented thermal strain distribution is converted to a linear distribution by considering section equilibrium. The equivalent uniform strain reflects the actual deformation of the concrete section under zero external loads and moments. Differences between the non-linear and equivalent uniform strains represent concrete and steel internal stresses that are in equilibrium.
2.3.2.4 Thermally induced stresses
The conversion from the actual nonlinear strain distribution to the equivalent linear
Cs
Cc Ts T c
Cs
Self-induced strains (st) x 10-3 -6 -4 -2 0 2 4 6 8
Heigh
t (in)
-6 -4 -2 0 2 4 6
Compression
Tension
a) Thermal strains
b) Self-equilibrating strains
Fig. 2-6-Strain distribution and self-equilibrating forces along B1 height Therma strain (th) x 10-3
0 2 4 6 8 10 12 14
He
ig
ht
(
mm)
-150 -100 -50 0 50 100 150
Nonlinear thermal strains
Equivalent uniform strain Thermal strains of top
steel bars
i
i
2.4 Analysis Steps of RC Beams under Fire Loading
It can be concluded from the previous sections that the sectional analysis can be divided into three main steps;
1. The heat transfer model is applied and the heat gradient through the cross section is predicted. The average temperatures for each layer are then obtained.
2. The equivalent uniform thermal strain and the curvature are then calculated by equilibrating the forces in the concrete and steel layers resulting from the actual thermal strain distribution. The difference between the actual and uniform strain
distributions represents the induced strains st in concrete and steel layers to satisfy the section geometry. These strains are considered as initial strains in the following step.
3. Sectional analysis is conducted to construct the moment-curvature diagrams.
2.4.1 Validation of the sectional analysis methodology
Moment-curvature curves represent the flexural behavior of a RC section under specified axial load level (λ). Fig. 2-7 shows the effect of 1 hr standard ASTM-E119 fire exposure on the studied unrestrained section of beam B1 (λ equals to zero). As shown in Fig. 2-7, elevated temperatures increase the ductility and reduce the capacity of RC sections during fire exposure. The initial point of the moment-curvature diagram after 1 hr fire exposure defines the equilibrium curvature . This curvature value represents the initial rotation of B1 due to the non-linear thermal distribution combined with the material weakening. This initial curvature will occur regardless of the external effect of the applied moments.
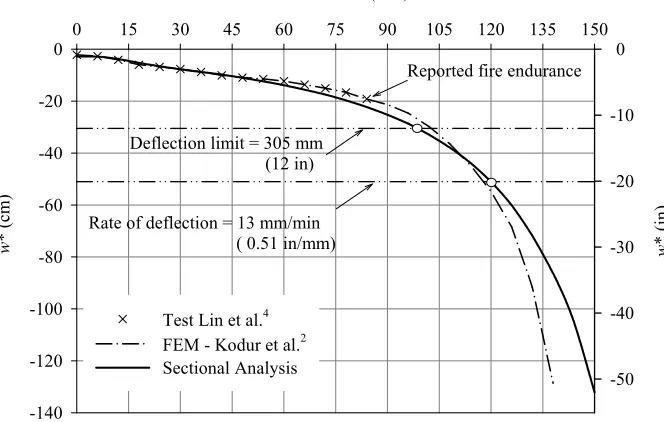
elevated temperatures on the shear capacity, bond loss between steel bars and concrete, and concrete spalling were not considered in the sectional analysis. The obtained results are plotted in Fig. 2-8. An excellent match is found between the sectional analysis, the FEM conducted by Kodur and Dwaikat2 , and the experimental results (up to 80 minutes). Failure criteria proposed by BS 476 and adopted by Kodur and Dwaikat2 are used. These criteria are setting limits for the maximum allowable deflection, Eq. (11), and maximum rate of deflection, Eq. (12).
in] [12 mm
max
L
305
20
(11)
in/minute]
[0.51 mm/minute
13
max
d L
t 9000
2
(12)
Where L is the span between the supports (mm) and d is the effective depth of the beam (mm) [1 in = 25.4 mm]
Curvature (1/in)
0 1x10⁻³ 2x10⁻³ 3x10⁻³ 4x10⁻³ 5x10⁻³ 6x10⁻³
M ome nt ( ft .Ib ) x 10 10 0 2 4 6 8 10 12 Curvature (1/mm)
0 50x10-6 100x10-6 150x10-6 200x10-6 250x10-6
M ome nt ( kN. m) 0 20 40 60 80 100 120 140 160 180
Prior to Fire 1 hr fire exposure
Fig. 2-7-Effect of fire temperature on the moment – curvature relationship for B1
Fire duration (min)
0 15 30 45 60 75 90 105 120 135 150
w * (cm) -140 -120 -100 -80 -60 -40 -20 0 w * (in ) -50 -40 -30 -20 -10 0
Test Lin et al.4 FEM - Kodur et al.2 Sectional Analysis
Reported fire endurance
Deflection limit = 305 mm (12 in)
Rate of deflection = 13 mm/min ( 0.51 in/mm)
Fig. 2-8-Validation of sectional analysis methodology by prediction the deflections
of B1 during fire exposure
i
2.5 Stress-Block Parameters at Ambient Temperature
Reinforced concrete beams are currently designed for flexure at ambient conditions by assuming a linear strain distribution and converting the nonlinear stress distribution to an
equivalent stress-block. This conversion is done using the stress-block parameters1 and
1
. The recommended values for the stress-block parameters at ambient temperature in the Canadian code CSA A23.3-0410 depend on f’c to account for high strength concrete
and are given by:
c f' .
.
085 00015 1
(13a)
c f' .
.
097 00025 1
(13b)
The nominal moment at failure Mn can therefore be calculated from section equilibrium
as follows
b c f
C 1 'c1 (14a)
s y
s f A
T (14b)
s T
C (calculate c) (14c)
) (
) or (
2
1 c
d T C
Mn s (14d)
Where C is the compression force in the concrete, c is the depth of neutral axis, b is the width of the compression zone, Ts is the tension force in steel assuming yielding or
reinforcement, fy is the yield stress of steel bars, As is the area of tensile steel bars, and d
h
b
A
#10@600 mm
52.5 s
A' = 0.0s
52.5 52.5
2.6 Stress-Block Parameters at Elevated Temperatures
The effect of fire temperature on the ambient stress-block parameters 1 and 1 is
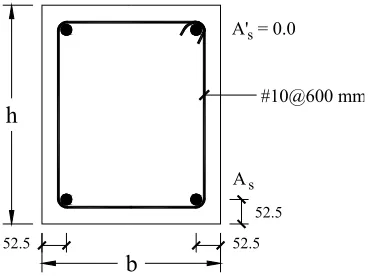
evaluated in this section through an extensive parametric study. A total of 28 rectangular cross-sections are analyzed to study the stress distribution at different fire durations. Table 2-1 shows details of the beams that are subjected to sagging bending moments (positive moments). On the other hand, Table 2-2 shows details of beams that are subjected to hogging bending moments (negative moments). The studied parameters are; fire duration ( ), geometry of the sections (b and h), reinforcement ratio (ρ) and
configuration, concrete compressive strength ( f' ), and aggregate type. The effect of c compression reinforcement is neglected for simplicity.
Fig. 2-9 shows details for the studied cross-sections. All the beams are subjected to the standard ASTM-E119 fire from three faces, i.e. the two sides and the bottom surface of each beam. A sectional analysis was conducted for each beam at different fire durations starting from 0.0 hr and up to 2.5 hr with time intervals of 15 min. For each time step, the
stress-block parameters at elevated temperature 1T and 1T are evaluated by predicting the total strain distribution (ε) at failure using the proposed sectional analysis methodology. The mechanical strain (ε) is then isolated and the stress distribution is obtained based on it. The following sub-sections explain these steps for beams B4, sagging moment, and B18, hogging moment.
Fig. 2-9-Details of the studied RC beam “B4” in the parametric study
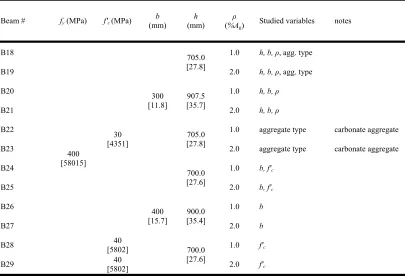
Table 2-1–Parametric study cases (sagging moment)
Beam # fy(MPa)
[psi] f'c [psi](MPa)
b (mm) [in] h (mm) [in] ρ
(%Ag) Studied variables Notes
B2 400 [58015] 30 [4351] 300 [11.8] 502.5 [19.8]
1.0 h, ρ
B3 2.0 h, ρ
B4 705.0
[27.8]
1.0 h, ρ, b , agg. type
B5 2.0 h, ρ, b , agg. type
B6 907.5
[35.7]
1.0 h, ρ
B7 2.0 h, ρ
B8 400
[15.7]
700.0 [27.6]
1.0 f'c, b
B9 2.0 f'c, b
B10 300
[11.8] [27.8] 705.0
1.0 aggregate type carbonate aggregate
B11 2.0 aggregate type carbonate aggregate
B12 40 [5802] 300 [11.8] 907.5 [35.7] 1.0 B13 2.0
B14 705.0
[27.8]
1.0 RFT configuration
B15 1.0 RFT configuration 2 layers RFT
B16 400
[15.7]
700.0 [27.6]
1.0 f'c
B17 2.0 f'c
Table 2-2–Parametric study cases (hogging moment)
Beam # fy(MPa) f'c (MPa) (mm)b (mm)h (%Aρ
g) Studied variables notes
B18 400 [58015] 30 [4351] 300 [11.8] 705.0 [27.8]
1.0 h, b, ρ, agg. type
B19 2.0 h, b, ρ, agg. type
B20 907.5
[35.7]
1.0 h, b, ρ
B21 2.0 h, b, ρ
B22
705.0 [27.8]
1.0 aggregate type carbonate aggregate
B23 2.0 aggregate type carbonate aggregate
B24
400 [15.7]
700.0 [27.6]
1.0 b, f'c
B25 2.0 b, f'c
B26 900.0
[35.4]
1.0 b
B27 2.0 b
B28 [5802] 40 700.0
[27.6]
1.0 f'c
![Fig. 2-15- Temperature contour map in oC of B30 [1 oF = 1.8 oC + 32]](https://thumb-us.123doks.com/thumbv2/123dok_us/7789866.1290288/67.612.144.533.145.416/fig-temperature-contour-map-oc-b-oc.webp)