DIGITAL ELEVATION MODEL GENERATION AND ACCURACY ASSESSMENT USING ASTER SATELLITE IMAGE
KOMEIL GHASEMNATAJROKNI
DIGITAL ELEVATION MODEL GENERATION AND ACCURACY ASSESSMENT USING ASTER SATELLITE IMAGE
KOMEIL GHASEMNATAJROKNI
A thesis submitted in fulfillment of the requirement for the award of the degree of Master of Science (Geomatic Engineering)
Faculty of Geoinformation Science and Engineering Universiti Teknologi Malaysia
iii
iv
ACKNOWLEDGEMENT
Verily praises are indeed due to Allah (SWT), the author of all good things. I will never be able to thank Allah (SWT) for helping me in all my life and especially in this project.
Firstly I would like to thank my supervisor for helping me to do this project and thesis writing support and encouragements. I could not be able to finish this project without his helps, guides and encouragements. Secondly I am grateful to LPDAAC (NASA Land Processes Distributed Active Archive Center User Services) to helping and providing the ASTER stereo image for me.
v
ABSTRACT
vi
ABSTRAK
The Advanced Spaceborne Thermal Emission and Reflection Radiometer
(ASTER) diletakkan dalam kapalangkasa Terra milik National Aeronautics and
Space Administration’s (NASA) yang menyediakan data imej stereo digital
vii
TABLE OF CONTENTS
CHAPTER TITLE PAGE
TITLE PAGE i
DECLARATION ii
DEDICATION iii
AKNOWLEDGEMENT iv
ABSTRACT v
ABSTRAK vi
TABLE OF CONTENTS vii
LIST OF TABLES xi
LIST OF FIGURES xii
LIST OF ABBREVIATIONS xv
LIST OF APPENDICES xvi
1 INTRODUCTION 1
1.1 Background 1
1.2 Problem Statement 4
1.3 The Aim and Objectives of Research 4
viii
1.5 Research Scope 6
1.6 Research Methodology 7
1.7 Thesis Outline 11
2 LITERATURE REVIEW 12
2.1 Satellite Imagery 12
2.2 Epipolar Geometry and Images 13
2.3 Image Matching 15
2.4 Digital Elevation Model 16
2.4.1 Background 16
2.4.2 Generation of DEM 17
2.4.3 Types of DEM 18
2.5 3D Surface View 18
2.6 3D Modeling 19
2.7 Studies Related to this Project 20
3 METHODOLOGY 26
3.1 Introduction 26
3.2 Data Input 26
3.3 Processing Procedures 27
3.3.1 GDTS Software 27
3.3.2 Processing Procedures in ENVI 28
3.3.2.1 Working with the DEM extraction 28
wizard 3.3.2.2 Inputting a Stereo Image Pair 28
3.3.2.3 Defining Ground Control Points 32
ix
3.3.2.5 Calculating Epipolar Geometry and 37
Images 3.3.2.6 Specifying DEM Output Projection 40
Parameters 3.3.2.7 Specifying DEM Extraction 41
Parameters 3.3.2.8 Examining Results 44
3.3.2.9 Loading the DEM Result to the Display 44
and Performing 3D Surface View 3.3.3 Processing Procedures in PCI 50
3.3.3.1 Create a New Project 51
3.3.3.2 Data Input 52
3.3.3.3 Collection of GCPs and TPs 55
3.3.3.4 Model Calculation 58
3.3.3.5 Create Epipolar Images 59
3.3.3.6 DEM Extraction 61
3.3.3.7 Edit DEM 63
3.3.3.8 3D Surface View 64
4 RESULTS AND ANALYSIS 65
4.1 Introduction 65
4.2 Epipolar Images Creation 66
4.3 DEM Generation 70
4.4 3D Surface View 74
4.5 Quality Assessment of the Methods 75
4.5.1 Qualitative Assessment 78
x
5 CONCLUSION AND RECOMMENDATION 83
5.1 Introduction 83
5.2 Limitations and Problems of the Study 84
5.3 Conclusion 85
5.4 Recommendation 86
BIBLIOGRAPHY 87
xi
LIST OF TABLES
TABLE NO. TITLE PAGE
4.1 Points Height in Base DEM 80
4.2 Points Height in ENVI DEM 80
4.3 Points Height in PCI DEM 81
4.4 Comparing of Heights between Base DEM and ENVI DEM 81
4.5 Comparing of Heights between Base DEM and PCI DEM 82
xii
LIST OF FIGURES
FIGURE NO. TITLE PAGE
1.1 ASTER Satellite Image (2002) 7
1.2 Flowchart of Research Methodology 8
2.1 Epipolar Geometry 14
3.1 ENVI startup 29
3.2 Bands window 30
3.3 Display DEM startup 30
3.4 Stereo image selection dialog box 31
3.5 Source of GCPs selection window 33
3.6 GCPs collection 34
3.7 GCPs coordinate 34
3.8 Source of tie points selection window 35
3.9 Tie points collection window 36
3.10 Tie points collection display 37
3.11 Epipolar images generation window 38
3.12 Epipolar image 39
xiii
3.14 DEM extraction window 43
3.15 Georefrence startup display 45
3.16 Georefrence band selection window 45
3.17 Coordinate system selection dialog box 46
3.18 Georefrencing output projection window 46
3.19 Drape CIR on DEM 47
3.20 Georefrenced image display 48
3.21 3D surface view creation 48
3.22 3D surface view band selection window 49
3.23 3D surface view input parameters dialog box 49
3.24 3D surface view 50
3.25 PCI Startup window 51
3.26 Set projection window 52
3.27 Data input processing step window 53
3.28 Band 3n selection window 54
3.29 Band 3b selection dialog box 54
3.30 GCP/TP collection processing step window 55
3.31 GCPs collection display 56
3.32 Band 3n GCPs collection display 56
3.33 Band 3b GCPs collection display 57
3.34 Tie points collection window 58
3.35 Bundle Adjustment dialog box 58
3.36 DEM processing step dialog box 59
3.37 Epipolar images generation dialog box 60
xiv
3.39 DEM Extraction display 62
3.40 DEM Extraction window 62
3.41 DEM edition window 63
4.1 An area cropped from the epipolar image of PCI 67
4.2 Another area cropped from the epipolar image of PCI 67
4.3 Close up area from the epipolar image of PCI 68
4.4 Close up area from the epipolar image of ENVI 68
4.5 Close up view of epipolar image from ENVI after 69
enhancement 4.6 Another view of close up epipolar image from ENVI 69
after enhancement 4.7 DEM generated from PCI 71
4.8 DEM generated from ENVI 71
4.9 3D view of PCI DEM 72
4.10 3D view of ENVI DEM 72
4.11 3D view of ENVI DEM at an angle 73
4.12 3D view of ENVI DEM at different angle 73
4.13 3D surface view from PCI DEM 74
4.14 3D surface view from ENVI DEM 75
4.15 Base DEM 77
xv
LIST OF ABBREVIATIONS
3D - Three Dimension
ASTER - Advanced Spaceborne Thermal Emission and Reflection Radiometer
DEM - Digital Elevation Model
GCP - Ground Control Point
GPS - Global Positioning System
LPDAAC - Land Processes Distributed Active Archive Center
TP - Tie point
xvi
LIST OF APPENDICES
APPENDIX TITLE PAGE
A ASTER image information 91
CHAPTER 1
INTRODUCTION
1.1 BACKGROUND
A number of techniques and technologies are currently in use to capturing and modeling 3D information of built environment. These consist of total station, Global Positioning System (GPS), photogrammetry, remote sensing technologies and also laser scanning technology. Today, 3D modelling is employed in a wide variety of activities. The video game industry uses various three dimensional modelling methods to create realistic character models for video games. In the medical field, detailed models of human body organs are created using various advanced 3D modelling software. The engineering community uses 3D computer aided design programs to create three dimensional models of new devices, vehicles and structures.
2
seldom available, and photogrammetric is the most common technique to produce DEM for decades. Dependence on analogue aerial images ended formally in 1980, when the American Society of Photogrammetry and Remote Sensing (ASPRS) included the possibility of using digital data from remote sensing in its definition of photogrammetry (Slama, 1980).
The quality of Digital Elevation Models (DEMs) elaborated from stereoscopic pairs is affected by the topography of the terrain and the data source (aerial photographs or digital satellite images), as well as other variables that depend on the data (aerial or spatial), on the algorithms used in the photogrammetric workstations, and on the data structure such as the triangulated irregular networks (TIN) versus uniform regular grids.
Digital photogrammetric techniques have been known for decades, but the possibility of using stereoscopic images from satellites for global digital elevation data production did not arised until the launch of the SPOT series in 1986. Today several satellites also offer the possibility for stereoscopic acquisition: SPOT, MOMS, IRS, KOMSAT, AVNIR (Hashimoto, 2000), TERRA and more recently, the high resolution push broom scanners IKONOS (September 1999), EROS-A1 (December 2000), QUICKBIRD-2 (October 2001), SPOT 5 (May 2002), and ORBVIEW-3 (June 2003). Thus, some studies focus on constructing DEM from stereoscopic images by means of high resolution push broom scanners, IKONOS (Toutin et al., 2001), EROS A1, SPOT 5 (Petrie, 2001); furthermore, it is assumed that the automatic generation of a DEM from remotely sensed data with a Z sub pixel accuracy is possible.
3
difficulty of identifying the ground control points (GCP), or the existence of radiometric differences among the images due to acquisition at different dates that may make the stereo-matching process more difficult.
Accuracy estimation can be carried out by comparing the DEM data with a set of check points measured by high precision methods. The basic conditions for a correct work flow are: a) high accuracy of check points, and b) enough points to guarantee error control reliability. Deriving DEM from stereoscopic satellite images is not new; however accuracy results and the method used to calculate error and reliability in DEM differ according to the literature revised. This variation may be due to the method used to estimate error in DEM by using the check points.
DEM accuracy is estimated by a comparison with DEM Z values, and by contrasting many check points with “true” elevations. The pair wise comparisons allow the calculation of the Mean Error (ME), Root Mean Square Error (RMSE), Standard Deviation (SD) or similar statistics. It‟s obvious that reliability in the processes is not a constant but depends on several factors. The number of check points is an important factor in reliability because it conditions the range of stochastic variations on the standard deviation values. Another factor is obvious where the number of check points must be sufficient for the accuracy assessment.
4
1.2 PROBLEM STATEMENT
For decades almost every community or city around the globe has relied on 2D maps to represent their living environment. These maps have helped a lot in solving problems in variety of area. However, some problems such as performing analysis on flight and communications signals, landslide analysis, calculating cut and fill volumes in earth works, and finding height and volume of features were found impossible to be solved using 2D maps. Therefore, 3D model representation of places is very important for analysis and other findings that can only be done using 3D spatial representation.
The matching problem and the mathematical model relating the scene and ground coordinates of corresponding points are the most difficult problems associated with DEM generation from high resolution imaging satellites. To ensure a reliable solution of the matching problem, prominent features, as represented by an interesting signal around the selected primitives are usually used. Problems arised when the geometric correction of satellite imagery in areas where suitable topographic maps are not available. GPS technology is increasingly seen as a potential solution in such areas.
1.3 THE AIM AND OBJECTIVES OF RESEARCH
The aim of this project is to generate DEM based on ASTER satellite image. The specific objectives are:
5
1.4 SIGNIFICANCE OF RESEARCH
The significance of the research covers the benefit that will be potentially gained when this research is implemented. This project is limited to generation of DEM of Johor state environment. The document of this project can be used as resource for students and other researchers for further research and consultancy works.
The DEM generated from satellite stereo pairs have some significant advantages over other sources:
1. World wide availability of satellite data without any restriction (often available as archived data) as against restricted and non availability of topographical maps and aerial photographs.
2. Large area coverage per scene. 3. Medium resolution.
4. Faster processing through sophisticated software and little manual effort. 5. Low processing cost.
6. All weather and day/night image acquisition capabilities (in case of microwave sensors).
6
1.5 RESEARCH SCOPE
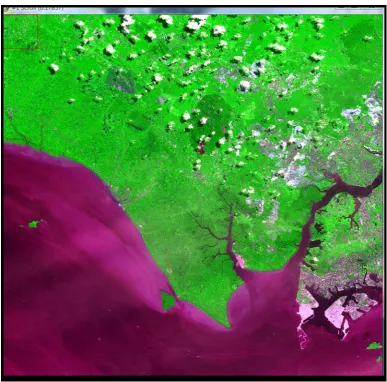
The research scope covers the limit of the research. In this research the limits are as follows. The research area covers the satellite image of south Malaysia and some part of Singapore (Figure 1.1). Stereo pair of satellite image is used in this research for generation of DEM using different remote sensing software.
ASTER LEVEL 1A.hdf covering south of Malaysia and some part of Singapore, ASTER LEVEL 1A hdf.met and ground control points(GCPs) are used as input data in this project (the ASTER information is shown in Appendix A). The GCPs were established using GPS technology.
7
Figure 1.1: ASTER Satellite Image (2002)
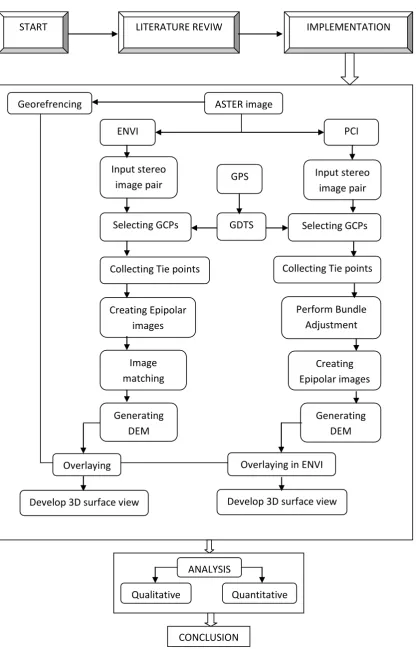
1.6 RESEARCH METHODOLOGY
8
Figure 1.2: Flowchart of the research methodology ASTER image
Georefrencing NCE
ENVI PCI
Input stereo image pair
Input stereo image pair
Selecting GCPs Selecting GCPs
Collecting Tie points Collecting Tie points
Creating Epipolar images Perform Bundle Adjustment Image matching Generating DEM Creating Epipolar images Generating DEM Overlaying
Develop 3D surface view
Overlaying in ENVI
Develop 3D surface view GPS
GDTS softwa
START LITERATURE REVIW IMPLEMENTATION
ANALYSIS
Qualitative Quantitative
9
Literature review stage
The literature review is to explore the 3D view and DEM generation methodology, and tools required by referring to internet, magazines, books, conference paper or journal paper. This provides foundation of knowledge in order to conduct a good research. The research problem is formulated at this stage. Furthermore, scope of the research is also defined in this stage. The references that served as guides for conducting this research were also gained from the literature review.
Planning stage
The planning stage is where preparation is done prior to research implementation. This stage involves the development of conceptual framework, selection of software as well as data sources for the research. Software practice, understanding for data processing and model development are also done at this stage.
Implementation stage
10
i. Geodetic Datum Transformation System (GDTS) version 4.01
The coordinate system obtained from GPS instrument is in Malaysian RSO and need to be converted to WGS 84. By using this software the conversion is carried out.
ii. PCI Geomatica version 9.1
Ground control points collection and generation of tie points were performed at this stage. Subsequently, epipolar images are created and finally Digital Elevation Model (DEM) is generated. Then this DEM is exported to ENVI to develop 3D surface view.
iii. ENVI version 4.5
Stereo bands selection and GCP/TP collection are performed in this softwar too. Then Epipolar images and DEM were generated. After that, 3D surface view is developed by overlaying DEM and georefrenced ASTER image.
Result and analysis stage
11
Conclusion and recommendation stage
The final outcome of the entire process from this research is concluded from which necessary recommendations is made based on the outcome.
1.7 THESIS OUTLINE
Chapter One: Introduces the research topic, the background of study, problem statement, the objective, significant of the study, scope and methodology adopted.
Chapter Two: The literature review is to explore the DEM generation methodology and tools by referring to Internet, magazines, books and conference or journal papers.
Chapter Three: The respective steps that were involved in the implementation of the study in order to produce the objective achieving results are discussed in this chapter.
Chapter Four: This chapter discussed the results and analysis of this study from which necessary conclusion and recommendation will be made. The analysis is done right after each result is presented so as to get clear understanding of the picture behind the results of each achieved objective.