Siyka ZLATANOVA1, Alias Abdul RAHMAN2 and Morakot PILOUK3
1
GIS Technology Section, Delft University of Technology, Thijsseweg 11, 2629JA, Delft, The Netherlands. [email protected].
2
Department of Geoinformatics, Universiti Teknologi Malaysia, 81310 UTM Skudai, Johor, Malaysia. [email protected].
3
Environmental System Research Institute (ESRI), 380 New York Street, Redlands, California, USA. [email protected]
Abstract:
Currently, a variety of software is capable of handling a wide range of spatial problems, beginning with approaches for describing spatial objects to quite complex analysis and 3D visualisation. However, an increasing number of applications need more advanced tools for representing and analysing the 3D world. Among all types of systems dealing with spatial information, GIS has proven to be the most sophisticated system that operates with the largest scope of objects (spatial and semantic), relationships and provide means to analyse them. However, what is the status of 3D GIS? It is the aim of this paper to find the answer by analysing both available software and efforts of researchers. An overview of several software packages and 3D case studies performed in Oracle and Microstation is given to provide knowledge about the 3D functionality offered by commercial systems. The most significant achievements in the 3D research area concerning key issues of 3D GIS, i.e. 3D structuring and 3D topology are summarized to portray the current research status. At the end, some of the issues and problems involved in developing such a system are presented and recommendations on directions for further research are made. The scope of the paper is limited to 3D GIS systems and research in vector domain. Problems of subsurface applications are excluded as well.
1 Introduction
The need for 3D information is rapidly increasing. Currently, many human activities make steps toward the third dimension, i.e. urban planning, cadastre, environmental monitoring, telecommunications, public rescue operations, landscape planning, transportation monitoring, real-estate market, hydrographical activities, utility management, military applications. Practically, the area of interest grows significantly when 3D functionality is offered on the market. Moreover, the role of geo-information in all kinds of business processes is getting quite transparent. Terms such as “location-specific information” and “location-based services” become a part of the daily business language to denote the link between the virtual world of information (transactions, events, internet communication) and the real world of information - customers, inventory, shipping and the like. Most business transactions rely on information systems to operate successfully, as the geo-information (location-specific geo-information) is critical for many of them (see Sonnen and Morris, 2000). Once the developments in 3D GIS provide a compatible functionality and performance, the spatial information services will evolve into the third dimension.
deficiencies of all the systems to handle 3D objects, the data are often spread between several systems. For example, one system is used for data storage and another for 3D visualisation. This situation often faces inconsistency problems, which leads to extra time, efforts and money to find the appropriate solution.
This paper summarises the current status of 3D GIS development. Firstly, we concentrate on recent achievements reported by vendors. We briefly present our survey on the possibilities of some GIS’s available on the market and analyse two case studies completed on commercial systems. Secondly, we review attempts by researchers toward providing an appropriate structures and operations for 3D spatial analysis and visualisation. Final discussion recommends directions and topics for further research and implementations.
2 3D GIS in the market
There are few commercial-of-the-shelf (C.O.S.T) systems that can be categorised as systems that attempt to provide a solution for 3D representation and analysis. Four systems are chosen for detailed consideration, because they constitute a large share of the GIS market and provide some 3D data processing functions. The systems are the 3D Analyst of ArcGIS (see ESRI Inc.), Imagine VirtualGIS (ERDAS Inc., http://www.erdas.com), GeoMedia Terrain (Intergraph Inc.,
http://www.integraph.com) and PAMAP GIS Topographer (PCIGEOMATICS, http://
www.pcigeomatics.com). Parts of the following text are based on available literature and
Web-based product reviews.
Figure 1: Commercial GIS: ArcScene, ESRI (left) and Imagine Virtual GIS, ERDAS (right)
2.1 Traditional GIS vendors
ArcGIS 3D Analyst, ESRI: The 3D Analyst (3DA) is one of the modules available in ArcGIS GIS.
the distributed environment using ESRI ArcIMS. Although major progress on improving 3D visualization, animation, and data access has been made, full 3D geometry for 3D representation, topological relationships and analysis remain as areas to be addressed.
Imagine VirtualGIS, ERDAS: It is worth mentioning that the Imagine system was originally
developed for remote sensing and image processing tasks. The recently provided GIS module is called VirtualGIS and supplies some 3D visual analysis tools. It is a system that has an emphasis on dynamic visualisation and real-time display in the 3D display environment. Interesting 3D visualisation features of the system are: 1) the possibility to include rapidly 3D models in a selected polygon or along a line (e.g. 3D models of trees in a forest area) and 2) the logo layer that can accommodate a 2D image into the 3D scene and stretch it over the entire view as foreground (e.g. cockpit in a fly animation, Figure 1, right). Besides these and other extensive 3D visualizations, the system also provides fly-through capabilities. As with 3DA this system also centres on 3D visualization with true 3D GIS functions hardly available.
GeoMedia Terrain, Integraph.Inc: GeoMedia Terrain is one of the subsystems that work under
the GeoMedia GIS. The system runs under the Windows operating systems. The Terrain system performs three major terrain tasks, namely, terrain analysis, terrain model generations, and fly-through. The navigation tool ActiveFlight provides the three most common navigation modes -- free flight, constant above ground elevation and terrain avoidance. It also offers the ability to save and restore viewpoints. In general, the GeoMedia Terrain serves as DTM module for the GeoMedia GIS without true 3D GIS capabilities.
PAMAP GIS Topographer, PCIGeomatics: It runs under Windows operating systems. PAMAP
GIS is a raster and vector system considered by many (Limp, 2002) the most integrated system (i.e. points and lines are represented as vectors and areas as raster). Four main GIS modules, i.e. Mapper, Modeller, Networker and Analyser form the core system. Topographer, similarly to other terrain systems, provides terrain analysis and display system with the ability to perform a number of functions including the calculation of slope, aspect, visibility, and the generation of perspective views. As a decision-making tool, Topographer gives answers to visibility and planning issues, such as site location and viewing areas. Besides 3D terrain data, Topographer can process any 3D data, including temperature, rainfall and pollution concentrations. Again, true 3D objects cannot be handled by the system
In summary, all the systems revealed little provision of 3D GIS functionality in terms of 3D structuring, 3D manipulation and 3D analysis but most of them can efficiently handle 3D data in the 3D visualization aspect. A fully integrated 3D GIS solution has yet to be offered by general-purpose GIS vendors.
2.2 Geo-DBMS
The GIS, i.e. integration of semantic and geometric data, and spatial relationships, seems to be the most appropriate system ensuring a large scope of analysis and thus serving many applications and daily activities. Therefore, vendors dealing with either spatial or semantic information attempt to achieve the GIS functionality already for years. CAD vendors (such as Autodesk, Bentley) provide means to link 2D, 3D geometry to semantic data and organise topologically structured layers; DBMS (Oracle, Informix) introduce spatial descriptors to represent geometry data and maintain them together with the semantic data. A logical consequence of all the attempts is the agreement on the manner for representing, accessing and disseminating spatial information, i.e. the OpenGIS specifications (http://www.opengis.org/). This agreement makes possible efforts of vendors and researches from different fields to be united and streamed to one direction, i.e. development of a functional GIS. The result is the changed role of DBMS. This is to say, it becomes Geo-DBMS, an integrated “container” of semantic and geometric properties of real-world objects attempting to provide functionality to store, retrieve and analyse spatial data
Here, we will briefly present the representation of geometry in Oracle Spatial (http:
objects are defined by the geometric type. Currently, the supported geometric types are 2D but 3D coordinates are accepted. The rules for objects description are very simple and intuitive. Lines and polygons are represented as an ordered set of coordinates (2D or 3D). Self-intersecting lines are allowed but self-intersecting polygons are not supported. Polygons with holes are maintained as well. Oracle is an object-relational DBMS and the geometric types are defined using exactly the object-oriented approach. They are defined in the mdsys.sdo_geometry object-relational model and contain information about type, dimension, coordinate system, holes of objects, and provide a list with the coordinates.
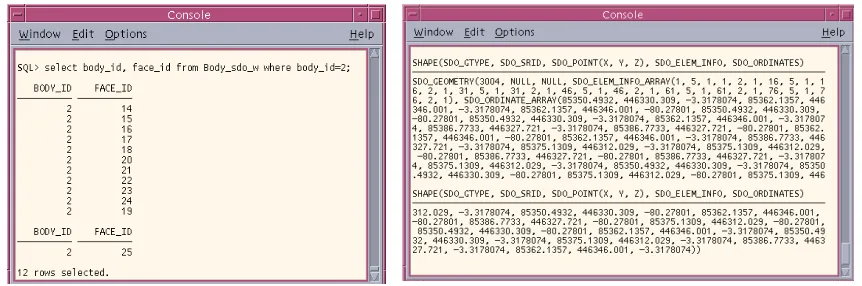
Figure 2: Oracle’s mdsys.sdo.geometry object (left) and representation of one polygon in Oracle Spatial 8i (right)
In Oracle Spatial 9i, the SDO_GTYPE allows decoding of seven geometric types namely point,
line or curve, polygon, collection, multipoint, multiline or multicurve and multipolygon. The type
collection gives the possibility of different geometric types to be organised and considered as
individual spatial objects. Figure 2 shows the representation of one 3D polygon (a face from a 3D object).
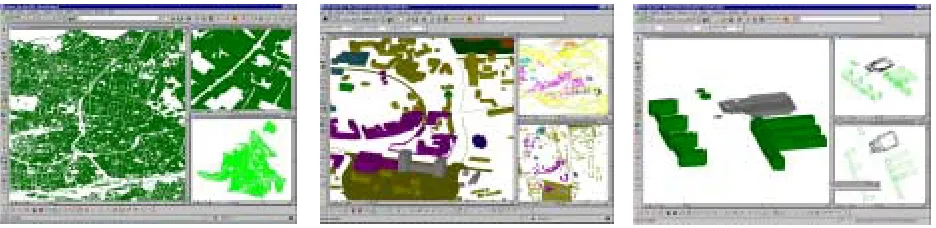
Figure 3: The data sets used in the experiments: Vienna (left), Enschede (middle) and TUDelft (right)
3 Experiments with Oracle Spatial and GeoGraphics iSpatial
Several CAD/GIS applications (MicroStation, AutoCAD, MapInfo) already embrace OpenGIS specifications. We have selected MicroStation Geographics iSpatial (http://www2.bentley.com/
products/default.cfm) to investigate the 3D functionality offered at present. GeoGraphics iSpatial
To investigate the functionality of the two software products in representing, maintaining and visualising 3D spatial objects, we have completed two case studies following two different approaches. In the fist case study, we have the 3D data organised in Oracle Spatial in user-defined relational tables and the task was to access, query and edit them from GeoGraphics. In the second case, the 3D data were available in a DGN file and had to be imported in Oracle Spatial.
3.1 Case Study 1: 3D data organised in user-defined relational tables
A set of 21,000 buildings from the city of Vienna is used for the test (Figure 3, left). The data were initially organised in a 3D topological model, i.e. SSM (Zlatanova, 2000), and mapped into several relational tables in Oracle. A procedure written in PL/SQL (i.e. a high-level programming language in Oracle) converted the data from the topological to the geometric model of Oracle Spatial. A similar topology-geometry procedure is described in Oosterom et al (2002). Currently, the 3D objects can be represented in Oracle Spatial as a set of polygons in two different ways. Table 1 shows the two possible descriptions (columns in the relational tables) with respect to the different geometries used. In the first representation, each building has unique identifier (ID), stored in the column BODY_ID (Figure 4, left). The column FACE_ID contains the unique ID of the face. The geometry of each face is organised as 3D polygon (SDO_GTYPE=3003, 3D polygons) in the column SHAPE. Apparently, several records (at least 4) represent every 3D object in the relational table. Although a bit inefficient, this structuring facilitates some types of queries (due to the stored relationships between the faces and the 3D object). For example, the query “find the neighbouring building” can be completed by comparing the IDs of the faces composing the buildings and thus avoiding the coordinate comparison.
Table 1: Descriptions of BODY_SDO table by: 3D polygons and a 3D collection.
Name Null? Type
--- MSLINK NOT NULL NUMBER(10) BODY_ID NUMBER(10) FACE_ID NUMBER(10) SHAPE MDSYS.SDO_GEOMETRY
Name Null? Type
--- MSLINK NOT NULL NUMBER(10) SHAPE MDSYS.SDO_GEOMETRY
In the second representation (Figure 4, right), the MSLINK column includes the ID of the building and the SHAPE column contains the 3D coordinates of all the polygons composing one building. Thus, every building is described as a collection of polygons (SDO_GTYPE=3004, 3D collection). Although the number of records is reduced (i.e. one building is represented by only one record), the redundancy of coordinates cannot be avoided. Each triple of coordinates is repeated at least three times in the list of coordinates (i.e. in SDO_ORDINATES).
Figure 4: 3D object represented as a set of polygons (left) and as a collection (right) in Oracle Spatial
polygons. To send the changes back to the database, regrouping of the polygons will be required. Otherwise, the object will be considered a set of several new polygons. The steps to assess and query objects are described in details in Zlatanova et al (2002). Basically, three major steps have to be followed:
a) Establishing a reference between spatial layers (in GeoGraphics) and the relational tables (in Oracle Spatial). Since the table with the geometric types (in Oracle Spatial) already exists, it needs to be declared as a spatial layer in GeoGraphics.
b) Creating semantics, i.e. features and categories
c) Linking features with the spatial objects. Running an appropriate script within Oracle is one of the easiest ways to complete this operation in case of many objects.
3.2 Case Study 2: 3D data organised in DGN file
The data set for the second case study is obtained from a semi-automatic procedure for 3D reconstruction developed at ITC, Enschede, The Netherlands (Tempfli, 1998). The manual digitising of points characterising roofs of buildings in a photogrammetric stereo model (from aerial photographs) creates a “skeletal point cloud”. The 3D reconstruction then consists of automatically computing and assembling all the faces (roof faces and walls) of the building from this point cloud. The model obtained in this way contains planar closed polygons, whose normal vectors point towards the outside of the building (to ensure correct 3D visualisation). The procedure is capable of processing a number of objects (not only buildings) as the reconstruction rules for other topographic objects are in most cases simpler than those for buildings. All reconstructed objects are organised in the topological data structure 3D FDS (Molenaar, 1992). In addition, a new DGN file with the 3D reconstructed model is created. This procedure (running on
SocetSet, Leica) was applied to reconstruct the centrum of Enschede (Figure 3, middle). Another
adaptation of the same idea for SoftPlotter
(http://www.autometric.com/NEW/Products/Production/sp.html) is presented in Vermeij and
Zlatanova (2001), which allowed the reconstruction of several buildings in the campus area of the TUDelft. The 3D objects of these two procedures were also successfully imported in Oracle Spatial by the following steps:
a) Creation of features and categories.
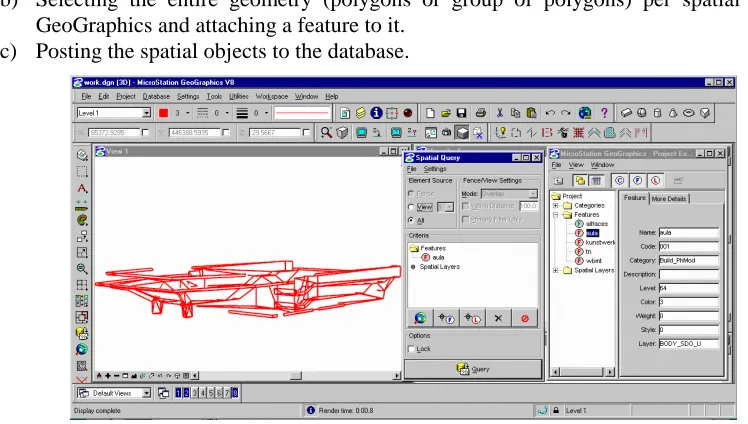
b) Selecting the entire geometry (polygons or group of polygons) per spatial objects in GeoGraphics and attaching a feature to it.
c) Posting the spatial objects to the database.
Figure 5: The Aula, TUDelft: 3D model queried in GeoGraphics
quite convenient for editing and updating large 3D models. Rendering of thousands of polygons can be easily avoided.
3.3 Analysis of the offered 3D functionality
The case studies have clearly shown that the operations needed to access and manipulate spatial data are still not transparent, standardised and user-friendly. The user is expected to have excellent skills in both systems, i.e. understanding the conceptual representation in GeoGraphics iSpatial and being aware of the implementation in relational tables in Oracle Spatial.
Data Structuring. The concepts implemented in both systems follow closely the OpenGIS
specifications, i.e. the notation of a geographic feature, and the way in which spatial characteristics are represented by geometric and topological primitives. Nevertheless, the implementations are still not completely application independent. The test has revealed that one significant part of the information about the geographic feature is maintained at a database level. However, the notations (table names, columns, object definitions) have very specific application-oriented (in this case MicroStation) meaning. For example, if the user decides to keep the database and change the CAD package, he/she will need to create the feature-geometry link from scratch.
As was mentioned before, despite the lack of a real 3D object, description of 3D data is possible in the geometry types of Oracle spatial. The Z value is maintained together with the X,Y values, i.e. it is not an attribute. Another positive discovery is the definition of mdsys,sdo_geometry object in Oracle Spatial, which allows a straight forward extension toward describing a 3D object. Stoter and Oosterom (2002) propose new values of the mdsys.sdo_geometry parameters object to describe 3D objects (e.g. tetrahedron, polyhedron, polyhedron with holes, etc.). The SDO_ORDINATES array is suggested to have two sections, i.e. a list of coordinates and references to the list. This approach will reduce considerably the size of the array, which is a critical consideration in maintaining 3D data.
The support of parameters to describe physical properties of 3D objects is still missing. Currently, feature description (in FEATURE and UGFEATURE tables) permits properties of lines (e.g. colour, width, gaps width, type line) to be specified, but properties of polygons are not considered. For example, the colour of a polygon (in rendering mode) is selected with respect to the colour of the line. 3D realistic visualisation is practically not possible due to lack of a mechanism to specify texture parameters per face.
Data Analysis. Real possibilities to analyse 3D data in GeoGraphics iSpatial and Oracle Spatial are
still missing. Tools to perform spatial operations (2D topology or operators using the geometric model of Oracle) are provided but they operate with only X, Y coordinates. Some of the operations accept X, Y, Z values but the computations are purely 2D.
Data Manipulation and Visualisation. Apparently the greatest benefits of the DBMS-CAD
4 3DGIS in the research
The research in 3D GIS is intensive and covers all aspects of acquisition, storage and analysis of real world phenomena. Among all, 3D analysis and other related issues (topological models, frameworks for representing spatial relationships, 3D visualisation) are mostly in the focus of investigations.
Topological model: The topological model is closely related to the representation of spatial
relationships, which are the basis of a large group of operations to be performed in GIS, e.g. inclusion, adjacency, equality, direction, intersection, connectivity, and their appropriate description and maintenance is inevitable. Several 3D models have already been reported in the literature. Each of the models has strong and weak points for representing spatial objects.
Carlson (1987) proposed a model called the simplicial complex. The simplex is the simplest representation of a cell. 0-simples is a point, 1-simples is the straight line between two points, 2-simplex is the triangle composed by three 1-2-simplexes and 3-simples is the tetrahedron composed by three 2-simplexes. He uses the simplexes to denote spatial objects of node, line, surface, and volume. The model can be extended to n-dimensions. Molenaar (1992) presents a 3D topological model called 3D Formal Vector Data Structure (3DFDS). The model maintains nodes, arcs, edges and faces that are used to describe four types of features named points, lines, surfaces and bodies. Compared to the simplex approach, 3DFDS has fewer restrictions on the objects, e.g. the 2-cell (face) can have arbitrary number of 1-cells. Furthermore, some spatial relationships are explicitly stored, i.e. face-body. The model belongs to the group of Boundary representations (B-reps). Cambray (1993) proposes CAD models for 3D objects combined with DTM as a way to create 3D GIS that is a combination of Constructive Solid Geometry (CSG) and B-rep. Pigot (1995) developed a 3D topological model based on 0,1,2, 3 cell, which maintains an explicit description of relationships between cells. Work by Pilouk (1996) focussed on the use of TIN data structure and relational database for 2D and 2.5D spatial data. He proposed an integrated data model for 3D GIS (i.e. TIN and 3D FDS), which produced a practical approach to the problem. Moreover, the author developed the Tetrahedron Network (TEN) data structure that is based on simplexes. The structure assures a strict consistency check, built on the generalised Euler’s Equality. De la Losa and Cervelle (1999) and Pfund (2001) propose object-oriented models similar to Molenaar’s one but they have included several more explicitly stored spatial relationships. For example, De la Losa maintains the relationship arc-faces and introduces a strict ordering of faces. Zlatanova (2000) discusses some aspects of the data structuring and 3D visualisation with respect to data query over the Web. The proposed data structure lacks the 1-cell in order to improve the performance of the system. Abdul-Rahman (2000) focuses on the object-oriented TIN (2D and 3D) based GIS. The conceptual and the logical model are developed based on Molenaar’s data model.
Consensus on a single 3D topological model is not achieved. A topological model appropriate for one application can be completely inapplicable for other application. Therefore Oosterom et al
(2002) propose maintenance of multiple topological models (in the database) as the rules and constraints of each model are explicitly represented in a metadata table. Functions have to provide consistent migration between the topological models as well as to the geometric model.
Formalism for detecting spatial relationships: OpenGIS consortium has adopted two frameworks
to detect spatial relationships known as Egenhofer operators and Clementini operators based on the 9-intersection model (see Egenhofer and Herring, 1992, Clementini and Felice, 1994). Although the topology is considered the most appropriate mechanism to describe spatial relationships, the study on other mathematical frameworks continues. Billen et al (2002) propose another framework (i.e. the Dimensional model) for representing spatial relationships, built up in affine space and convexity properties of the constructing elements (named dimensional elements). The Dimensional model allows larger variations in the grouping of spatial relationships compared to the 9-intersection model.
Data Presentation: Advances in the area of computer graphics have made visual media a major
Therefore, research related to the visualisation of real world 3D data is mostly “shifted” to the computer graphics society. Many viewers and browsers as stand-alone applications and plug-ins have been developed to quickly visualise and navigate through 3D models for a variety of applications. New algorithms and implementations are reported daily. The design criteria, however, are fast rendering techniques based on internal structures rather than utilisation of
database representations. TerraExplorer
(http://www.skylinesoft.com/corporate/corporate_home.asp), the current leader for visualising
large 3D textured data from the real world and the first software with acceptable performance, also requires re-structuring of data.
3D Web applications: The Web has already shown a great potential in improving accessibility to
2D spatial information (raster or vector maps) hosted in different computer systems over the Internet. 3D data were not even transferable over the Web until five years ago. The first attempt to disseminate and explore 3D data, i.e. VRML, appeared to be rather “heavy” for encoding real geo-data due to the lack of a successful compression concept. Despite the drawbacks, the language became a tool for research visualisation. Researchers could concentrate on data structuring and analysis and leave the rendering issues to browsers offered freely on Internet. The research on spatial query and 3D visualisation utilising VRML has resulted in a few prototype systems (Coors and Jung 1998, Lindenbeck and Ulmer 1998, Zlatanova 2000). GeoVRML (VRML extended with geo-nodes) and the new standard X3D (http://www.web3d.org/news/x3d/) are among promising opportunities for representing 3D data on the Web. A key goal of the X3D standard is definition of interoperable, light-weight components for 3D Web and broadcast applications beyond VRML 97.
5 Summary
In this paper we reported our observations and experience with current 3D GIS developments. The major 3D progress is observed in the area of data presentation. All traditional GIS vendors provide extended tools for 3D navigation, animation and exploration. However, many of these systems still are lacking full 3D geometry. OpenGIS specifications seem to have been adopted rapidly by DBMS, CAD, and GIS developers. In this order of thoughts, the understanding for GIS is changing. Instead of a monolith, desktop, individual system, GIS is becoming an integration of strong database management (ensuring data consistency and user control) and powerful editing and visualisation environments (inheriting advanced computer graphics achievements). At present, only the first step is made, i.e. the implementations focus mostly on the geometry. 2D topological representations and operations are intensively in the process of implementation. The third dimension with respect to topological issues is still in the hands of the researchers.
The case studies clearly showed the benefits of a standardised spatial data structuring as well as revealed the very early stage of the integration. The large number of specialised settings, the application dependent feature-geometry linkage, the limited semantic hierarchy, the spatial operators utilising only X, Y values, are some of the issues that need further improvement.
Although, there are quite a significant number of works devoted to 3D data structuring, the research is concentrated around a few basic ideas, as the level of explicitly described spatial relationships varies. Each suggested data structure exhibits efficiency and deficiency with respect to particular applications and operations to be performed. Still 3D GIS functionality needs to be addressed: 3D buffering, 3D shortest route, 3D inter-visibilities are some of the most appealing for research. Integration of object-oriented approaches with the 3D GIS raises research topics at a database level toward standard object descriptors and operations.
Acknowledgements
We express our sincere gratitude to Bentley Systems Europe, ITC, The Netherlands and The Graz University of Technology, Austria for their respective contribution to the case studies.
References
Abdul-Rahman, A., 2000. The design and implementation of two and three-dimensional triangular irregular network (TIN) based GIS. PhD thesis, University of Glasgow, UK. 250pp.
Billen, R., Zlatanova, S., Mathonet, P. and Boniver, F., 2002. The Dimensional model: a framework to distinguish spatial relationships. In: Richardson, D. and van Oosterom, P. (Eds.), Advances in Spatial Data Handling, Springer-Verlag, Berlin, pp.285-298.
Cambray, de B., 1993. Three-dimensional (3D) modelling in a geographical database.
Proceedings of Auto Carto 11, Bethesda, Maryland, pp.338-347.
Carlson, E., 1987. Three-dimensional conceptual modelling of subsurface structures. Technical
Papers of ASPRS/ACSM Annual Convention, Baltimore, Vol. 4 , pp.188-200.
Clementini, E. and Di Felice P., 1994. A comparison of methods for representing topological relationships. Information Sciences (80), pp.1-34.
Coors, V. and Jung, V., 1998. Using VRML as an Interface to the 3D Data Warehouse.
Proceedings of VRML'98, New York, pp.121-127.
de la Losa A. and Cervelle B., 1999. 3D topological modelling and visualisation for 3D GIS.
Computers and Graphics, 23 (4), pp. 469-478.
Egenhofer, M. J. and Herring, J. R., 1992. Categorising topological relations between regions,
lines and points in geographic databases. Technical report 94-1, NCGIA, Univ. of Maine.
ESRI, 1997. Using ArcView 3D Analyst. ESRIPublication, Redlands, California, USA, 118pp. Lindenbeck, C. and Ulmer, H., 1998. Geology meets virtual reality: VRML visualisation server
applications, In: Proceedings of WSCG'98, 3-19 February, Plzen, Czech, Vol. III, pp. 402-408. Limp, W.F., 2002. GIS raster packages, GeoEurope,
http://www.geoplace.com/ge/2000/0600/0600rs.asp.
Molenaar, M., 1992. A topology for 3D Vector Maps, ITC Journal, 1992-1, pp.25-33.
Oosterom, P. v, Stoter, J., Quak, W. and Zlatanova, S., 2002. The balance between geometry and topology. In: Richardson, D. and van Oosterom, P. (Eds.), Advances in Spatial Data
Handling, Springer-Verlag, Berlin, pp.209-224.
Pfund, M., 2001. Topologic data structure for a 3D GIS. Proceedings of 3rd International Workshopon Dynamic and Multi-dimensional GIS (Inter. Archives for Photogrammetry and
Remote Sensing, Vol.34, Part 2W2), 23-25 May, Bangkok, Thailand, pp.233-237.
Pigot, S., 1995. A topological model for a 3-dimensional Spatial Information System, PhD thesis, University of Tasmania, Australia.
Pilouk, M., 1996. Integrated modelling for 3D GIS. PhD thesis, ITC, The Netherlands, 200pp. Raper, J, and Maguire, D. J., 1992. Design models and functionality in GIS. Computer &
Geosciences, 18(4), pp.387-394
Sonnen, D. and Morris, H., 2000. Location in CRM: Linking virtual information to the real world, IDC White Paper, 12pp., http://www.idc.com
Stoter, J. and van Oosterom, P., 2002. Incorporating 3D geo-objects into a 2D geo-DBMS.
Proceedings of ASPRS/ACSM, 19-26 April, 2002, Washington, USA, CDROM, 12pp.
Tempfli, K., 1998. 3D topographic mapping for urban GIS. ITC Journal, 1998-3/4, pp. 181-190. Vermeij, M. and S. Zlatanova 2001. Semi-automatic 3D building reconstruction using Soft Plotter,
Proceedings of the International Symposium on “Geodetic, Photogrammetric and Satellite
technologies: development and integrated applications”, 8-9 November, Sofia, Bulgaria,
pp.305-314
Zlatanova, S., 2000. 3D GIS for urban development. PhD thesis, ITC, The Netherlands, 222pp. Zlatanova, S., Rahman, A.A. and Pilouk, M., 2002. 3D GIS: current status and perspectives.
Proceedings of the Joint Conference on Geo-spatial theory, Processing and Applications,