4,
A Worthy Note Issue in Fatigue Reliability Analysis and PSA: The Random Cyclic
Stress-Strain Responses of a NPP Material
Y. X. Zhao l), Q. Gao 2) and J. N. Wang 1)
1) Institute of Mechanical Engineering, Southwest Jiaotong University, Beiyuan 32-2-06#, Chengdu 610031, People's Republic of China
2) Institute of Applied Mechanics, Southwest Jiaotong University, Chengdu 610031, People's Republic of China ABSTRACT
Attention is paid to the random cyclic stress-strain (CSS) responses of a nuclear power plant (NPP) material, 1Crl8Ni9Ti stainless steel pipe-weld metal. Intrinsic cause of the responses and non-conservative evaluation without considering the responses are indicated, and a probability safety assessment (PSA) with the responses is made. The observations of short fatigue crack behavior indicate that the intrinsic cause is the difference of microstructural growth conditions in the initial zone and the zones ahead of the tips of dominant crack, which results in specimen failure. Existence of the responses implies that a random strain applied history will be introduced under any of loading modes even a deterministic loading history. Taking into account the responses, a reliability analysis indicates that conventionally deterministic CSS model is non-conservative. In addition, the responses yield irregularly distributed virtual stress amplitude data. The virtual stress amplitude-fatigue crack initiation life (S-N) data have thus a character of double random variables. The PSA should be different from that using the test data of commonly stress-controlled group and maximum likelihood fatigue tests. By the probability-based S-N curves suggested to model the S-N data, a PSA indicates that the ASME Code-based design curves are non-conservative in the lower virtual stress amplitude regime and most conservative in the higher virtual stress amplitude regime. Therefore, the responses should be considered in the fatigue reliability analysis and the PSA of engineering practice.
INTRODUCTION
Strain-based fatigue analysis should be more appropriate than conventionally stress-based analysis in the power generation industry. Due to the intrinsic scattering fatigue properties, probability and reliability methods should be specified. Several valuable efforts have been made by paying attention to the scatter of cyclic strain-life (CSL) data and treating cyclic stress,strain (CSS) relation as a deterministic model[I-4]. They might be appropriate for the materials where scatter of the CSS responses is small to be reasonably neglected in practice.
A significant scatter of CSS responses was recently revealed for a nuclear power plant material, 1Crl 8Ni9Ti stainless steel pipe-weld metal[5]. Existence of the responses implies that a random cyclic strain applied history will be introduced under any of the loading modes even a deterministic loading history. In addition, the responses yield virtual stress amplitude-fatigue crack initiation life (S-N) data having a character of double random variables. The probability safety assessment (PSA) on the design S-N curves should be thus different from that using the test data of stress-controlled group and maximum likelihood fatigue tests[6]. Therefore, the responses should be a worthy note issue in fatigue reliability analysis and PSA.
Present work pays attention to the responses. Attempt is to indicate intrinsic cause of the responses, non-conservative evaluation without considering the responses in fatigue reliability analysis and that of PSA on the material ASME Code-based design S-N curves with the responses.
EXPERIMENTS AND RESULTS
Material and Specimens
Smooth axial hourglass shaped weld metal specimens with 8 mm in diameter are used for this study. They were made from a welded pipe shown as in Fig. 1. This material was used for machining the cooling pipelines of nuclear reactors.
The joint was machined by manual welding with eight weld-metal overlays by a field welder. The first overlay was made by welding with backing gas of argon. The 2-8 overlays were made by arc welding. Inter-pass temperature was controlled in the range of 0-60 degree C. Local dimensions of the joint and the welding parameters were specified by the Chinese code-GB. From practice the specimens were not heat-treated to eliminate the welding residual stresses. Before testing, the specimens were polished to a mirror finish with surface finish of 3-5 ~m.
Details on the welding parameters, Chemical composition of the base metal and the electrodes for the first overlay and 2-8 overlays, and mechanical properties of the base metal and joint at room temperature please refer to the previous work[7].
SMiRT 16, Washington DC, August 2001 Paper # 1034
... . . .
Fig. 1 Schematic Diagrams of the Welded Pipe and the Specimen (Dimensions in mm)
Strain-controlled Fatigue Tests
A group fatigue test with six total strain levels was used. The six total strain amplitudes are 0.0065, 0.0050, 0.0043, 0.0034, 0.0028, and 0.0023, respectively. Seven specimens were tested at each strain level. All specimens were fatigued on MTS 809 servo-hydraulic machine under symmetrical push-pull triangular wave mode. A constant strain rate of 4x 10 .4 s "~ was employed. Test temperature was kept around 240 degree C.
To reveal the material microstructure-related fatigue damages, the interacting and involving surface short crack behaviour of nineteen specimens were observed using replica technique[5, 8-9]. Fatigue tests were carried out under the same six total strain amplitudes. Due to the restriction of replica technique, the tests were made at room temperature.
Test Results and Discussions
CSS and CSL data should be given subsequently in Figs. 4-5. Fig. 2 shows variations of the stress amplitudes with fatigue cycling of a typical group of specimens. A cyclic sot~ening follows closely a slightly initial hardening. Then, a steady process is gradually constructed after the life fraction over about 0.3. Finally, the specimens are failure with a generally rapid decrease of the amplitudes when the life fraction is over about 0.8. The behavior shows a good consistency with the Miller--de los Rios's subdividing of fatigue damage three stages, i.e., microstructural short crack (MSC), physical short crack (PSC) and long crack (LC) stages, in study of short fatigue crack behavior[10]. At the same time, a significant difference of the amplitudes between the specimens is observed.
450 450
(a)
~ ' 4 0 0 ~ ' 4 0 0
~ r,~
~250;
~250
2001 ~ 200
101 102 103 104 l0 s 0
Number of fatigue cycles
(b)
- MSC l PSC LC
! '
; , . , . , , , , I ,
0.2 0.4 0.6 0.8 I
Fatigue life fraction, NIN!
Fig. 2 Variations of the Cyclic Stress Amplitudes with Increasing of (a) the Fatigue Life in Log-scale and (b) the Life Fraction for a Typical Group of Specimens Fatigued at Total Strain Amplitude Of 0.0043
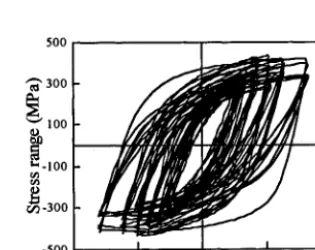
Saturation hysteresis loops of the specimens are shown in Fig. 3. The difference of loops indicates that different stress, elastic- and plastic-strain amplitudes will be obtained even at a same strain load. The random CSS responses are then yielded. Reliability analysis for this case should be different from that by the conventionally deterministic CSS model[I-4].
In addition, the different stress, elastic- and plastic-strain amplitudes will yield different virtual stress amplitudes from equation of
S=6a.E =sa.o'fl6e
even at a same strain load. The virtual stress amplitude-fatigue crack initiation life (S-N) data, as shown subsequently as in Fig. 7, have thus a character of double random variables. The PSA on the ASME Code-based design S-N curves should be different from that using the test data from commonly stress-controlled group and maximum likelihood tests[6].5 0 0
300
100
-100 r/] oq
r~-300
-500
-0.008 -0.004 0 0.004 0.008
Total strain range
CAUSE OF THE RANDOM CSS RESPONSES
To facilitate an understanding of the material fatigue damage mechanism and the evolution and interaction of short crack behaviour, an 'effective short fatigue crack criterion' was introduced[5, 8]. Core of the criterion, as shown as in the Fig. 1 of Ref. 8, consists of three new concepts to distinguish the different contributions to fatigue damage of short cracks having different sizes and locations on the specimen surface:
(1) Effectively short fatigue cracks (ESFCs). An ESFC is defined as an observed crack that lies in the growth path of the dominant crack which results in specimen failure.
(2) Dominant effectively short fatigue crack (DESFC). A DESFC is defined as, in the MSC stage, the virtual crack having a size which is equal to the average value of the sizes of the ESFCs in the initial zone of the dominant crack. In the PSC stage, it is defined as the longest crack of the ESFCs.
(3) Density of ESFCs. The density of ESFCs in the MSC stage is defined as the average number of per unit area of the short cracks in the initial zone of dominant crack. In the PSC stage, it is defined as the average number of per unit area of the short cracks in the zones ahead of the DESFC tips. The cracks in these zones might affect the DESFC behaviour.
The replica observations have revealed that[8-9]"
(1) Around 80 percent of the fatigue life are due to interaction and evolution of the short fatigue cracks. The process exhibits a typical character of MSC and PSC stages. Transition point between the MSC and PSC stages is at about fatigue life fraction of 0.3. Correspondingly, double DESFC length of the point is about 40 micron, consistency with the distance between neighboring rich delta ferrite bounds of the material characterized microstructure.
(2) The DESFC growth is due to interactive short cracks in the initial zone and the zones ahead of DESFC tips and, thus, is deemed suitable to describe the collective behavior of short cracks.
(3) There is a significant difference between the local microstructural growth conditions in the initial zone and the zones ahead of the DESFC tips. The conditions include orientations, geometry shapes and percentages of the delta ferrite inlaid in the material matrix and micro-hardness values and mechanical properties of the material compositions. This difference involves with increasing of the DESFC size and should be reflected by a density of ESFCs of the zones.
(4) A similarly statistical evolutionary behavior between the density data and DESFC growth rates is observed under a same strain load. It indicates that the difference of the local microstructural growth conditions is the intrinsic cause of the random DESFC growth rates. The random growth rates result naturally in a scatter of fatigue lives. In addition, the random growth rates exhibit different material fatigue resists to a same strain load. Therefore, this difference is the intrinsic cause of the material random CSS responses and random CSL relations.
FATIGUE RELIABILITY ANALYSIS
Modeling of the Random CSS Responses
Considering the dependency of material constants in the Ramberg-Osgood CSS relation, a statistical model was proposed to the responses[11]. The model is given by probability-based CSS curves. Under the stress amplitudes following normal distribution, the curves are approximated by the mean value and standard deviation curves:
1
E. CGJ
(1)
1
1;:
e.
=-~Z + ~,-~)
(2)
where subscripts g and o denote mean value and standard deviation of the parameters. Confidence bounds of the modeling can be approximately evaluated by[12]:
I
O'aU (O'aU /~-~
"
+ t-kT )
(3)
1
(4)
where subscripts U and L denote upper and lower confidence bounds of the parameters.
shown in Fig. 4. It can be seen that the scatter of test data has been well modeled.
Table 1. Parameters of the probability-based CSS curves and the confidence bounds at a significance level of 0.05
Mean value curve standard deviatio n curve Uppe r I~0und Lower'bound
E 7 2 4 9 340 Eo=61 470 Eu=319576 Er=202325
K~=571.66 K~=112.34 K~=706.35 K[=452.66
n ~=0.08357 ! n ~,=0. ! 95832 n ~=0.083571. n ~=0.083571
500
~'400 g~
~200
I00
Mean curve °
O O
I i P=0.9
/'-~'~ O Test data
(a)
0 ~
0 0.002 0.004 0.006 0.008 0.01 0 Total strain amplitude, sa
500
~400 0
~300
, - - o , . . .
0.002 0.004 0.006 0.008 0.01 Total strain amplitude, r~
Fig. 4 Fitted Effects of (a) the Probability-Based CSS Curves and (b) the Confidence Bounds at a Significance Level of 0.05 (P-Survival Probability)
Modeling of the Random CSL Relations
Based on the Coffin-Manson law and considering the dependency of material constants in the law, probability-based CSL
curves were introduced to model the random CSL relations[13]. For the logarithm of fatigue life (lgN) following the normal distribution, the random relations are approximated by the mean value and standard deviation curves of the lgN as
~a = ' ~
(5)
°Ca ---- W + °ef°
where L~ -- 100~), , L~ = 100g~l' . Confidence bounds of the modeling can be approximately evaluated by[13]:
(6)
a N / ,
e.
(7)where L u*= 10 (l~v)~ , LL=I* 0 0w)~ •
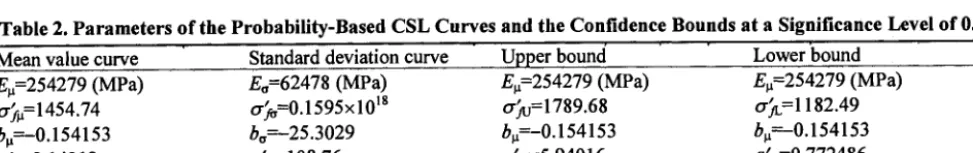
Parameters of the curves and confidence bounds to the material test results are given in Table 2. Fitted effects are shown in Fig. 5. The scatter of test data has been well characterized.
Table 2. Parameters of the Probability-Based CSL Curves and the Confidence Bounds at a Significance Level of 0.05
Mean value curve " Standard deviation curve " Upper bound ' ' Lower bound
Et,=254279 (MPa) Eo=62478 (MPa) Ep254279 (MPa) Ep254279 (MPa)
tr~ = 1454.74 cr~=0.1595x 10 TM cr~u= 1789.68 oraL= 1182.49
bg--O. 154153 bo=-'25.3029 bg--O. 154153 bg--O. 154153
6~=2.14212 8 ~ = 108.76 s)u=5.94016 6~=0.772486
c~=-0.731555 co=-77.9599 c~=-0.731555 C~=-0.731555
Fatigue Reliability Analysis
0.008
rO.O06
.,~
~'0.004
1
"t0.002
F-,
i
P=0.9
P=0.99
oTest data
0 i | ,t i t | H I t | i t t t t l l i | i t | l t l
103 10 3 10 4 IO s
Crack initiation life, N (cycles)
0.008
~
0.0060.004
~0.002
0 102
(b)
0 0 41) Mean curve
bound
oTest data
I I 1 1 1 1 1 1 1 I I l i l I I M I I l l l l l l l I I | l l l l i
103 10 4 lO s 10 6
Crack initiation life, N (cycles)
Fig. 5 Fitted Effects of (a) the Probability-Based C S L Curves and (b) the Confidence Bounds at a Significance Level of 0.05 (P-Survival Probability)
should be given by the CSL relations. Therefore, a reliability assessment method can be constructed by considering the interference of the cyclic strain applied and capacity histories[14]:
where ft(6~ o'~) and fs(6,] L) are probability density functions for the cyclic strain applied and capacity histories, respectively. Note that L represents lgN. The functions f~6~ o'o) andfs(6J L) can be analytically obtained from the former probability-based CSS and CSL curves, respectively[14]:
(11)
where script' denotes first differential, o'o~(6a) and crao(~o) should be evaluated from the probability-based stress-strain curves, L,(8o) and Lo(6,) can be evaluated from the probability-based strain-life curves with L~(8o) = lgL~ and Lo(8o) = lgL~. Note that the probability density functions are not normal models.
When the material CSS response is considered as a deterministic model as the existent methods did[I-4], the reliability assessment can be conveniently carried out using following equation:
R=~+sf fs(6alL):/6,,
(12)where ~a is evaluated by a deterministic CSS relation.
Fig. 6 shows the numerically reliability-stress-life (R-S-N) curves of the present material under both cases of the random CSS responses and deterministic CSS model. Non-conservative evaluation of the deterministic model has been indicated.
I
0.9
~
0.8~
0.70.6
0.9
" \
. /~-11000 \ "
-- l~nd°m csS reP°nses \
- l~term~ktic CSS response \
(,)
, I I I,,,
200 250 300 350
Stress amplitude (MPa)
~ 0 . 8
~ 0 . 7
0.6
0.5 0.5
150 103
i i , . . , . . . . ° " ° . ,,
er,=210 ~
- Random CSS response= -. Determinktie CSS response
(b)
| t t t t l t t l t t t t t t t t l t t i t t i t !
lO 4 IO s 1o ~
Fatigue life (cycles)
PSA ON THE M A T E R I A L DESIGN S-N CURVES
ASME Code design S-N curves are based on strain-controlled fatigue tests of small polished specimens in air at room temperature. The curves were obtained by decreasing best-fit curves to experimental data by a factor of 2 on stress or 20 on cycles[ 15]. These curves are commonly recognized more conservative in engineering practice.
For partial penetration welds the ASME Code requires at least the factor of 4 on stress. But in the low cycle fatigue (LCF) regime (N<106), the cyclic plasticity tends to reduce the stress concentrating effects of weld defects and to relieve the weld residual stress[16]. The factor of 4 on stress is only applied for the design curves in the high cycle fatigue regime (N> 106). While in the LCF regime the factor of 2 on stress is remained.
Present test data are in the LCF regime. The S-N data exhibit a character of double random variables. The PSA on the material design S-N curves should be thus different from that using the test data of commonly stress-controlled group and maximum likelihood fatigue tests[6]. To model statistically the S-N data, probability-based S-N curves were introduced [5]. Assuming that the fatigue crack initiation lives follow lognormal distribution, the curves were suggested as the following mean- and standard deviation- S-N curves of logarithm of fatigue life:
S", N~ : C,, (13)
S"oN: =C o (14)
where N~ = 100gN), N: = 10 (IgN~' m and C are material constants. Confidence bounds at a significance level were
approximated by the following upper and lower confidence curves:
S""N U =C U (15)
S mj' N L = C L (I 6 )
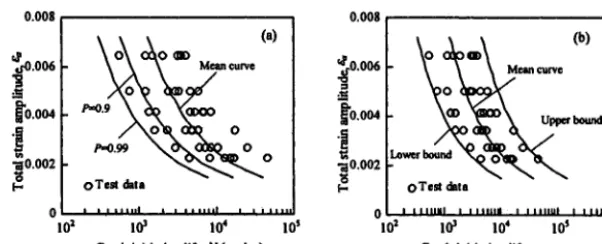
Different the existent approach[6], parameters of the above curves were evaluated by a least square method to the overall test data. For the present material, evaluated parameters are given in Table 3. Fit effects are shown in Fig. 7. It can be known that the scatter of the test data has been well described.
Table 3. Parameters of the Probability-Based S-N Curves and the Confidence Curves at a Significance Level of 0.05
,
Mean value curve , Standard . deviatio n curve Upper confidence curve Lower Confidence curve
m~=2.31965 m~=0.423564 m~=2.31965 m~,=2.31965 •
C,=3.35883x10 ~° C,,=29.6578 Cu=9.72587x10 ~° CL=1.15997×10 ~°
2500 2500
~
2ooo.~ 1500
g 5~
o,
11
/ \ ~ P--0.99 o Test data
~ ~ ~ /~-0.9
/ ' ~ . 9 9 9 9 ~ ~ ~ ~ ~ ~ ~.
I ' ' ' | * i t . i , t , , , , , , , t , , , , , j , ,
IO s 104. iO s
Cycles to fatigue crack initiation, N
~
20oo.~ 1500 ~1000
500
o Test data
~ o~k ~Upper confidence bound
Mean curve
-
Lower eontidenee " ~
bound o
. , * * * * , * * | I * , * , i t * * * * , * , 1 , *
1o 3 1o' 1o s
Cycles to crack initiation, N
Fig. 7 Probability-Based S-N Curves and Confidence Bound Curves at a Significance Level of 0.05 (P-Survival Probability)
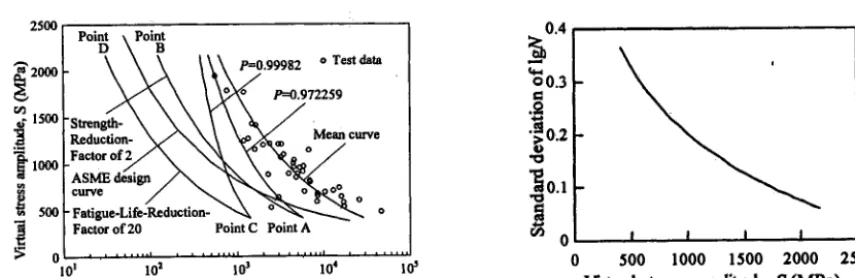
Fig. 8 shows the curves of reduction factors of 2 on the stress amplitude and 20 on the fatigue life to the material best-fit curve. It is known that:
While at the point B with (S, N) value of (2166.28 MPa, 123 cycles), the survival probability is up to about 0.9...9 (The number of nine is thirty). This indicates that in the higher virtual stress amplitude (HVSA) regime the fatigue analysis is most conservative.
(3) For the evaluation of reduction factors of 20 on cycles, the survival probability at the point C with (S, N) value of (411.87 MPa, 1445 cycles) is 0.99982. This value may be appropriate for the common practice. But at the point D with (S, N) value of (2166.28 MPa, 31 cycles), the survival probability is up to about 0.9...9 (The number of nine is fifty). It indicates that in the HVSA regime the fatigue analysis is most conservative.
(4) For the regime of ASME Code design curve of the stress amplitude lower than about 600 MPa, the equivalent survival probability is lower than 0.972259. Between the stress amplitudes of 600-850 MPa the probabilities are in the range of 0.972259-0.99982. This probability increases with the stress amplitude increasing up to more than 0.9...9 (The number of nine is thirty) in the HVSA regime. This indicates than the ASME design curve tends to be non-conservative as the stress amplitude lower than 850 MPa. In constrast, the curve tends to most conservative as the stress amplitude great than 850 MPa.
The cause of non-conservative in LVSA regime and most conservative in HVSA regime may be that these curves with constant reduction factors can not reflect the material intrinsic property of increasing standard deviation of the logarithm of fatigue life, as shown as in Fig. 9, with the stress amplitude decreasing. Therefore, design curve should be appropriately determined by a probability or a reliability method.
2500
~
2000~
1500- ,ooo
Point \Point
D \ ~ ~ ~ ( ~ / ~ B P=0.99982 * Test data
~
'~~.972259S~ren
Reduction. , ~ / N N ~ ~ t ~ N ® Meancurve Factor o f y ~ N~
-ASME design
curve /
Fatigue-Life-Reduction- o
Factor of 20 Point C Point A
0 1 - - ' 0 t " . . . 102 . . . 103 . .. . . 104 l0 s Cycles to fatigue crack initiation, N
Fig. 8 Curves of the Reduction Factors of 2 on Stress and
20 on Cycles (P-Survival Probability)
0.4
00.3
"~ 0.2
"~0.1
o I I I I
500 1000 1500 2000 2500
V'~ual stress amplitude, $ (MPa)
Fig. 9 Standard Deviation Curve of the Logarithm of Fatigue Life of the Present Material
CONCLUSIONS
Based on the short crack behavior observations, reliability analysis and PSA to the test results of 1Crl 8Ni9Ti stainless steel pipe-weld metal, following conclusions can be give:
(1) Random CSS responses are observed for 1Crl 8Ni9Ti stainless steel pipe-weld metal. The intrinsic cause is the difference of microstructural growth conditions in the initial zone and the zones ahead of the tips of dominant crack, which results in specimen failure, in the fatigue damage process.
(2) Existence of the random responses implies that a random strain applied history will be introduced under any of loading modes even a deterministic loading history. The reliability analysis indicates that the conventionally deterministic CSS model will give a non-conservative evaluation.
(3) The random responses will yield S-N data with double random variables. PSA on the material design S-N curves should be different from that using the test data of commonly stress-controlled group and maximum likelihood fatigue tests. To model statistically the S-N data probability-based S-N curves are introduced. Results of the PSA indicate that the ASME Code-based design S-N curves are non-conservative in the LVSA regime and more conservative in the HVSA regime.
N O M E N C L A T U R E
b C
C
E K '
m
= fatigue strength exponent = material constant = fatigue plastic exponent = Young's modulus
N
/,/t
P R S Za, 6e, 8p cra
L U ~t
= cycles to fatigue crack initiation = cyclic hardening exponent = survival probability = reliability
= virtual stress amplitude
= cyclic total strain, elastic and plastic amplitudes = fatigue plastic coefficient
= cyclic stress amplitude = fatigue strength coefficient = lower confidence bound = upper confidence bound = mean value
= standard deviation
ACKNOWLEDGMENT
The work is supported by the National Science Foundation of China (50075073), the Provincial Youth Science and Technology Foundation of Sichuan, PRC, and the Opening Foundation of the Key Provincial Laboratory of Strength and Vibration of Sichuan, PRC. Gratitude is to Assistant professor L. X. Cai and engineers Y. F. Sun, H. Y. He and Y. Z. Huang of the Laboratory for their efforts to perform the fatigue tests.
REFERENCES
1. Wirsching, P.H., Tomg, T.Y. and Martin, W.S., "Advanced fatigue reliability analysis," Int. J. Fatigue, Vol. 13, 1991, pp. 389-394.
2. Bargmann, H., Rustenberg, I. and Devlukia, J., "Reliability of metal components in fatigue: a simple algorithm for the exact solution," Fatigue Fract. Eng. Mater. Struct., Vol. 17, 1994, pp. 1445-1457.
3, Baldwin, J.D.and Thacker, J.G., "A strain-based fatigue reliability analysis method," J.'~4ech. Des. ASME, Vol. 117, 1995, pp. 229-234.
4. Zhao, J., Tang, J. and Wu, H.C., "A reliability assessment method in strain-based fatigue life analysis," J. Pres. Ves. Tech. ASME, Vol. 120, 1998, pp. 99-104.
5. Zhao, Y.X., "Short Crack Behaviour and Reliability Analysis in Low Cycle Fatigue," Ph.D. Thesis, Southwest Jiaotong University, Chengdu, People's R. China, September 1998, in Chinese.
6. Ling, J. and Pan, J., "A maximum likelihood method for estimating P-S-N curves," Int. J. Fatigue, Vol. 19, 1997, pp. 415-419.
7. Zhao, Y.X., Wang, J.N. and Gao Q., "Random cyclic stress-strain responses of a stainless steel-pipe weld metal I m a statistical investigation," Nucl. Eng. Des., Vol. 199, 2000, pp. 303-314.
8. Zhao, Y.X., Gao, Q. and Wang, J.N., "Interaction and evolution of short fatigue cracks," Fatigue Fract. Eng. Mater. Struct., Vol. 22, 1999, pp. 459-467.
9. Zhao, Y.X., Gao, Q. and Wang, J.N., "Microstructural effects on the short crack behaviour of a stainless steel-weld metal during low cycle fatigue," Fatigue Fract. Eng. Mater. Struct., Vol. 22, 1999, pp. 469-480.
10. Miller, K.J. and de los Rios, E.R., "The Behaviour of Short Fatigue Cracks," EGF (ESIS) Publication No. 1, MEP, Institution of Mechanical Engineers, London, 1986.
11. Zhao, Y.X., Gao, Q. and Wang, J.N., "Random cyclic stress-strain responses of a stainless steel-pipe weld metal I I - - a modeling," Nucl. Eng. Des., Vol. 199, 2000, pp. 315-326.
12. Zhao, Y.X., "Strain-Based Fatigue Reliability Analysis Methodology for Power Plant," Postdoctoral Research Report, Southwest Jiaotong University, Chengdu, March 2000, in Chinese.
13. Zhao, Y.X., Wang, J.N. and Gao Q., "Statistical model for the random cyclic strain-life relations of 1Crl8Ni9Ti pipe-weld metal under temperature of 240°C, '' Nucl. Eng. Des., Vol. 205, 2001, pp. 243-251.
14. Zhao, Y.X., "A methodology for strain-based fatigue reliability analysis," Reliab. Eng. Sys. Saf., Vol. 70, 2000, pp. 205-213.
15. ASME Boiler and Pressure Vessel Code Section III, 1992.
16. Jaske, C.E., "Fatigue -strength-reduction factors for welds in pressure vessels and piping," J. Pres. Ves. Tech. ASME, Vol.