On the effect of moving blade grid on the flow field
characteristics
PavelProcházka1,*, Václav Uruba1, LuděkPešek1 and Vítězslav Bula1 1Institute of Thermomechanics, Czech Academy of Sciences, Czech Republic
Abstract. The motivation of this paper is the continual development of the blades for the last stage of the steam turbine. The biggest problem is the slenderness of such blades and the extreme sensitivity to aeroelastic vibrations (flutter) caused by the instabilities present in the flow. This experimental research is dealing with the aeroelastic binding of the moving blades located in the blade grid with the flow field and vice versa. A parallelogram is used to ensure one order of freedom of the blade. The grid has five blades in total, three of them are driven by force control using three shakers. The deviation as well as force response is measured by strain gauges and dynamometers. The flow field statistical as well as dynamical characteristics are measured by optical method Particle Image Velocimetry. The grid is connected to the blow-down wind tunnel with velocity range up to 40 m/s. The aeroelastic binding is investigated in dependency on used actuation frequency and maximal amplitude (the intensity of force actuation) and on different Reynolds numbers. The flow field and the wake behind each individual blade are studied and the maximal interaction is examined for individual inter-blade phase angle of the grid.
1 Introduction
This work was established as a responce to a necessary need to further improve the efficiency of the steam energy conversion in the last stages of the steam turbine. The blade-tip region, whose airfoils have very sharp leading edge and low camber, is high-loaded by low supersonic relative velocities and flutter phenomenon or even high cycle fatigue damage are present. The experimental or numerical investigation of the flutter in low pressure turbine (LPT) blades is then in the center of interest for many research groups which have been still dealing with turbomachinery blade dynamic stability. The aeroelastic binding is very often studied by employing of self-excited blades in the cascade.
This research is related to modern turbofan engines [1] as well as to steam turbines. The numerical studies are validated by experimental investigation where the aerodynamical forces and momentum [2] and unsteady pressures [3] are measured, or the velocity components are determined directly. Nowinski’s work [3] is based on unsteady pressure measurement made along the test section outer wall with the goal to eliminate flutter in LPT blades. This was conducted in annular cascade. The investigation of planar blade cascade is more common case. Tsymbalyuk et al. [2] has investigated the blade dynamic stability. His experiment is based on self-excited vibrations of the airfoil cascade using the airfoil suspension system which has two degrees of freedom – the displacement and the rotation. The measurement of flutter conducted in high subsonic aerodynamic tunnel as well as PIV measurement of single vibrating wing is
described in [4]. Results of ref. [4] revealed that the flow is mainly affected by the changing wing angle and the effect of displacement is rather small.
This experimental work is closely linked to the project dealing with aeroelastic couplings and dynamic behaviour of rotational periodic bodies [5, 6]. Vimmr et al. [5] carried out a numerical study which uses a simplified model of blade cascade (3 airfoils) which perform harmonic motion and with individual inter-blade phase angle. This angle is chosen in order to set a travelling wave mode of vibration which is present in the rotational solid bodies. The aim of this study is to determine the aerodynamic damping coefficients caused by the aerodynamic forces acting on the flat plates. Půst et al. [6] has described analytically the dynamic properties of the five-blade-cascade excited by the running harmonic external forces and aerodynamic self-excited forces were investigated.
2 Experimental setup
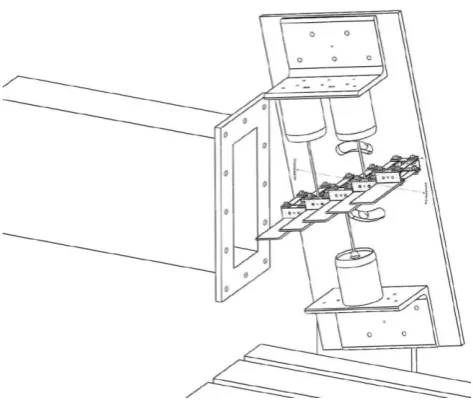
The blade cascade was designed and fabricated in a geometrical arrangement as it can be seen from figures 1 and 2. The blade profile is simple flat plate with semi-cylindrical leading and trailing edges. The chord length is 52.8 mm and each blade takes the angle of attack of about 11.4°. The distance of two adjacent blades in perpendicular sense to the chord is 16 mm. Each blade is attached using parallelogram (two beams linked by the four spring-steel belts) to the supporting sidewall. This mechanism enables to each blade only the displacement in the perpendicular direction. No torsion and tilting are available. The profile length is finite, it was designed to spread across the wind tunnel outlet nozzle and its value is 80 mm. The leading and the trailing blades are auxiliary. The second, third and fourth blades (blade A, B, C) were self-excitated by LDS electrodynamic exciters. The exciter was linked with the blade by a rod. To measure inertial, elastic and aerodynamical forces, a force transducer was placed at the end of this rod. The movement of the blades is measured by the foil strain-gauges. The blade excitation is established independently of others and it is given by prescribed amplitude, frequency and phase angle. The harmonic
movement of blade C and blade A were phase shifted Δϕ
and – Δϕ to middle blade. Five distinct regimes of the excitation were tested. The parameters are available in table 1.
Fig. 1. Blade cascade, plane of symmetry.
Table 1. Tested regimes. Regime
number Frequency (Hz) Force (N) Peak-to-peak ampl. (mm)
I. 20 15 2.233
II. 20 19 2.946
III. 30 13.5 2.729
IV. 40 5 1.884
V. 40 7.5 2.828
Fig. 2. Experiment arrangement.
The blade cascade was connected to the outlet nozzle of the blow-down wind tunnel with cross section dimensions of 100x250mm. The leading edge of the first blade was 20 mm from the outlet nozzle. The aeroelastic behaviour was studied also in dependency on various Reynolds numbers which was achieved by different outlet velocity (10, 20, 30 and 40 m/s). The turbulence intensity level is about 0.1% measured at distance of 0.26 m from the nozzle [7]. The outcoming flow is perfect steady in time and the flow enters the blades at the angle -11.4° (the suction side is below one). The preferred velocity was 40 m/s and the main task was to study the effect of the changing inter-blade phase angle. This angle corresponds to different travelling wave mode and the strongest interaction between two adjacent profiles is searched. The phase angle equal to zero corresponds to the situation when all three blades are performing the harmonic motion synchronously. The
phase angle equal to π describes the state when the blade
A and C make the motion synchronously and the blade B goes in opposite sense. The PIV measurements were conducted for following values of phase angle ϕ=0, π/4, π/2, 3π/4, π, -3π/4, - π/2, - π/4.
Interrogation area of 16x16 pixels results in 159x99 vectors (maximal 5% invalid vectors). Further data analysis and plotting is performed in Matlab or in Tecplot software.
Since the flow field in the vicinity of this cascade with moving profiles has pseudo-periodical nature, it is very convenient to sample the data not only for statistical and dynamical properties calculation but it is also desirable to do phase-locked measurement. The flow is acquired with the frequency of 100 Hz during at least ten seconds to be able to calculate mean flow field and all higher statistical moments. As it will be apparent later in the following chapter, these results will not be so helpful in aeroelastic binding description. The main focus of this article is devoted to the dynamical analysis. The acquisition frequency should be as high as possible. For flutter phenomenon investigation, the data were acquired with the frequency of 2 kHz during two seconds. The phase-locked measurement is very convenient to suppress the random (turbulent) component of the flow and to highlight the periodical component which is given by harmonic periodic motion of the blades. Eight phases per period (which was given by the excitation frequency) were acquired during several seconds (there is limitation due to camera memory). The dataset of each phase is averaged over all measured periods and consequently the standard deviation (STD) is calculated for each phase averaging.
3
Results
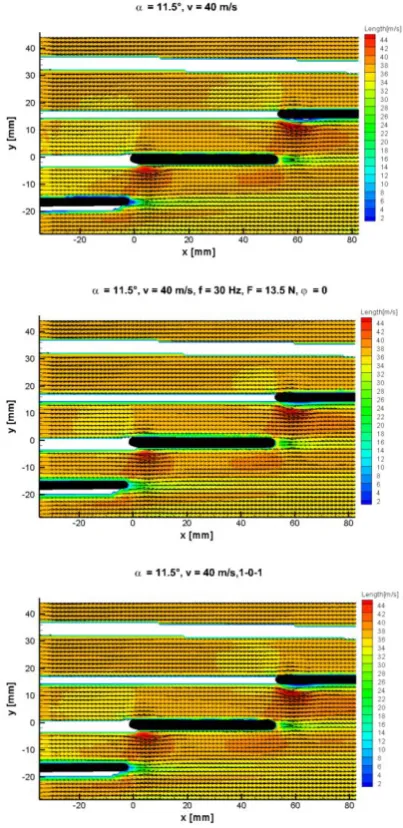
Although the blade cascade was tested during four different tunnel outlet velocities, the main focus is set to 40 m/s in this article. The low-speed incoming flow is considered as incompressible. Base case (the regime without self-excitation) was investigated in detail using PIV as well as several regimes for different excitation parameters given table 1 and different inter-blade phase angles. In additional, several regimes were tested when only one or two blades were performing harmonic motion. The topology of the mean flow field can be clearly seen from figure 3. Black vectors represent the velocity vector orientation and the scalar value is plotted as vector module. The origin of the coordinate system is placed in the leading edge of the third profile (blade B). The first part is plotted for base case, second one depicts one of the regimes from table 1. The middle profile is not excited in the third part. Although all flow fields were taken during very different conditions, the resulting flow topology is exactly the same. There is a massive flow separation at the first blade (which is not present at these pictures) and the flow is deflected toward the other blades 2, 3, 4 and 5. The angle of attack is significantly reduced for other blades in cascade. There is clear separation at the suction side of each blade right behind the leading edge. The flow is re-attached at approximately 20% of the chord length again. The flow is accelerated in this region about 10-20% compared with the incoming flow velocity. The blade wake is slender and it contains a sequence of vortices separated periodically from the blade surface at relative high
frequency. Note that flow field is incomplete in front of the cascade as the laser illumination was located from the back side. Gentle increase of the velocity in the inter-blade channel is caused by the inter-blade thickness and of by course the existence of boundary layers. The figure 4 is plotted for velocity variances (a sum of variances of both components). There is also no visible effect if we compare different regimes (the comparison is made here for regime I and several phase angles).
Fig. 4a, b, c, d. Velocity variances. Comparison of four distinct phase angles ϕ=0, π/2, π, - π/2.
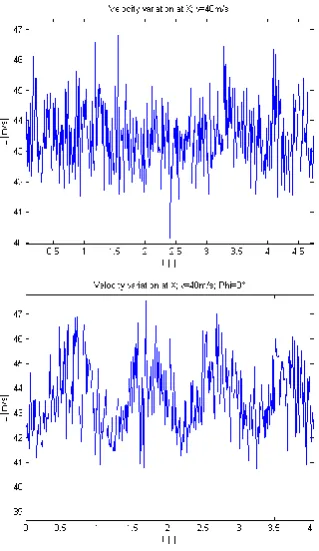
The analysis of statistical quantities has not brought any clarification. There is a need to study the time-dependent flow quantities and especially frequencies of the velocity fluctuation. Figure 5 is plotted for time-dependent record of the velocity magnitude at distinct place far from the blade surface for base case (5a) and for regime I (5b). The records are plotted for four periods (given by excitation frequency). The excitation caused clear periodical changes of the velocity whose frequency is related to the excitation frequency. Turbulent noise has been superimposed on both waveforms.
Fig. 5a, b. Velocity variation during 4 periods at point X. Base case versus regime I.
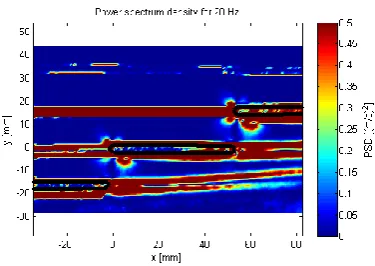
Fast Fourier transform (FFT) has been computed in each point of the flow domain. Power spectral density (PSD) of related frequency (excitation frequency) was consequently plotted as a scalar value in the flow domain. The areas of maximal intensity correspond with the position of maximal aeroelastic binding between the flow and blade cascade. These positions can be seen in figure 6 where the diagram is divided for u and v velocity component and the effect of Reynolds number is also visible. The stronger binding is present for velocity of 40 m/s and u velocity component. The most interesting spots are present in the vicinity of the leading edges and also in the wakes. A shadow in front of blades is caused due to missing data. At upper and lower side from the leading edge, there are two spot of augmented activity and there is also remarkable formation at the location of the separation bubble. This formation is very close to the wake of the preceding blade and the binding would increase rapidly if these two areas crossed. Nevertheless, all of these structures relate to motion of the blades as there are no such structures at all for the base case. Figure 7 shows the dependency on phase
angle. This angle varies to 0, π/2, π and – π/2. The binding is the weakest paradoxically for the angle π
Fig. 6a. PSD scalar map for 20Hz, 20m/s for u-component.
Fig. 6b. PSD scalar map for 20Hz, 20m/s for v-component.
Fig. 6c. PSD scalar map for 20Hz, 40m/s for u-component.
Fig. 6d. PSD scalar map for 20Hz, 40m/s for v-component.
Fig. 7a. PSD scalar map for 20Hz, phase angle ϕ=0.
Fig. 7b. PSD scalar map for 20Hz, phase angle ϕ=π/2.
Fig. 7c. PSD scalar map for 20Hz, phase angle ϕ=π.
Fig. 8a, b, c.Phase angle ϕ=0, regimes I, III and V.
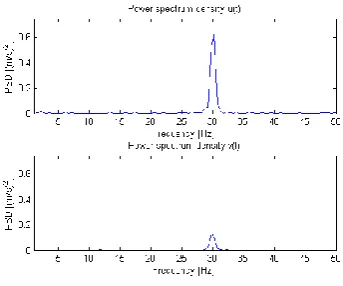
Detailed analysis of spectral density was performed in specific points (figure 9). The emphasis was given to points 2, 3 and X. X-point was calculated from all experimental data as an average coordinate of the maximal intensity locations. There is power spectral density for frequencies up to 50 Hz in figure 10– the calculation is performed separately for u and v velocity component (as previously). Maximal peak value of PSD was identified for vertical velocity component at points 2 and 3. However, the situation at the point X is completely different. There is a huge peak value for horizontal component and its value is two orders bigger compared to previous points. Also peak value of vertical component is orderly higher. The aeroelastic binding is also the strongest at point X. Next comparison was evaluated for the spectral density at point X for different phase angles. This influence corresponds to figure 7. The
biggest peak value occurs for the angle equal to zero and on the contrary the binding is rather weak for angle π. The regimes generated at π/2 and – π/2 are similar. The peak value of PSD was analyzed also in dependency on excitation regime. Figure 11 shows spectral density for angle ϕ= π for regimes I, II, III and V. The maximal peak value occurs for the second regime. This is given due to the fact that this regime disposes of maximal deviation amplitude. The regime V as the only one has the significant peak value also for vertical velocity component making it the most binding regime.
Fig. 9. Location of points under investigation.
Fig. 10a. Phase angle ϕ=π. Frequency spectrum at point 2 for regime I.
Fig. 10c.Phase angle ϕ=π. Frequency spectrum at point X for regime I.
Fig. 11a.ϕ=π. Freq. spectrum at point X for regime I.
Fig. 11b.ϕ=π. Freq. spectrum at point X for regime II.
Fig. 11c.ϕ=π. Freq. spectrum at point X for regime III.
Fig. 11d.ϕ=π. Freq. spectrum at point X for regime V.
Fig. 12a, b. Phase-locked measurement – mean-phase velocity and STD value - at point 2.
Fig. 12c, d. Phase-locked measurement – mean-phase velocity and STD value - at point X.
The effect of phase angle choice is apparent also from phase-locked measurements. Again it is valid that for angle equal to zero the binding is more powerful and the weakest binding is observed for ϕ= π. While the peak-to-peak amplitude of mean-phase velocity is 3,9 m/s for ϕ= 0, moving blades again each other gives only 2,2 m/s. Travelling wave defined by angle ϕ=- π/2 or π/2 gives approximately 2,5 m/s. The average STD value is 2,25 m/s for all mentioned cases.
4
Conclusion
The experimental investigation of the flow field in the vicinity of the blade cascade with self-excitation blades was performed using TR-PIV. The outlet tunnel velocity varied from 10 to 40 m/s. The aeroelastic binding between the flow and moving blades was observed and quantitatively evaluation was done from spectral analysis and phase-locked velocities. It seems that the biggest interaction occurs for inter-blade angle equal to zero and for high magnitudes of peak-to-peak blade deviations.
The binding would increase further if the areas were interdigitated. These could arise after that the excitation frequency or blade deviation is increased, optimally both. Now the movement of the blade in one degree of freedom is too low compared to the incoming flow velocity. The velocity of the blade is two orders of magnitude smaller compared to the flow speed. Hence, it is not enough to create the stronger binding. The flow structure has only tiny information about the blade movement during its flow through the inter-blade channel. To increase the velocity of the blade deviation is limited due to parameters of the excitation actuators. Further option is add the second degree of freedom which is rotational movement of each individual blade which should result in much stronger binding due to changing value of angle of attack.
Acknowledgement
This work was supported by the research project of the Czech Science Foundation No. 16-04546S “Aero-elastic couplings and dynamic behaviour of rotational periodic bodies”.
References
1. J. Lepičovský, E. R. McFarland, V. R. Capece, T. A. Jett, R. G. Senyitko, NASA/TM-211894 (2002) 2. V. Tsymbalyuk, J. Linhart, XVII IMEKO World
Congress, TC3 (2003)
3. M. Nowinski, J. Panovsky, J. Eng. Gas Turbines Power 122(1), 82-88 (1999)
4. V. Uruba, M. Knob, V. Vlček, M. Luxa, J. Lukáč, R. Dvořák, Interaction and Feedbacks, 109-114 (2008)
5. J. Vimmr, O. Bublík, A. Pecka, L. Pešek, The 13th ISAIF in Okinawa, ISAIF13-S-0089 (2017)
6. L. Půst, L. Pešek, International Journal of Bifurcation and Chaos, IJBC-D-16-00353R2 (2017) – to be published