ABSTRACT
PADAVAGOD SHIVKUMAR, ADITYA. Flow Testing and CFD Modeling of Poultry Engineering Chamber. (Under the guidance of Dr. Lingjuan Wang-Li).
The value of production from livestock industry in the U.S. has been growing every year and the poultry industry is prominent among the livestock industries. Though the annual production has been increasing every year, it has been reported that the broiler industry continues to face issues which tend to make the production process less economical. The most common problems faced by the industry are bird mortality and retarded growth due to heat-stress or degraded animal environment. Another rising concern to the poultry industry is the emissions from animal feeding operations (AFOs). Ventilation plays an important role in establishing a suitable environment and in quantifying emissions. Numerous field and lab-scale studies have been carried out to determine the optimum ventilation rate. However, the poultry industry is far from achieving an optimal growth environment. This study evaluated the performance of a dedicated Poultry Engineering Chamber complex designed to conduct studies on ventilation, air quality and animal welfare. The performance evaluation of the Poultry Engineering Chamber complex was carried out by:
1. Evaluating the ventilation rate and repeatability of the predesigned chambers for poultry welfare and air quality studies.
2. Evaluating the velocity distribution in the animal occupied region at different operating configurations.
3. Modeling the air flow using CFD technique to simulate, virtually, the indoor micro climate and validating the models using experimental data.
Both, chambers 5 and 6 had similar flow rates and hence, the RPM could be linearly increased to obtain constant flow rates across all chambers. The damper flow rates were uniform for all chambers indicating an equal amount of fresh air intake. 3-D velocity measurements in the core chamber showed higher velocities at bird height near the inlet and lower values away from the inlet due to the interference by the feeders.
Flow Testing and CFD Modeling of Poultry Engineering Chamber
by
Aditya Padavagod Shivkumar
A thesis submitted to the Graduate Faculty of North Carolina State University
in partial fulfillment of the requirements for the degree of
Master of Science
Biological and Agricultural Engineering
Raleigh, North Carolina
2014
APPROVED BY:
_______________________________ ______________________________ Dr. Lingjuan Wang-Li Dr. Sanjay Shah
Committee Chair
BIOGRAPHY
ACKNOWLEDGEMENTS
First and foremost I wish to thank my advisor, Dr. Lingjuan Wang-Li for her continuous support and encouragement. She has been a great mentor and a source of guidance from the day of commencement of this project. I am grateful to her for providing me the opportunity to learn and work under her guidance. I highly appreciate the number of hours she has dedicated to help me develop and improve the project. I thank her for bearing with my inefficiencies and for helping me remain focused. This work would not have been possible without her expertise and vested faith in me.
My thesis committee has been utmost supportive throughout the period. I thank Dr. Sanjay Shah for his support and suggestions. He has been instrumental in helping me design the experiments and collecting data. I deeply acknowledge Dr. Larry Stikeleather for guiding me through the computational aspects of the project. I thank him for taking care of the technical glitches and helping me carry out the tasks smoothly. My special thanks to Dr. Montserrat Fuentes, whose comments have greatly helped me improve the project. Her guidance through coursework has immensely helped me work with large data and data analysis.
I would like to acknowledge the financial supports from National Science Foundation (NSF CAREER Award No. CBET-0954673), National Institute of Food and Agriculture (NIFA) special grant, Animal and Poultry Waste Management Center, Department of Biological & Agricultural and Biological Engineering, College of Agricultural and Life Science at NC State.
Special thanks to Bin Cheng, a fellow student and a friend for his help in collecting data. I also thank Sherry Li, the system administrator and Heather Austin, the administrative support for helping me continue my work without hindrance. I kindly acknowledge the BAE research shop for helping me with the testing setup.
Above all, I would like to thank the Department of Biological and Agricultural engineering and North Carolina State University for providing me the opportunity and the facilities to learn and excel.
TABLE OF CONTENTS
LIST OF TABLES ... viii
LIST OF FIGURES ... ix
CHAPTER 1 INTRODUCTION ...1
1.1 Thermal environment and animal welfare ...2
1.2 Air quality in animal housing facilities ...4
1.3 Commercial poultry housing ...5
1.4 Existing poultry research chambers ...7
1.5 Application of CFD in animal housing ... 7
1.6 Research objectives ... 9
CHAPTER 2 PERFORMANCE EVALUATION OF THE POULTRY ENGINEERING CHAMBERS: FIELD TESTING ... 11
2.1 Introduction ... 11
2.2 Methodology ... 14
2.2.1 Description of the Poultry Engineering Chamber ... 14
2.2.2 Instrumentation ... 17
2.2.3 Experimental design ... 18
2.2.3.1 Phase-1 testing ... 18
2.2.3.2 Phase-2 testing ... 22
2.2.3.3 Air flow balancing and damper flow rate ... 25
2.3 Data analysis ... 27
2.3.1 Phase-1 testing- Comparison of system flow among six chambers ... 27
2.3.2 Phase-2 testing- Core chamber velocity profiles ... 27
2.3.3 Damper flow rate ... 27
2.4 Results and discussion ... 28
2.4.1 Phase-1 testing ... 28
2.4.2 Phase-2 testing ... 32
2.5 Conclusion and further studies ... 47
CHAPTER 3 PERFORMANCE EVALUATION OF THE POULTRY ENGINEERING CHAMBERS: CFD MODELING ... 49
3.1 Introduction ... 49
3.1.1 Application of Computational Fluid Dynamics (CFD) in Agriculture ... 49
3.1.2 Rationale for using CFD ... 52
3.1.3 Theory of CFD ... 54
3.2 Methodology ... 55
3.2.1 Flow domain ... 55
3.2.2 Meshing ... 57
3.2.3 Numerical simulation ... 57
3.2.4 Boundary conditions ... 58
3.2.5 CFD validation ... 62
3.3 Results and discussion ... 63
3.3.1 Field measurements ... 63
3.3.2 Simulated results ... 64
3.3.3 Measured vs. simulated results ... 67
3.3.4 CFD validation ... 69
3.4 Conclusion and further studies ... 78
REFERENCES ... 80
APPENDICES ... 87
Appendix-I Chamber flow rate tables & velocity plots ... 88
Appendix-II CFD simulations –FloEFD plots ... 108
LIST OF TABLES
Table 2.1 Description of the instrumentation ...17
Table 2.2 Pase-1 Testing configuration ... 18
Table 2.3 Spacing for area coverage ...19
Table 2.4 Velocity measurement points in the circular exhaust duct ... 21
Table 2.5 Summary of 3-D velocity measurement configuration ... 23
Table 2.6 Chamber system flow rates versus pressure drop at 30% damper opening; Q in CFM, ΔP in inches of water ... 28
Table 2.7 Tukey’s HSD method (alpha=0.05): Pairwise comparison of flow rates in different chambers ... 30
Table 2.8 Flow rate difference in % at 800 RPM ... 31
Table 2.9 Summary of the damper flow rates (CFM) in different chambers ... 44
Table 2.10 Tukey’s HSD method (alpha=0.05): Pairwise comparison using of damper flow rates in different chambers ... 46
Table 3.1 Simulation of different cases ... 58
Table 3.2 Type 1 Boundary conditions and constant computational settings... 59
Table 3.3 Boundary conditions for different cases ... 61
Table 3.4 Measured air velocity at different positions and heights ... 64
Table 3.5 Measured air velocity at inlet for BC-2 boundary conditions ... 64
Table 3.6 Summary of ANOVA for simulated and measured air velocity ... 68
LIST OF FIGURES
Figure 1 Production growth rates of different livestock industries ... 1
Figure 2.1 Longitudinal cross section of the poultry engineering chamber ... 15
Figure 2.2 Hot-wire anemometer and measurement site ... 19
Figure 2.3 Area coverage to obtain pressure drop in the flow ... 20
Figure 2.4 Velocity monitoring configuration and annotation ... 24
Figure 2.5 Sensor setup at bird height (0.20m (8 in.) from ground) ... 25
Figure 2.6 Damper flow testing- duct and measuring points ... 26
Figure 2.6a Velocity vs. RPM at 30% damper opening for chamber 1 ... 33
Figure 2.6b Velocity vs. RPM at 70% damper opening for chamber 1 ... 33
Figure 2.7a Velocity vs. RPM at 30% damper opening for chamber 4 ... 34
Figure 2.7b Velocity vs. RPM at 70% damper opening for chamber 4 ... 35
Figure 2.8a Velocity vs. RPM at 30% damper opening for chamber 6 ... 36
Figure 2.8b Velocity vs. RPM at 70% damper opening for chamber 6 ... 36
Figure 2.9a Velocity vs. RPM at 30% damper opening at position at position ‘LF’ ... 38
Figure 2.9b Velocity vs. RPM at 30% damper opening at position at position ‘C’ ... 38
Figure 2.9c Velocity vs. RPM at 30% damper opening at position at position ‘RF’... 39
Figure 2.10 Velocity profiles in core chamber of chamber 1 at 600 RPM (30 Hz) and 30% damper opening ... 41
Figure 2.11 Velocity profiles in core chamber of chamber 2 at 600 RPM (30 Hz) and 30% damper opening ... 42
Figure 2.12 Velocity profiles in core chamber of chamber 3 at 600 RPM (30 Hz) and 30% damper opening ... 43
Figure 2.13a Damper Flow rate at 50% damper opening ... 45
Figure 2.13b Damper Flow rate at 30% damper opening ... 45
Figure 3.1 Core chamber layout – Flow domain ... 56
Figure 3.2 Velocity profile at bird height (0.20 m) ... 65
CHAPTER 1 INTRODUCTION
In the United States (US), the value of production from livestock industry was estimated to be $71 billion in 2013 (USDA, 2013). Greater production rates are being achieved by the implementation of modern techniques in animal welfare and animal housing facilities which make them one of the most important aspects of livestock industry. Figure 1 shows the growth in production of various livestock industries.
Figure 1 Production growth rates of different livestock industries
According to the National Chicken Council (NCC, 2014) the annual production (ready to cook basis) of broilers in 2013 was estimated to be 16.9 megatons with an annual growth rate of 2.1%. Consequently, for the industry to continue to remain sustainable, high production rates have to be achieved by striving to establish optimal conditions for promotion of broiler growth.
An important factor which comes to picture, in the context of growing animal production and animal housing facilities, is the consequent air pollutant emissions. Studies have shown that the generation of pollutants in the form of air emissions from the animal housing facility have the potential to compromise animal performance, cause human health problems and also degrade atmospheric air quality. Animal production facilities are under pressure to adopt mitigation strategies that reduce air emissions. Hence, precisely quantifying the emissions from the animal production activities, assessing their effects and developing mitigation measures require reliable emission data and emission characteristics. This can be obtained under strictly controlled conditions of ventilation rates, temperature, humidity and other environmental variables.
1.1
Thermal environment and animal welfare
Animals are affected by the existing thermal environment. The thermal conditions prevailing in the animal occupied zone greatly affect animal performance. In case of poultry, which are homoeothermic, when the effective environmental temperature (EET) is within the thermo- neutral zone (TNZ), core body temperature (tb) of adult chickens is maintained between 41.2 oC and 42.2 oC by thermoregulatory mechanisms with minimal effort. According to Tao and Xin, (2003) EET is the result of integrating the environmental factors, including air temperature (T), relative humidity (RH), air velocity (V), solar radiation and precipitation. An air temperature of about 21.1 oC is considered to be the thermoneutral zone for broilers (Dozier et al., 2007). If the thermoregulation mechanism is insufficient to maintain homoeothermy, tb begins to rise and eventually leads to death from heat exhaustion. This phenomenon is usually termed as heat stress.
Heat stress not only causes bird loss, but in less severe cases, also causes slower and less efficient growth of birds, resulting in reduced average daily bird weight gain.
A recent study by Mack et al., (2013) showed that birds subjected to heat stress conditions spend less time feeding, more time drinking and panting, as well as more time with their wings elevated, less time moving or walking, and more time resting. Heat stress can affect the reproductive function of poultry in different ways. In females, heat stress can disrupt the normal status of reproductive hormones at the hypothalamus which in turn produces hormones which affect the ovary, leading to reduced systemic levels and functions (Lucas et al., 2013). Another recent study by Sohail et al. (2012) reported that broilers subjected to chronic heat stress had significantly reduced feed intake (16.4%), lower body weight (32.6%), and lower feed conversion ratio (+25.6%) at 42 days of age. Studies by Dai et al. (2012) and Imik et al., (2012) demonstrated that the heat stress is associated with depreciated meat chemical composition and lower broiler quality.
In general, animal welfare is a multifactorial condition based on healthy and disease free surroundings, ability to perform specific behaviors and to cope with social and environmental conditions. Lucas et al., (2013) reported that heat stress is often times not experienced in isolation but is aggravated by other stressors like past experience and social interactions. Several recent studies have reported the role of genetics in determining the intensity of heat stress (Mack et al., 2013; Soleimani et al., 2011; Felver-Gant et al., 2012). Nevertheless, more studies are required in this area to ascertain the influence of genetics (Lucas et al., 2013). Currently, the most convenient and effective way to deal with heat stress is by maintaining an environment suitable for broiler growth.
species (Tao et al., 2003). Purswell et al., (2012) reported that bird performance declined significantly as THI exceeded 21˚C in case of heavy broilers (body weight greater than 3.2 kg).
However, when the ambient temperature and humidity are high, evaporative cooling systems fail to regulate the temperature of the incoming ventilation air and thus do not help in reducing heat stress. Thus, a uniform and high air velocity may be very effective in enhancing the thermal comfort of the birds under high humidity condition. With high air velocity it is possible to achieve a higher convective heat transfer (Simmons et al., 1997). To investigate the relative importance of air temperature, humidity and velocity temperature-humidity-velocity index (THVI) was developed (Tao et al., 2003). However, the THVI developed was based on the classification of acute conditions and hence, does not consider the sub-lethal effects that can harm the bird performance over time.
1.2
Air quality in animal housing facilities
In poultry production, litter is the source of volatilizing NH3 and its management is one of the key factors affecting emission rate and bird health. The most common technique adopted to mitigate NH3 emissions is by maintaining litter moisture levels.
Hence, RH plays an important role in maintaining air quality and therefore has to be controlled. Suitably designed ventilation systems are used to control the litter moisture levels and also the RH of the surrounding. More importantly ventilation management plays a significant role in controlling moisture. Determination of NH3 emissions requires accurate measurement of NH3 concentration in the air leaving the building and the volume flow rate of air being discharged. While this seems simple in concept but in practice, both concentration and ventilation are difficult to measure accurately under commercial poultry house conditions. Despite the advances in ventilation systems inside poultry houses, it is difficult to analyze their performance, mainly due to changes in ventilation patterns and use of different equipment in the same house (Vranken et al., 2005; Casey et al., 2008). The uncertainty in the measurement of gas emissions from the houses is mainly due to the ventilation rate (Gates et al., 2009). Other authors have reported bird age, management practices and nutrition as factors contributing to the variation in gas emissions from poultry houses (Freguson et al., 1998; Casey et al., 2004; Wheeler et al., 2006). It can be seen that an environment with higher degree of control over RH, temperature and air flow rates is required to estimate the air emissions associated with animal production facilities. With accurate ventilation rate measurements and gas emission concentrations, emission rates may be calculated to support regulatory concerns.
1.3
Commercial broiler housing
Generally, the existing animal houses are large and ventilated either naturally or more commonly by fans. Commercial broiler houses are, usually, 152.4 m-167.64 m (400-600 feet) in length and 12.19 m-15.34 m (40 to 60 feet) in width. Numbers of birds vary from 18000 to 32000 based on housing dimension and season.
(‘Wind chill’ effect) broiler houses are generally equipped with tunnel ventilation systems consisting of multiple fans of known capacity on end walls or side walls or both which are controlled by environmental controller that measure house temperatures.
Evaporative cooling pads are used in mechanically ventilated houses to lower the temperature of the incoming air in case of high ambient temperatures. In case of naturally ventilated houses curtains and screens are installed to control the air flow and foggers and misters are used to control temperature.
Air velocity distributions in commercial farms have been evaluated (Boon and Battams, 1988; Lee et al., 2003; Wheeler et al., 2003). However, there are several issues with animal houses:
Air velocity and hence the temperature uniformity is essential for maintaining the required thermal environment as a whole. None uniformity encourages the animals to migrate towards ventilated zones which may already be crowded and thus eventually increase heat stress (Taler et al., 2002). In case of broiler houses, which usually are large structures, the air is, in general non-uniform. There is little or no control over the environment in case of naturally ventilated houses.
The large structure of the animal houses also makes it necessary to have high number of monitoring points in order to obtain a reliable measurements of distributions of environmental parameters (T, RH and V) making the study less economical.
It is very difficult to establish sensors at bird level due to the bird density and bird movement inside large commercial broiler houses.
Thus building designs and control systems to create suitable thermal environment (specifically air velocity) in animal occupied zones in a commercial farm has not been completely achieved (Bustamante et al., 2013).
1.4
Existing poultry research chambers
As a suitable environment is required to quantify and optimize the variables such as air T, RH and V to create a specific thermal environment, many attempts have been made to simulate the conditions similar to a commercial farm but with a greater degree of control (Begermann et al., 2006). A number of research chambers have been designed to house the birds and maintain a controlled environment (Begermann et al., 2006; Leftcourt, 2001). A research chamber is an advantageous tool in multiple scientific fields. Chambers enables researchers to create unique circumstances that simulate real-world conditions. Challenges faced in the field or real world can be recreated and fully controlled in enclosed chambers allowing specific variables to be monitored and assessed as other factors fluctuate or change. More literature regarding the existing research chambers is provided in chapter 2.
However, it has been observed that all the research chambers used were designed either for measuring certain physiological stimuli alone or during transportation of broilers (Mitchelle et al., 2001; Hamrita et al., 1998; Brown-Brandl et al., 2003, 2005). The chambers designed so far for research purposes can accommodate very few birds and hence neglect the effect of flocking of birds and their behavior. Although, most of the chambers have environmental control systems they lack the ability to deliver and study the effects of uniformity of air flow.
Thus, considering the shortcomings of certain existing chamber designs the current study aims to assess a poultry chamber complex which can simulate the environment close to that in commercial broiler houses with greater control over the environmental parameters, namely, T, RH and V. Also, the study evaluated the performance by modeling of air flow through the chamber at desired thermal and air speed configurations.
1.5
Application of CFD in animal housing studies
In order to realize wholly the advantages of a controlled environment it is necessary to have in place a precise quantitative understanding of the environmental variables to achieve optimal results.
A number of studies have quantified the environmental parameters such as T, RH and V, with fair degree precision, for the optimal growth of broiler chickens (Lott et al., 1998; May et al., 2000; Yahav et al., 2001; Simmons et al., 2003). The amount of information required to fully quantify these variables is dependent on the physical experimentation and the precision of the tools used. Though direct measurements are most reliable, it is increasingly complex and time consuming to do a comprehensive analysis which often involves high cost implications. Also, a large number of monitoring points are required for the measurements to be representative. Mathematical models and numerical modeling methods such as Computational Fluid Dynamics (CFD) can be effectively used to precisely quantify various environmental variables in simulated environment. Various ventilation configurations can be examined and designed by simulating these conditions virtually. However, these numerical models can only supplement direct measurements and hence, should be validated with field measurements before using the models as tools for decision making (Blanes-Vidal et al., 2008; Bustamante et al., 2012).
Computational fluid dynamics techniques are increasingly being used in bio-systems and agricultural engineering (Norton et al., 2007). CFD can be used to numerically simulate the ventilation conditions and hence develop spatial and time dependent solutions for pressure, velocity, temperature and pollutant transport. Various conditions and variables can be tested using CFD which makes it easy to understand and study potential design techniques.
Various benefits of using numerical modeling have been summarized by Norton et al., (2007). More literature regarding the application of CFD in agriculture is provided in Chapter 3.
In this study, an attempt was made to model the air flow in a research chamber using CFD technique to supplement field observations. Suitable boundary conditions were used to simulate the effect of environmental parameters set for the optimal growth of broiler chickens.
1.6
Research objectives
Two things are desirable for carrying out animal air quality and animal welfare study efficiently viz. (1) an environment with necessary control over temperature, humidity and air velocity and a viable system to quantifying these parameters precisely and with ease (2) Simulating environment similar to commercial poultry houses by using compact research chambers which allow testing over a flock rather than one or few test specimens.
This study assesses such an environmentally controlled research chamber by testing the stability of the chamber system for different flow regimes, studying the effect of varying velocities and structural features on flow characteristics. An attempt was made to model the air flow in the research chamber using CFD technique to supplement animal welfare studies and air quality studies. Suitable boundary conditions were used to simulate the effect of environmental parameters (T, RH and V). The effect of chamber design and its configuration in establishing a uniform flow field was assessed.
The specific objectives of this study can be listed as follows:
1. Evaluate the utility and effectiveness of a predesigned chamber complex for poultry welfare and air quality studies.
2. Evaluate the indoor climate at different operating configurations (ventilation rates, velocity distribution, etc.).
CHAPTER 2 PERFORMANCE EVALUATION OF THE POULTRY
ENGINEERING CHAMBERS: FIELD TESTING
2.1 Introduction
The importance of obtaining accurate field measurements has been emphasized repeatedly in the literature. As described in chapter 1 there are certain limitations for carrying out field studies but nevertheless field data is required to bolster the results obtained from other indirect methods. Measuring the ventilation rate and the velocity in the proximity of the test subject with the help of sensors or hand held instruments is a common methodology adopted by the research community. Research chambers or lab scale control systems can help negate the use of a large number of sensors and thereby making the study more economical. With a controlled environment it is possible to obtain information most accurately. This enables researchers to carry out control studies and analyze specific physiological responses by changing the circumstances and environment in the chamber. In case of poultry, studies witch reflect the phenomena in a commercial poultry farm can replicated in a controlled environment.
Many attempts have been made to simulate the conditions similar to a commercial farm but with a greater degree of control (Begermann et al., 2006). A number of research chambers have been designed to house the birds and maintain a controlled environment (Begermann et al., 2006; Leftcourt, 2001). Challenges faced in the field or real world can be recreated in enclosed chambers allowing specific variables to be monitored and assessed as other factors fluctuate or change.
could create an air temperature range from 0 to 100°C. The inner room was divided into three small chambers with heating units. The total animal space was 1.2 m3 all chambers put together. The walls were built of Plexiglas and the chambers housed a humidifier. Thus, the attempt was to establish more control over temperature and humidity. This system was further improved by Brown-Brandl et al. (2005) that controlled both the temperature and humidity with air handling units. The chambers were thoroughly insulated with sandwiched panels (R-22) using fiberglass reinforced panels and Styrofoam. The physical layout of the system had 4 environmental chambers laid side by side. The compartments were designed to be movable and easy to maneuver. The compartments also included a weighing feeder and a cup waterer.
Mitchell and Kettlewell (1998), Mitchell et al. (2001a) and Hunter et al., (1999) reported on chamber studies with a view to study the physiological responses of poultry during transport. All the three studies used a setup similar to transport crates with wire mesh on the top. Mitchell and Kettlewell (1998) controlled the temperature between 22- 30C. Mitchell et al. (2001a) established temperature ranges between 10-35C with a setup similar to the basic setup. Hunter et al., (1999), in addition to 4 temperature set points, included an air velocity of 0.7 m/s throughout the experiment representing partially ventilated transport systems.
straightener and a variable speed fan to change air velocity. An infrared camera was used to capture thermal footprint of the birds to study the behavioral responses.
Aerts et al., (2003) used respiration chambers to study the heat production in broilers and the factors like lighting and temperature. Six chambers of dimensions 0.3 by 0.55 by 0.5m were used in the study. Temperature was measured to an accuracy of 0.2C with modern instruments like platinum resistant temperature detectors.
It can be seen that all the research chambers used were designed either for measuring certain physiological stimuli alone or during transportation of broilers. The chambers designed so far for research purposes can accommodate very few birds and hence, neglect the effect of flocking and their collective behavior. Nonetheless, most of the chambers have environmental control systems, but they lack the ability to deliver and study the effects of uniform air flow.
Thus, considering the short comings of the existing chambers a Poultry Engineering chamber complex was designed and built at North Carolina State University (NCSU) which can simulate conditions similar to commercial broiler houses with greater control over the environment (Wang-Li, 2013). The performance evaluation of this chamber complex was undertaken in this study. Both field measurements and CFD modeling were adopted to study the chamber characteristics. The current chapter reports the field measurements of the chamber system flow rates, ventilation rates and velocity profiles in the animal occupied zone.
The sonic anemometer was developed to measure surface layer wind and temperature turbulence. More recently 3-D ultrasonic anemometers were extensively used to measure air flow in green houses and livestock buildings. A 3-D ultrasonic anemometer works based on the principle of sound speed in air. The speed of sound is increased in the direction of the wind or air. Thus, the time of flight of an ultrasonic pulse between two transducers is recorded and then, the velocity is calculated using the travel times along the path length.
However, using specific sensors depends on various factors including desired accuracy, economic feasibility, sensor dimensions and availability. Hot-wire anemometer and sonic anemometers were used to carry out flow measurements in this study. A complete list of instruments used is provided in the instrumentation section.
2.2 Methodology
2.2.1 Description of the Poultry Engineering Chambers
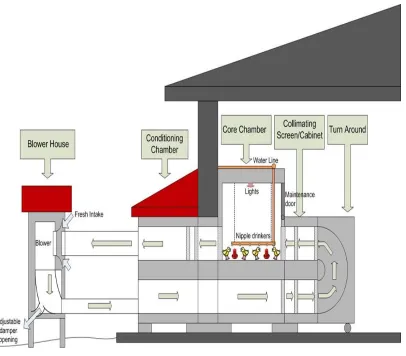
Figure 2.1 Longitudinal cross section of the poultry engineering chamber (Wang-Li et al., 2013)
The following are the main components of the chamber:
Blower house: The structure housed a backward curved blade belt drive centrifugal
Conditioning chambers: The conditioning chamber was provided to house heating/cooling units and humidifiers (to be installed in the bottom part of the chamber in the future) for conditioning the incoming air. No air conditioning units were present during this study. The top part of the conditioning chamber serves as an exhaust duct.
Turnaround: This component was used to direct the flow towards the core chamber and
has a smooth transition giving rise to minimum turbulence.
Core chamber: This is the chamber where animals are kept. The chamber has accessories like feeders, waterlines, lights etc. The chamber can be accessed through maintenance door.
Exhaust duct: Air from the core chamber flows towards the blower through the
circular exhaust duct. Flow testing (velocity, pressure and gas sampling) was performed by measuring air flowing through this chamber.
2.2.2 Instrumentation
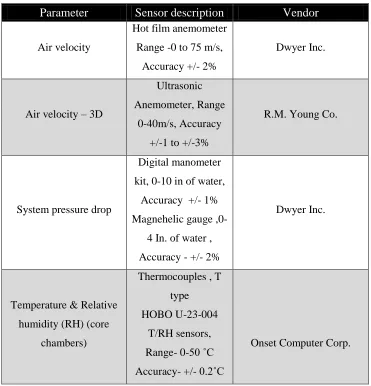
Detailed description of all the instruments used is shown in table 2.1
Table 2.1 Description of the instrumentation
Parameter Sensor description Vendor
Air velocity
Hot film anemometer Range -0 to 75 m/s,
Accuracy +/- 2%
Dwyer Inc.
Air velocity – 3D
Ultrasonic Anemometer, Range
0-40m/s, Accuracy +/-1 to +/-3%
R.M. Young Co.
System pressure drop
Digital manometer kit, 0-10 in of water,
Accuracy +/- 1% Magnehelic gauge
,0-4 In. of water , Accuracy - +/- 2%
Dwyer Inc.
Temperature & Relative humidity (RH) (core
chambers)
Thermocouples , T type HOBO U-23-004
T/RH sensors, Range- 0-50 ˚C Accuracy- +/- 0.2˚C
2.2.3 Experimental design
2.2.3.1 Phase 1 testing
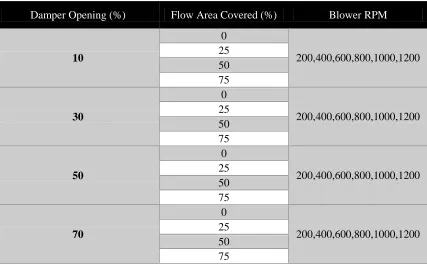
Phase-1 testing was performed to develop a set of chamber system flow curves that describe the operating characteristics of the chamber flow system. The flow rates and differential pressure across the chamber system were obtained for the operating configurations of the blower rotary speed (RPMs) and damper opening combination given in table 2.2. Figure 2.2 shows flow measurement instrumentation and location. The results were tabulated in the form of a database and the curves were developed using the recorded data.
Table 2.2 Phase-1 Testing configuration
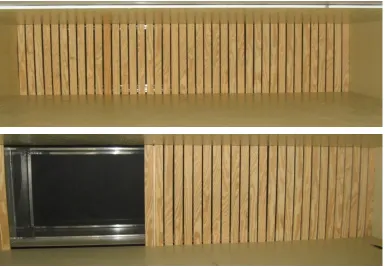
The various system pressure drops were created using a set of wooden strips designed. Figure 2.3 shows the setup. The strips were of equal size and the pressure drop was adjusted by changing the flow area coverage uniformly inside the collimation chamber in the
Damper Opening (%) Flow Area Covered (%) Blower RPM
bottom half of the conditioning chambers. The dimensions of the wood strips and the different area coverage in (%) used are given in table 2.3.
Figure 2.2 Hot-wire anemometer and measurement location
Table 2.3 Spacing of wood strips for area coverage
Flow Area Covered (%) Spacing in meters (inches)
None (as is) NA
25 0.18 (7.3)
50 0.09 (3.84)
75 0.05 (1.95)
Figure 2.3 Area coverage to create various pressure drops in the flow system
Flow measurement method
Table 2.4 Velocity measurement points in the circular exhaust duct
Establishing the measurement points deviated from the prescribed measurement method by ASHRAE (ASHRAE, 2009) due to following reasons:
1. Limitation associated with the length of the anemometer to points along the diameter. As a result, symmetric distribution of velocity was assumed.
2. Limitation regarding measurement position near walls – The position near walls obtained by ASHRAE method was found to be too small and hence was within the length of the probe holder. Also, the length of the ceramic filament of the anemometer was found to be comparable with the length obtained by ASHRAE guidelines which makes it hard in discerning the exact position of the probe.
In order to overcome the above limitations, the following steps were followed to obtain (calculate) the average velocity in the duct.
1. Velocities at various locations in a cross section of the exhaust duct (C, R1, R2, and R3) were measured as mentioned above.
2. Symmetrical distribution of velocity was assumed.
3. The velocities measured at different radial distances (C, R1, R2, and R3) were plotted against the radial distances to obtain flow profile curve.
4. An equation for describing velocity profile in the whole cross section area was obtained based upon the measured profile curve using curve fitting algorithm executed in MATLAB (Appendix –III)
Measurement position Radial distance from wall in meters (inches)
C 0.216 (8.5)
R1 0.161 (6.375)
R2 0.107 (4.25)
5. Radial distances recommended by ASHRAE were used to determine velocities at those radial points using the above derived equation.
6. The velocities were averaged to get the average flow velocity.
7. Average velocity was then multiplied with cross-sectional area to obtain flow rate.
2.2.3.2 Phase 2 testing
Phase-2 testing was performed to measure the velocity profile in the core chamber. Air speed alone does not provide any insight about the spatial distribution of velocities. An air velocity measurement includes the direction of air flow along with speed. This enables a more comprehensive understanding of the air flow inside the core chamber.
Five 3-D ultrasonic anemometers were used to measure the velocity in the chamber at various locations and heights to understand the velocity gradients and lateral distribution. The instruments were setup inside the chamber and the parameters measured include:
Velocity – U direction (direction perpendicular to flow) Velocity- V direction (direction along the flow)
Velocity- W direction (vertical direction) Temperature (Sonic temperature)
A 4-channel data logger was used to record the velocity outputs from the anemometer. The frequency of the logger was set such that data was recorded every to 10 seconds i.e. 6 times per minute. The anemometers were powered using a portable rechargeable battery. The default settings of the anemometer were changed to suit the experimental design, which included serial outputs in the form of u, v, w, T (sonic temperature); where +u- wind from the east; +v- wind from the north; +w- wind blowing upwards (updraft).
Core chamber air velocity measurement method
A customized measurement method was adopted to conduct the phase-2 testing with a view to address the following issues:
increased. This is also true with measurements at varying heights.
2. The simultaneous measurements of velocity at different locations require the anemometers to be setup and running simultaneously. Considering the dimensions of the chamber, placing multiple anemometers simultaneous may disturb the natural flow which in turn leads to observing unrealistic velocity values.
3. Placing multiple anemometers in different locations and heights with least disturbance can be achieved by sequentially performing tests with different spatial locations and same operating configurations. But using only one sensor at a time leads to inefficient utilization of available time and resources for performing the test.
Hence, a measurement approach which adequately captures the air flow characteristics satisfactorily and at the same time considers the time and resource requirements was designed.
The whole test consisted of velocity measurements at 5 different locations and 3 different heights at each location. Height 1 (0.20 m) was assumed to represent the height of a bird and hence, was termed as bird height. The positions were labeled according to their positions with respect to an observer facing the chamber in the direction of the flow (inlet). The summary of the measurement configuration is provided in table 2.5.
Table 2.5 Summary of 3-D velocity measurement configuration
Position Description Height
LF-Left Front 0.61m (2ft) from the left wall ;
0.61m (2ft) from the inlet
H1- 0.20 m (8 inches) above the bedding (Bird Height) H2- 0.63 m (25 inches) above
bedding
H3- 1.21 m (4 feet) above the bedding
RF-Right Front 0.61m (2ft) from the right wall ;
0.61m (2ft) from the inlet
LB-Left Back 0.61m (2ft) from the left wall ;
0.61m (2ft)from the outlet
RB-Right Back 0.61m (2ft) from the right wall ;
0.61m (2ft) from the outlet
C-Center 1.21m (4ft) from the inlet; 1.21m
The measurement design was as described below:
1. Two sonic anemometers were setup during the first run for a certain operating configuration. The two anemometers were placed apart diagonally in the chamber which realized the maximum separating distance which leads to minimum disturbance as shown in figure 2.4a.
2. The above instrument setup was maintained at 3 different heights (table 2.5) in the subsequent runs.
3. The locations of the anemometers were changed and placed on the other diagonal and step was repeated for this setup (figure 2.4b).
4. Finally, velocity at the center of the chamber (figure 2.4c) was measured using a single anemometer and the test was repeated for varying heights.
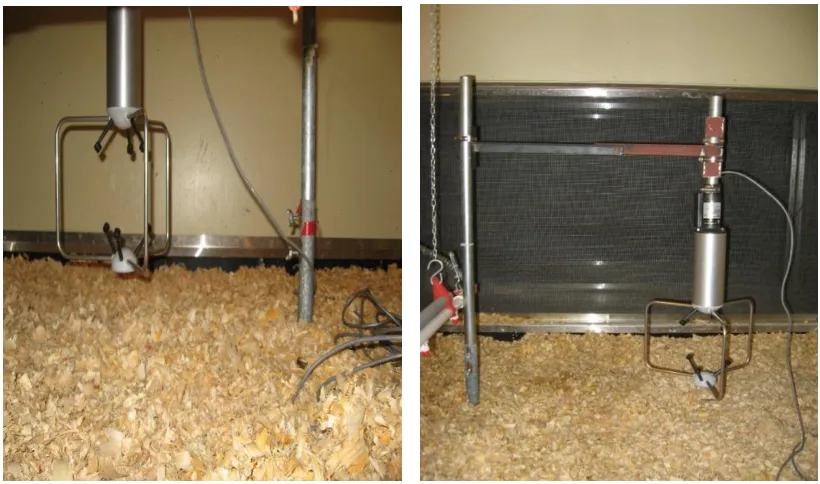
Figure 2.5 illustrates sensor setup for measurements at the bird height.
Figure 2.4 Velocity monitoring configuration and annotation; LB-Left Back, RF- Right Front, RB- Right
Back, LF- Left Front, C-Center
Figure 2.5 Sensor setup at bird height (0.20 m (8in) from ground)
2.2.3.3 Air flow balancing and damper flow rate
The chamber design is a recirculation system where the amount of air recirculated is controlled by the damper. The damper opening is in turn controlled by the linear movement of the rod attached to the damper opening in a hinged door like mechanism.
The need for circulating fresh air inside the chamber is fulfilled by the damper opening. Hence, the amount of fresh air intake was estimated by measuring the air flow at the damper outlet.
The height and width of the extended damper duct had the same dimensions as of the damper outlet which is 0.54 m by 0.38 m (21.5 in by 15 in.). The duct was 3.65 m (12 feet) long which allowed the flow to fully develop and tend to become uniform. Figure 2.6 shows the duct and the measurement points.
Figure 2.6 Damper flow testing- duct and measuring points
Measurement method
2.3 Data analysis
2.3.1. Phase 1 testing – Comparison of the air flow rates among six chambers
ANOVA was used to study the variances in the flow rates among chambers. Assuming null hypothesis that all chambers had the same flow rate, a multiple comparison method, ‘Tukey’s Honest Significant Difference’ method (=0.05) was implemented to obtain pairwise comparison of the flow rates in different chambers. R package was used for the statistical analysis.
2.3.2. Phase 2 testing – the core chamber velocity analysis
The velocity component “u” following the flow direction and perpendicular to the plane of inlet was considered for analysis purposes as the other velocity components were found to be very small compared to the velocity ‘u’. The velocity at bird height is more relevant to understand the thermal comfort of the bird and hence, the bird height (0.20 m) velocity was analyzed in depth. The positions inside the core chamber were compared to assess the difference among chambers. ANOVA was performed to assess significant difference among chambers. Height 2 (0.63 m) and Height 3 (1.21 m) were analyzed with a view to understand the flow dynamics from the measured values. Tecplot 360 (Version 2013 R1, Bellevue, WA, USA), a commercial visualization package, was used to visualize the velocity at different heights. Different profile views were obtained to visualize the velocity (u) in the core chamber.
2.3.3 Damper flow rate
2.4
Results and discussion
2.4.1 Phase 1 testing
Chamber system flow rates versus pressure drop
Table 2.6 summarizes the flow rates and corresponding static pressure across system for all chambers at fan shaft speed of 400 and 600 RPM with 30% damper opening. The average chamber to chamber variation was 5.06% at an RPM of 600. The highest static pressure was 2.59 in. of water realized in chamber 1 and chamber 3 at an RPM of 1200 at maximum area coverage with a damper opening of 10%. The static pressure increased substantially with decrease in the damper openings for the reason that the system is a recirculation system. In the initial testing, it was discovered that the flow rates and the corresponding static pressure drops in chamber 5 and chamber 6 differed from the other chambers substantially. This was due to the fact that both the chambers had air leakage in the system flow path. Corrective action was taken immediately after the leakage problem was identified. Nevertheless, the flow rates in these chambers were 3.5% lower on an average than other chambers. A similar flow rate could be achieved by increasing the RPM such that all chambers had the same flow rate.
Table 2.6 Chamber system flow rates versus pressure drop at 30% damper opening; Q in CFM, ΔP in
inches of water
(a) RPM = 400 (motor in 20 Hz) Screen
coverage (%)
Table 2.6 Continued.
(b) RPM =600 (motor in 30 Hz)
Screen coverage
(%)
Chamber 1 Chamber 2 Chamber 3 Chamber 4 Chamber 5 Chamber 6 ΔP Q ΔP Q ΔP Q ΔP Q ΔP Q ΔP Q 0 0.53 3214 0.41 3251 0.51 3542 0.51 3320 0.42 3051 0.43 3202 25 0.55 3361 0.46 3215 0.53 3409 0.52 3279 0.44 3110 0.45 3165 50 0.54 3352 0.47 3219 0.53 3338 0.52 3014 0.45 2988 0.45 3145 75 0.56 3204 0.5 3073 0.55 3299 0.55 3209 0.48 2976 0.48 3079
Flow rates and the corresponding static pressure at other RPMs (200, 800, 1000, and 1200) and damper openings (10%, 30%, 50%, 70%) are provided in Appendix I. tables A1-1-4.
Table 2.7 Tukey’s HSD method (alpha=0.05): Pairwise comparison of flow rates in different chambers
Chamber
comparison diff lwr upr p adj
2-1 -66.86214 -1670.891 1537.167 0.9999963
3-1 275.50699 -1328.522 1879.536 0.9961611
4-1 -43.98659 -1648.016 1560.042 0.9999995
5-1
-271.15533 -1875.184 1332.874 0.9964392
6-1
-129.60864 -1733.638 1474.42 0.9999012
3-2 342.36913 -1261.66 1946.398 0.989458
4-2 22.87555 -1581.153 1626.905 1
5-2
-204.29319 -1808.322 1399.736 0.9990828
6-2 -62.7465 -1666.775 1541.283 0.9999973
4-3
-319.49359 -1923.523 1284.535 0.9923291
5-3
-546.66232 -2150.691 1057.367 0.9209412
6-3
-405.11563 -2009.145 1198.913 0.9775496
5-4
-227.16874 -1831.198 1376.86 0.9984692
6-4 -85.62204 -1689.651 1518.407 0.9999873
Flow consistency test
In order to quantify the difference in flow rates among the chambers a flow consistency test (leakage test) was carried out. The test was carried out for each chamber at lower RPMs (200,400,600) for a very short period of time (about 5 minutes at each RPM) such that the seals were not over pressurized. The damper was completely shut and the blower was run at different RPMs. The velocity and static pressure were measured at the exhaust duct similar to phase 1 testing. Table 2.8 summarizes the findings of the test.
Table 2.8 Flow rate difference in % at 600 RPM
Chamber 1 Chamber 2 Chamber 3 Chamber 4 Chamber 5* Chamber 6
Chamber 1 0.00 3.24 -3.82 0.25 10.27 10.79
Chamber 2 -3.35 0.00 -7.30 -3.08 7.27 7.80
Chamber 3 3.68 6.80 0.00 3.93 13.58 14.08
Chamber 4 -0.25 2.99 -4.09 0.00 10.04 10.56
Chamber 5 -11.45 -7.83 -15.71 -11.16 0.00 0.58 Chamber 6 -12.10 -8.46 -16.39 -11.81 -0.58 0.00 *
The testing results before the leakage in Chamber 5 was identified and corrective action was taken. The differences of the flow rates between chambers 3 and 5 were down to 13.4% after the leakage problem in Chamber 5 was fixed.
2.4.2 Phase-2 testing
Velocity at the bird height (0.20 m)
Figures 2.6-2.8 show some examples of the air velocity at bird height (0.2m) inside the core chamber at different positions obtained at different RPMs. All the chambers were found to have similar velocities variations. Chamber 5 and 6 had lower velocities as a result of lower overall flow rates. This is most probably due to some minor air leakage along the flow path especially in areas where the chamber components are joined and pressed against each other. The figures (2.6-2.8) indicated that the flow was slightly none uniform as positions at the same distance from the inlet had different velocities. This may be partially due to the placement of flow inlet duct entering the conditioning chamber in the bottom part of the chamber more towards the left of the center line of the chamber. However, the difference was non-significant when the accuracy of the measurement was taken into consideration. The positions near the inlet had velocities ranging from 0.8 m/s to 2 m/s at 600 to 1200 RPMs, respectively.
Figure 2.6a Velocity vs. RPM at 30% damper opening for chamber 1
The flow in chamber 1 was found to be consistent compared to the flow in other chambers. Figure 2.6a and figure 2.6b show the velocity variation at different RPMs for 30% and 70% damper opening respectively. A similar trend existed at different damper openings with lower velocities at larger damper opening. The ‘LF’ position had higher velocity though it was at the same distance the ‘RF’ positions. The difference between the velocities at ‘LF’ and ‘RF’ positions increased with increase in the RPM. This indicates the flow was slightly directional but not erratic. Similarly, positions ‘LB’ and ‘RB’ had a similar variation owing to higher velocities in the left section of the core chamber. Chamber 2 (shown in Appendix I) behaved similar to chamber 1 with lower velocities but not substantially different from that of chamber 1.
Figure 2.7b Velocity vs. RPM at 70% damper opening for chamber 4
Figure 2.8a Velocity vs. RPM at 30% damper opening for chamber 6
Chamber 5 and chamber 6 exhibited similar velocity variations at all the positions inside the core chamber. Both chambers had lower overall flow rates owing to some air leak in the flow system. This was reflected in the pressure drop measurements in phase 1 tests. However, the flow was more uniform compared to other chambers with the positions near the inlet and the center having the same velocity at a particular RPM. Consequently, low velocities were measured at positions away from the inlet as shown in figure 2.8a and figure 2.8b (chamber 6).
The velocity vs. RPM plots for other chambers and at other damper opening settings are provided in Appendix I (Figures A1-1 to 15).
Velocity comparison among chambers
Figure 2.9a Velocity vs. RPM at 30% damper opening at position ‘LF’
Figure 2.9c Velocity vs. RPM at 30% damper opening at position ‘RF’
Velocities at height 2 and height 3
However, in many observations near the inlet the velocity at bird height (0.2 m) was higher than at height 2 (0.63 m). This was probably due to the fact that the upper layer of air moved faster in upward direction than the lower layers causing lesser horizontal momentum at height 2.Hence, the observations do not agree with the assumption of uniform velocity across the inlet. The ‘z’ velocity component at positions near the inlet was as high as 0.19 m/s (at 1200RPM) which is relatively significant when compared to the velocity in ‘x’ direction (direction of flow).
Side view
Inlet
Inlet
Outlet
Top view
The above figure clearly shows the variation of the velocity in the vertical direction. At height 3 the velocity was very low at positions near the inlet. This is due to the jet effect of the flow at the inlet. The flow variation across the chamber can be seen from the side profiles in the above figure. The velocity was greater at the inlet and slowly fades with increase in distance. The effect of feeders is evident from the side view shown in the figure. The velocity variation in the side view shows low velocity in the rear end of the chamber.
Figure 2.11 Velocity profiles in core chamber of chamber 2 at 600 RPM (30 Hz) and 30% damper
opening
Inlet
Outlet
Inlet
Chamber 2 had a more uniform flow compared to chamber 1. The velocity contour shows a more uniform distribution in the top view shown in the figure 2.11 compared to that of chamber 1 (figure 2.10). However, the average velocity was relatively low compared to chamber 1 and chamber 3 (figure 2.7 and figure 2.9).
Figure 2.12 Velocity profiles in core chamber of chamber 3 at 600 RPM (30 Hz) and 30% damper
opening
Top view
Side view
Similar to chamber 1 chamber 3 has higher velocity in left section of the core chamber at bird height as depicted by the top view of the above velocity contour.
2.4.3 Damper flow– Fresh air intake
Table 2.9 lists the measured damper flow rates for different chambers at different operating configurations. It was observed that greater variation in damper flow rates occurred at higher RPMs and larger damper openings. This is certain because with higher air speeds the turbulence increases and the uncertainty in the measure velocity increase consequently. Figure 2.13 shows the variation in damper flow rates among chambers. However, Analysis of variance (ANOVA) showed no significant difference in the mean damper flow among different chambers. The F-statistic was found to be 0.005 and the corresponding p-value was found to be close to 1 and thereby, failing to reject the null hypothesis of no significant difference in means.
Table 2.9 Summary of airflow rates through dampers (CFM) in different chambers
Opening (%) RPM Chambers Mean SD
1 2 3 4 5 6
10 600 254 261 221 252 230 245 244 15
10 1200 547 533 470 567 517 513 524 33
30 200 173 183 184 163 160 159 170 12
30 600 613 621 645 653 632 585 625 24
30 1200 1358 1363 1360 1434 1363 1357 1372 30
50 200 271 264 275 250 254 266 263 10
50 600 955 911 973 958 1015 925 956 37
(a)
(b)
Figure 2.13 (a) Damper Flow rate at 50% damper opening (b) Damper Flow rate at 30% damper opening
Table 2.10 shows the pairwise comparison obtained using Tukey’s HSD method with an alpha value of 0.05. The p-values in all the cases were found to be equal to one indicating no significant difference in damper flow rates.
0.00 500.00 1000.00 1500.00 2000.00 2500.00
10 20 30 40 50 60
Fl o wr ate ( CFM )
Frequency of the motor (Hz)
Chamber 1 Chamber 2 Chamber 3 Chamber 4 Chamber 5 Chamber 6 0.00 500.00 1000.00 1500.00 2000.00
10 20 30 40 50 60
Fl
ow
rate
(CFM)
Frequency of the motor (Hz)
Table 2.10 Tukey’s HSD method (alpha=0.05): Pairwise comparison using of damper flow rates in
different chambers
Chamber
Comparison diff lwr upr p adj
2-1 -27.405092 -990.4875 935.6774 0.9999993
3-1 -7.651337 -970.7338 955.4311 1
4-1 16.142937 -946.9395 979.2254 1
5-1 -5.920407 -969.0029 957.162 1
6-1 -27.96774 -991.0502 935.1147 0.9999993
3-2 19.753755 -943.3287 982.8362 0.9999999
4-2 43.54803 -919.5344 1006.6305 0.9999932
5-2 21.484685 -941.5978 984.5671 0.9999998
6-2 -0.562648 -963.6451 962.5198 1
4-3 23.794274 -939.2882 986.8767 0.9999997
5-3 1.73093 -961.3515 964.8134 1
6-3 -20.316403 -983.3989 942.766 0.9999998
5-4 -22.063344 -985.1458 941.0191 0.9999998
6-4 -44.110677 -1007.1931 918.9718 0.9999928
2.5 Conclusion and further studies
Flow testing of the poultry engineering chambers was carried out. The flow rate in the overall system in each chamber was assessed. Also, the velocity profiles in the animal occupied region was measured with a view to visualize the velocity variation across the core chamber and establish a field dataset to validate the results obtained using CFD which is further discussed in detail in chapter 3.
The observations of the flow testing can be summarized as follows:
1. Phase-1 testing was aimed at analyzing the flow rates and the corresponding pressure drops across the system as a consequence of the system geometry and components. The test was carried out at 6 different RPMs and 4 damper opening combinations in each of the 6 chambers. The average difference in flow rates among chambers was 5.06% at 600 RPM. Chamber 1 and chamber 3 had higher flow rates. Chambers 5 and 6 had lower flow rates even after fixing the leakage. Both the chambers 5-6 had approximately the same flow rates and hence, an RPM correction could be applied to obtain uniform flow rates in all chambers. A flow consistency test was performed to quantify the absolute flow rate difference between chambers 5-6 and other chambers. This difference can be used to apply an RPM correction at any operating RPM. 2. Phase-2 test aimed at visualizing the variation in velocity inside the core chamber
Chamber 1 and Chamber 3 showed higher velocity in the left section of the core chambers partially due to the geometrical placement of the inlet duct entering the conditioning chamber in the lower segment of the chamber system. However, the deviation in flow between left and right sections was prominent only at higher blower RPMs. Other chambers had fairly more uniform flow across the core chambers.
3. The damper flow rate measurements provided a means of assessing the blower performance (speed, slippage etc at a particular RPM) as the flow is only dependent on the damper opening and not on the geometry of the whole system. As a result, the blowers in all the chambers were found to perform consistently. There was no significant deviation in the damper flow rates among the chambers indicating similar damper structure and blower performance. The difference between the damper flow rates increased with increase in RPM. Higher velocities result in greater turbulence and hence less accurate flow measurements.
4. The overall structure of the Poultry Chamber with few corrective measures is suitable for conducting poultry research and air quality studies. RPM corrections applied to chambers with lower flow rates or air leakage would result in similar flow conditions and hence similar indoor environment. With such a system in place, a controlled environment can be established to conduct reliable research studies.
CHAPTER 3 PERFORMANCE EVALUATION OF THE POULTRY
ENGINEERING CHAMBERS: CFD MODELING
3.1 Introduction
3.1.1 Application of Computational Fluid Dynamics (CFD) in agriculture
Over the years, the development of modern computational techniques like Computational Fluid Dynamics (CFD) coupled with increased computing power as a result of the advancement in hardware technologies have made these methods more versatility, accurate and easy to use (Chen and Srebric, 2002). The availability of commercial CFD packages has made it possible to apply these methods to almost any field of fluid dynamics study. Numerical methods pave way to test and validate ideas and designs before being implemented or fabricated. This gives a tremendous advantage over experimental designs and testing making it highly economical and a great aid for decision making. Currently, simulating industrial processes in order to assure process feasibility and process safety has become necessary even at small scales. The ability of these computational methods like CFD to virtually simulate any property or parameter has made it widely applicable in the areas including aerospace and materials engineering, bio-chemistry, plasma physics, biosystems and agriculture, energy efficiency in buildings and Heating, Ventilation and Air Conditioning (HVAC). Computational Fluid Dynamics (CFD) is being used extensively in intensive agro-based production systems like green-houses, livestock production, meat processing and animal housing units. In a recent comprehensive review, Chen (2009) found that detailed CFD-based studies represented about 70% of the modeling investigations of room ventilation in the past 7 years. CFD has been used successfully in modeling air flows in building (Chen and Srebric, 2002).
quality and quantity of the production, especially when the production is indoors. Many studies have showed that the ability to maintain desired environmental conditions is highly dependent on the design and performance of ventilation conditions (Norton et al., 2007). This is invariably true because the ventilation which represents the air exchange is the driving factor for the temperature, humidity, and air quality and contaminant concentration in the local surroundings. In ventilated structures the exchange processes are mainly dominated by convective heat and mass transfers (Roy et al., 2002). The air flow patterns form the basis for the link between the external environment and the indoor climate and thus a complete understanding of the air flow is necessary to visualize the conditions required for the specific application (Norton et al., 2007). It is very important to understand the air distribution for purposes ranging from identifying hot spots and heat distribution to spread of airborne diseases and energy conservation. All these contribute towards establishing sustainable and safe production system.
Numerous studies have stated the importance of uniform air distribution and the importance of air exchange rate (Spoodler et al., 2000; Pawar et al., 2007; Bustamante et al., 2013). Kavanagh (2003) reported that the knowledge of principles governing the distribution of the indoor climatic variables is necessary when designing production systems or optimizing their performance. In case of crop production, the prevailing environment in the greenhouse needs to be in the temperature range suitable to normal plant growth in a particular season. According to Boulard and Wang (2002) quantitative understanding of the micro climate can help growers optimize crop growth by reducing over-consumption of water and the loss of nutrients to environment. Bot (2001) concluded that the distribution of microclimate variables inside the greenhouse not only causes non-uniform production but also generates problems with pests and diseases. In animal houses, control over the air flow is needed to maintain the optimum temperature and humidity remove gaseous pollutants and maintain the percentage of fresh air.
The requirement of uniformity in temperature and other variables of the microenvironment is more serious in case of livestock housing systems for the reason that animals themselves contribute substantially to the heat inside the housing systems and also, younger animals are more sensitive to the environment around them. Thermoregulation is an important mechanism by which animals are able to balance heat production with heat loss while maintaining a constant body temperature when interacting with external environment (Hahn, 1999). Hence, energy used in maintaining a thermal balance with local environment determines the amount of energy that is made available for growth (Norton et al., 2010). Lago et al (2006) found that in naturally ventilated houses with low control over thermal environment leads to increase in respiratory diseases in young animals.
As compared to natural ventilation, mechanical ventilation proves to be more effective in maintaining the thermal comfort of livestock animals (Bustamante et al., 2013). The extensive use of mechanical ventilation in pig houses, poultry barns, and cattle houses has helped increase the production rate by minimizing mortality rate caused by heat stress. In case of poultry industry, in the U.S., the production income was over $40 billion (USDA, 2014). According to the statistics by USDA, the demand for broiler meat is increasing substantially year by year. This has resulted in making large investments in technology to enhance the broiler production. Consequently, more number of poultry houses are being established and existing houses are pressurized to produce more leading to more broilers per house. However, this affects the environment for the broilers especially in summer seasons in hot and humid parts of the country. Numerous studies have been conducted to study the responses of the broilers to different kinds of environment and environmental variables (Lott et al., 1998; May et al., 2000; Simmons et al., 2003; Yahav et al., 2001). Huge investments have been made to establish sensor systems to study the microenvironment inside poultry houses (Bustamante et al., 2012).
However, it is extremely important and necessary to validate the models used with experimental data before considering it as a tool to make decisions. Blanes-Vidal et al., (2008) used a multi-sensor system to quantify the temperature, pressure and air velocity in broiler houses and used these experimental results to validate CFD models. Many other studies have been carried out to elucidate the use of CFD in modeling ventilation systems, air flow distribution, temperature variation, distribution of pollutants like NH3 (Pawar et al., 2010; Bjerg et al., 2013).
As explained in Chapter 1 and 2 there are some serious limitations of conducting field studies. The alternative commonly adopted to address problems with the microenvironment pertaining to poultry is by conducting studies on poultry in laboratories or research chambers. As discussed in chapter 2 dedicated research chambers have been used to study closely the physiological responses of the broilers to microenvironment in various scenarios. However, as stated in earlier chapters the results obtained using most of the existing research chambers may be less reliable due to inherent limitations of the existing research chambers and hence, the poultry engineering chamber at NCSU was designed and built to foster animal welfare and air quality research.
3.1.2 Rationale for using CFD