Cost Modelling
Using
Automobile Warranty Data
by
Raymond Summit
VICTORIA e
UNIVERSITY
z o o o
A thesis submitted at Victoria University of Technology in
fulfilment of the requirements for the degree of Doctor of Philosophy.
School of Computer Science and Mathematics
Victoria University
text
30001008593826 Summit, Raymond
Cost modelling using automobile warranty data
(c)2004
Copyright by Raymond Summit All rights reserved
Disclaimer
This thesis contians no material that has been accepted for the award of any other de-gree or diploma in any university or tertiary institution. To the best of my knowledge and belief, it contains no material previously published or written by another person, except where due reference is made in the text of the thesis.
I confirm that this thesis does not exceed 100,000 words (excluding the bibliography and appendices).
Raymond Summit August 2004
This thesis sets out to model, fi-om the manufacturer's point of view, the warranty cost of a repairable product. The product can be a complex one made up of numerous components, all of which are replaced upon failure and are non-repairable. The warranty-cost model is used to extrapolate the warranty-cost when the warranty is extended. Both point and interval estimates of the current and extended warranty costs are evaluated in this study.
The modelling in this diesis is based upon real data obtained fi-om an Australian car manufacturer. As such, the thesis starts out with a detailed discussion of the important issue of data checking and cleaning.
Survival methods are used to model the product as a repairable system, with each repair consisting of the replacement of one or more failed components. Thus, the re-pair is taken to be as good as new, and the rere-pair process can be modelled as a renewal process. Of interest is the expected number of replacements of each component during the warranty period, which can be estimated using renewal theory. To make the mod-elling manageable, the failure of each component is taken to be independent of the failure of other components.
The reliability of components with a small number of claims is assumed to follow the exponential distribution, whilst for components with more claims, the Weibull dis-tribution is used. Although other models are considered, the exponential proves to be adequate when tiie number of claims is small compared to the number of items produced. Because of its versatility, the Weibull distribution is an appropriate choice when modelling components with a larger number of claims. Log likelihood methods are used to estimate the parameters of the models, from which tiie number of renewals during the warranty period are estimated. Numerical methods are employed to do this for the Weibull model.
The expected warranty cost for each component is calculated from the expected number of replacements and the expected cost of repair. The cost of repair is taken to be a variable quantity in this study. Using the variance of the expected number of renewals and tiie variance of tiie cost of repak, tiie variance of the warranty cost is obtamed. The
Abstract v
estimated warranty costs and variances of all components are used to obtain an expected warranty cost per vehicle produced, and a confidence interval on that cost.
The variance of the Weibull model proves to be too big to be of practical use. How-ever, the exponential model's variance is quite usefiil. Simulation has been used to obtain a better confidence interval for the Weibull model. Simulations are also used to verify the results obtained by the modelling used in this thesis.
/ would like to gratefully acknowledge the assistance of my principal
supervi-sor. Associate Professor Peter Cerone, Head of the School of Computer Science and
Mathematics. Without his encouragement to apply for candidature and a
scholar-ship, this project would not have begun; without his guidance and patience it would
not have progressed to completion. I would also like to express my appreciation to
Associate Professor Ned Barnett, who, as Head of the School awarded me a School
scholarship in the later part of my studies. I also appreciate the facilities provided
at the School to enable me to conduct this project. Without these financial and other
assistance, I would not have been able to undertake this project.
I gratefully appreciate the assistance of my co-supervisor, Dr Neil Diamond,
whose assistance with statistical and S-Plus matters has been invaluable. Again,
without his assistance, this project would not have come to completion.
I would also like to thank the Warranty Manager of the car manufacturer that
has made the data available for this study. His generosity is much appreciated.
Obviously without that data, this project would not have been possible. He and his
company shall have to remain nameless so that the data is not misused against the
company.
I would also like to thank my wife, Isobel, for her assistance in proof-reading,
and also for providing moral and physical support throughout this project I would
like to dedicate this work to her and my children Katherine and Jessica, each of
whom have had to go with only a limited amount of my time and attention during
this project. I would also like to dedicate this work in loving memory of my parents,
Mary and Charles, who encouraged me when a child, to learn and inquire.
Contents
1 Thesis Introduction 1
1.1 Scope and Significance of This Study 1
1.2 Thesis Outline 4
2 Warranty Perspectives 7
2.1 Introduction 7
2.2 A History of Warranties 7
2.3 Definition of a Warranty 10
2.4 Classification of Warranties 11
2.5 Two-Dimensional Warranty Regions 12
2.6 Warranty and Management 15
2.6.1 Decision-Making 16
2.6.2 Marketing 17
2.6.3 Warranty Servicing PoHcies 18
2.6.4 Warranty Reserves 19
2.6.5 Legal Obligation 19 2.6.6 Data Collection and Management 20
2.7 Warranty and Engineering 20
2.7.1 Manufacturing Stages 20
2.7.2 Quality Control 21
2.7.3 Predictive Model and Warranty Data 22
2.7.4 Maintenance Scheduling 23
2.8 Conclusion 23
3 Warranty Modelling-A Review
25 3.1 Modelling the Warranty Process
25 3.1.1 Modelling Failure Mode
96
3.1.2 Modelling Time to First Failure
3.1.3 Modelling Customer Claim Behaviour ^
3.1.4 Modelling Rectification Action ^°
3.1.5 Modelling Subsequent Failures ^^
3.1.6 Modelling the Cost of Rectification 31
3.2 Modelling Two-Dimensional Warranties 32
3.2.1 One-Dimensional Approach 33
3.2.2 Two-Dimensional Approach 33
3.2.3 Comparison of the Two Approaches 34
3.2.4 Cost Models for Free Replacement Warranty 35
3.3 Modelling Product Reliability 36
3.3.1 Lifetime Distribution 36
3.3.2 Censoring Times 37
3.3.3 Reporting Lags 38
3.4 Survey of Approaches to Warranty Modelling 38
3.4.1 Warranty Claims Distribution 38
3.4.2 Bayesian Approach 40 3.4.3 Dynamic Lmear Modelling and Neural Networks 40
3.4.4 Markovian Approach 41
3.4.5 Renewal Process Approach 42
3.4.6 Simulation Approach 43
Contents ix
4 The Manufacturer's Data 45
4.1 Introduction 45
4.2 Importing The Data 46
4.3 Exploratory Data Analysis 48
4.4 Data Cleaning 53
4.4.1 Errors In The Repair Date 55
4.4.2 Errors In Sale Date 55
4.4.3 Repair Date Between Production And Sale 56
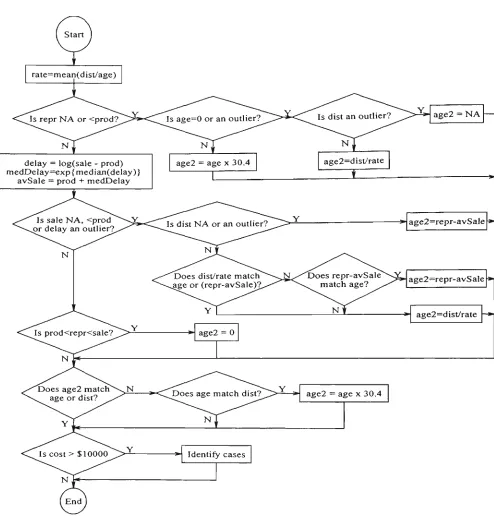
4.4.4 Check age2 Against age And dist 57
4.4.5 Cleaned Database 58 4.4.6 Missing Records From Sales Database 58
4.5 Component Ages in Subsequent Repairs 59
4.6 Database of Failed and Censored Times 59
4.7 Conclusion 60
5 Survival and Cost Models 62
5.1 Introduction 62
5.2 Assumptions 62
5.2.1 Validity of Claims 63
5.2.2 Timing of Failures 63
5.2.3 Repair Time 64
5.2.4 Nature of Repair 64
5.2.5 Independence of Component Failures 64
5.2.6 Uniformity of Parts 65
5.2.7 Location Factors 65
5.3 Survival Analysis Methods
fn
5.3.1 Censoring Times
5.3.2 Hazard Rate ^^ 70
5.4 Non-Parametric Estimation of Component Reliability
72 5.5 Parametric Models of Component Reliability
73 5.5.1 Log Likelihood Function
5.5.2 Exponential Model ^^
5.5.3 Weibull Model '^^
5.6 Modelling Failure Using a Renewal Process ' ^
5.6.1 Formulation ' ^
5.6.2 Solution for the Exponential Distribution 81
5.6.3 Numerical Solution for tiie Weibull Distribution 82
5.7 Modelling The Cost of Component Repair 84
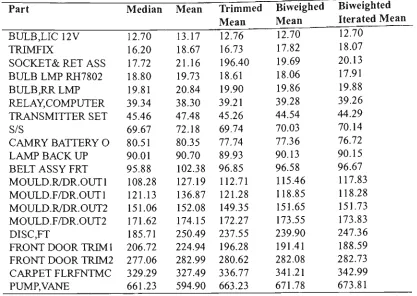
5.7.1 Choice of a Representative Cost Statistic 87
5.7.2 Variance of the Cost of Repair 89
5.8 Modelling The Cost of a Warranty 89
5.8.1 Point Estimate 89
5.8.2 Variance 90
5.8.3 Total Warranty Cost 90
5.8.4 Pomt and Interval Estimates Using the Bootstrap Method 91
5.9 Limitations of the Models 93
5.10 Conclusion 94
6 Implementation of the Survival Models 96
6.1 Introduction 96
Contents xi
6.3 Parametric Models of Reliability 99
6.4 Exponential Model 103
6.4.1 Expected Warranty Cost of Components 104
6.4.2 Implementation in S-Plus 105
6.4.3 Results 107
6.5 Weibull Model 109 6.5.1 The S-Plus Function survReg 109
6.5.2 Point Estimate: Implementation in S-Plus 114
6.5.3 Variance: Implementation in S-Plus 115
6.5.4 Results 118
6.6 Comparison of Exponential and Weibull Models 118
6.7 Model Estimates of Warranty Cost 120
6.7.1 Pomt Estimate 120
6.7.2 Variance 122
6.8 Costing an Extended Warranty 124
6.9 Sensitivity Analysis 126
6.9.1 Range of Parameter Values 127
6.9.2 Results 128 6.9.3 Interpretation of Results 128
6.10 Conclusion 132
7 Simulation Studies 134
7.1 Introduction 134
7.2 Bootstiap Estimate of Total Warranty Cost. 135
7.2.1 Purpose 135
7.2.3 Results ^^^
1 -J/T
7.3 Simulated Warranty Costs: 3 and 5 Year Warranties
7.3.1 Purpose ^^^
7.3.2 Metiiod ^^^
7.3.3 Results ^^^ 7.4 Simulated Warranty Costs: Age and Distance Limitations 140
7.4.1 Purpose 1"^^
7.4.2 Metiiod 140
7.4.3 Results 140
7.5 Reliability Estimation Using Same-Age Data 141
7.5.1 Purpose and Background 141
7.5.2 Metiiod 142
7.5.3 Results 143
7.5.4 Interpretation of Results 146
7.6 Reliability Estimation Using Varying-Age Data 148
7.6.1 Purpose and Background 148
7.6.2 Method 148
7.6.3 Results 151
7.7 Reliability Estimation Usmg Varymg-Age Data From 1 Year's Production.. 154
7.7.1 Purpose 154
7.7.2 Metiiod 154
7.7.3 Results 155
7.7.4 Interpretation of Results , 157
Contents xiii
8 Concluding Remarks and Future Directions 159
8.1 Introduction '. 159
8.2 Motivation For This Sttidy 159
8.3 Findings of This Stiidy 160
8.3.1 Comparison of Models 161
8.3.2 Findings of the Simulations 162 8.4 Extensions to This Research 163
8.5 Conclusion 164
References 165
A S-Plus Scripts and Outputs for Chapter 4 174
A.l Exploratory Data Plots and Summaries (PlotSummary.ssc) 174
A.2 Function to Check the Data (Check.ssc) 175
A.3 Output offCheck 177
A.4 Function to Clean the Data (Clean.ssc) 178
A.5 Function to Add Sales Records (AddSale.ssc) 180
A.6 Function to Calculate Components' Ages (compAge.ssc) 180 A.7 Function to Construct a Survival Database (Survive.ssc) 182
B S-Plus Scripts for Chapter 5 185
B.l Calculation of Usage Rates (Usage.ssc) 185
C S-Plus Scripts for Chapter 6 187
C. 1 Exponential Modelling (CostExp.ssc) 187
C.2 Exponential Fail Rate (FailRate.ssc) 189
C.3 Exponential Modelling with Grouping (CostExpGp.ssc) 191
C.5 Weibull Modelling (CostWbl.ssc) ^^^ 197
C.6 Confidence Region (ConfRgn.ssc)
C.7 Combined Exponential and Weibull Modelling Function (CostExpWblssc). 199
C.8 Estimate of Total Warranty Cost (WrntCstTot.ssc) ^^^
C.9 Extended Warranty Cost (ExtdWrnt.ssc) 205
CIO Sensitivitiy Analysis (Sensitivity.ssc) 2^°
D Component Reliability Graphs for Chapter 6 210
D.l Survival Plots of Components With Ill-fitting Weibull Models 210
D.2 Age Density Plots of Components Witii Ill-Fitting Weibull Models 214
D.3 Age Density Plots of Components With Good-Fitting Weibull Models 218
E S-Plus Scripts for Chapter 7 220
E.l Warranty Cost Simulation (WmtCstSimulssc) 220
E.2 Simulated Warranty Cost With Distance Limitation (WrntCstSmulDist.ssc) . 222
E.3 Sample Generating Function (SmpDisc.ssc) 224
E.4 Production Density (ProdDens.ssc) 226
E.5 Sales Delay Density (DelayDens.ssc) 226
E.6 Random Samples With Continuous Production (SmpCont.ssc) 227
Chapter 1
Thesis Introduction
1.1 Scope and Significance of This Study
Expensive, complex products are almost always sold with a warranty, so the cost of ser-vicing a warranty is significant. Wasserman (1992) suggested that warranty claims could amount to 10-30% of production costs. Menezes and Quelch (1990) claimed that war-ranties represent an increasing cost to the manufacturer. They reported that the automo-tive industry in the United States of America spent over US$5 bilUon on product warranty in 1988, up from just over $700 million in 1965. Majeske and Herrin (1998) stated that in 1992, the combined total warranty payment bill for Ford, General Motors and Chrysler was $9.2 bilHon.
The cost of servicing warranty claims is to be paid for by the manufacturer, who must cover this cost in the sale price of the product. The most important reason for determining the cost of a warranty is the need to price the warranty (Hill and Blischke, 1987). Analysis of warranty data provides many benefits: it enables an estimate of the warranty cost to be made; it can predict the new costs if the terms of the warranty are altered; and it provides feedback to engineers about the reliability of the product, which may be valuable in reviewing the design of a product or the manufacturing process.
The modelling of warranty costs is a complex stiidy because of the variety ot warranty terms, and because of the stochastic natiire of product or component failures. Singpurwalla and Wilson (1993) affirmed that "the warranty problem is multidiscipli-nary, involving topics as diverse as economics, game tiieory, law, marketing, operations research, psychology, probability, and statistics."
One of tiie most difficult warranties to analyse is the two dimensional warranty, which is limited by both calendar time and usage. Altiiough some literatiire has appeared since Singpurwalla and Wilson (1993) declared tiiat "not much has been done witii regard to dimensional warranties", there still appears to be a need for further work with two-dimensional warranty modelling. Although the data used in this tiiesis is two-two-dimensional, the approach used is a one-dimensional approach. This approach, as discussed in Sub-section 5.2.8, is suitable for the terms of the manufacture's warranty. This simplified approach has been used in this thesis because of the large number of components to be analysed.
As much has already been written about the modelling of warranty costs, one might consider the subject to be in no need of further attention. However, most papers have taken the form of a theoretical treatise, with few studies investigating the application of the models. Blischke (1990) stated:
Perhaps more pressing, however, is the need for practical applications-oriented
re-search. Before they find widespread use in practice, the elegant models that have
been developed must be incorporated into approaches that identify all significant
cost factors and the associated data requirements, that emphasize the use of
infor-mation that could realistically be attainable and that realistically model operational
warranty progress. Methodological papers along these lines have not appeared in
the statistical or management science literature (perhaps not because such studies
have not been done, but because the results are proprietary).
Thirteen years later, Jablonowski (2003) is still echoing these sentiments. He talks about the widenmg gap between theoretical developments and practice in risk management modelling, and what needs to be done to reduce the gap:
develop-1.1 Scope and Significance of This Study 3
ment in afield is not fruitful ... The key is moving formulas and equations from
paper to practice. ... Rewarding practical success, not just formal rigor, would
go a long way to help assure that proper attention is paid to the development of
"application friendly " theory. The corresponding threat is that without practical
justification, or at least its promise, the theory will not be taken seriously.
This thesis attempts to reduce the gap between theory and practice. It uses real data from an automobile manufacturer's warranty database. Practical issues that concern the handling of real data are discussed in this study, from the methodology involved in the checking and cleaning of the data, to the implementation of theoretical models. These practical issues are an important aspect of this thesis, and therefore much effort has been devoted to them in this study.
Murthy and Blischke (2000) acknowledged that "For most companies, warranty costs are a closely guarded secret, as evidenced by the fact that very little warranty data is available in the public domain." In the quote of the previous paragraph, Blischke (1990) pointed out the proprietary nature of warranty data. Some studies have analysed car-warranty data, for example, Kalbfleisch, Lawless and Robinson (1991), Lu and Vance (1997), Majeske and Herrin (1995 and 1998), and Lu (1998). However, because of space limitations, these papers have discussed the analysis of one or two parts only. There is a need for a more extensive study that includes the warranty cost covering all components of a complex product, such as the automobile. There is a need to explore the processes involved in a larger study, and there is a need for practically-based research. In addition, the literature appears not to contain any warranty data from an Australian manufacturer. This thesis models the warranty cost of an entire vehicle manufactured in Ausfralia, It also discusses in detail the practical issues that need to be resolved when analysing the real data.
The current literature on the use of simulations in warranty-cost modelling is com-plemented by the use of simulation to verify the models that are established in the tins study, and by the use of simulation to validate the techniques used in developing the mod-els. Some of the simulations produce new results that complement the current literature on warranty sunulation.
An integral part of tiiis tiiesis is the extensive use of S-Plus in developing the many fimctions needed to complete the analysis. Although the S-Plus library of functions is vast, new fiinctions have been developed to do the processing required in this study.
To summarise, this thesis extends the current warranty-cost models in the literature by presenting a practically-oriented, extensive study on warranty-cost modelUng that uses an Australian automobile manufacturer's entire database for one year's production. The database contains warranty data for the entire length of the warranty of all of these ve-hicles. The aim of this thesis is to use this database to model the manufacturer's cost of a warranty, and then to use the model to predict the cost when the warranty terms are extended. Confidence intervals, often not discussed in the literature, have also been es-timated m this dissertation. A further extension to the current literature is achieved by treating the cost of repair as a variable rather than as a constant, and by presenting simu-lations that verify the results of tiie modelling, and that validate the techniques used in the modelling.
1.2 Thesis Outline
This first chapter has identified tiie need for the current sttidy, and has established its significance in the literature.
The next chapter discusses some perspectives on warranties. The purpose of that chapter is to provide some background to tiie modelling of warranty costs.
Chapter 3 explores the way in which tiie warranty process can be modelled. In-cluded is a detailed discussion of the modelling of the two-dimensional warranty. The chapter also discusses tiie various approaches to warranty-cost modelling that has ap-peared in the literature.
ex-1.2 Thesis Outline 5
ploratory data analysis is conducted, how errors in the data are detected and cleaned, and how the survival database is constructed.
The theory behind the models used in this dissertation is then considered in Chap-ter 5. It discusses the assumptions made, the survival analysis methods used, the non-parametric and non-parametric methods used to estimate the reliabiHty of components, and the use of the renewal process in modelling component reliability. This is then put to-gether to obtain the warranty cost of each component and then the overall warranty cost to the manufacturer.
Chapter 6 discusses how these theoretical models are used in conjunction with the cleaned data from Chapter 4, to obtain a specific model for the data. Again practical issues of joining the data to the theory are discussed in this chapter. Exponential and Weibull models are used to fit specific data from the manufacturer's database. Model estimates of the cost of the current warranty and an extended warranty are made, together with confidence intervals for these costs.
Chapter 7 consists of a number of simulations. A bootsfrap simulation is presented to verify the results of the modelling in Chapter 6. Further simulations that generate data representing a whole year's production are presented: one for a three-year warranty, and one for a five-year warranty. A sensitivity analysis on the parameters of the model is performed, and then three more simulations are presented. These explore the fitting of a model to warranty data under various situations that mimic the collection of warranty data. The results of the simulations are used to validate the techniques used hi modelling the data.
The thesis concludes with a discussion of the findings and limitations of this study, and identifies areas that could possibly be further explored.
A number of appendices have been included for completeness and ready reference. Contained in the appendices are a number of S-Plus scripts that have been used in the analysis of the data. These have all been written by the author of this thesis, specifically for this project, A feature of these functions is that they have been designed to handle input parameters, so that they can easily be reused with other data sets. It is also possible to adapt the functions to databases from different manufacturers.
main body, but have been placed in tiie appendices because there are too many to include in the body of tiie tiiesis.
Chapter 2
Warranty Perspectives
2.1 Introduction
The previous chapter provided an outiine of this thesis and identified the need for this study. The practical nature of this dissertation was pointed out. This study uses an auto-mobile manufacturer's warranty database and discusses the detail of how this data is used to model the warranty cost of the manufacturer's warranty, and how this model is then used to estimate an extended warranty. Before starting the exploration and analysis of the data, a background to the study of warranty modelling is provided.
This chapter discusses a few different perspectives on warranty. The first perspec-tive is a historical one. In the first section, the colourful history of warranties that has lead to the accepted present-day warranties is presented. A definition of a warranty is then given. A classification that is based on the terms of the particular policies follows this. Two-dimensional warranty policies, that are based on two attributes, such as time and us-age, are then explored in their own right. Following this are two sections that explore the link that warranties have with management and engineering. Business decisions involving aspects such as planning, marketing, warranty servicing policies, warranty reserves, le-gal obligations, and warranty data management are discussed in the management section. The engineering section considers the effects on warranty cost of issues such as product design and development, quality confrol programs and product maintenance policies.
2.2 A History of Warranties
The beginning of this section is adapted from Loomba (1996).
if a known defect was hidden from tiie buyer, witii a time limitation ranging from one day to one month. Examples in which the buyer had no redress are also cited.
Warranties based on moral and religious virtues can be found in ancient worids, for example, in the Ancient Hmdu (circa A.D. 500), Early Islamic (circa A.D. 632-661) and Jewish (circa second centtiry A.D.) civilisations. They were also evident in Europe in the Middle Ages, where the powerfiil church denounced tiie selling of goods for profit. However, frade did exist and was accepted if it was not in the pursuit of profit, and the goods for trade were free of defects. Little, if any, comeback was available to the buyer of shoddy goods, hi tiie early fourth centtuy A.D., crafts became popular, but warranties were not needed as the merchants and products were locally known.
The general rule of caveat emptor ("let tiie buyer beware") applied during the in-dusttial revolution. This worked reasonably well because products were simple and the consumer could understand and evaluate tiiem before purchase (Blischke and Murthy, 1994). Vendors were locally known and word of mouth was often used to assess a prod-uct.
By the late nineteenth century in the U.S.A., standardised product warranties had emerged, but were very limited, due to the powerful position of the manufacturers. De-ceit, misbrandmg, adulteration and misrepresentation were widespread. Often warranties were offered without any intention of fiilfilling them and consumers perceived warranties to be an indication of poor quality. The growth of more complex products brought with it a greater need for consumer protection and the emergence of organisations that indepen-dently tested products. They were sponsored by insurance companies, underwriters and consumer-sponsored organisations. In 1914, the Federal Trade Commission in the U.S. established a set of codes for the selling of goods. Several versions of these codes were enacted by congress in the 1930s.
In tiie meantime, tiie U.S. courts began to make exceptions to the rule of caveat
emptor. Kelley (1996) described a prune case. In 1939, Baxter challenged the Ford
2.2 A History of Warranties 9
attach themselves to the product sold. The Washington Supreme Court disagreed with Ford.
By 1952, all states except Louisiana had adopted the Uniform Commercial Code. The code specified a manufacturer's obligations for both express and implied warranties. In express warranties, the emphasis was that the seller's promise to provide goods that fitted the promised description formed part of the deal. When an express warranty was not given, an implied warranty of merchantability applied to goods sold. The Commercial Code was primarily aimed at commercial fransactions and was suppletory, not regulatory. The rationale for this was that merchants were expected to have sufficient knowledge and bargaining power to protect themselves in commercial transactions.
Consumers, on the other hand, did not have this expertise and bargaining power. Hence, there was a need for regulatory laws. The Magnuson-Moss Warranty Act was en-acted in 1975 for this purpose. It followed ten years of studies, proposals and hearings aimed at overcoming warranty problems such as excessive use of disclaimers, inadequate coverage, consumer difficulty in obtaining warranty service and complex warranty lan-guage. The Act specified that a fiiU warranty was to provide for the free replacement of defective goods for an unlimited duration, and was to include compensation for inciden-tal damages. It also specified that a seller did not have to offer a full warranty, but could provide a limited warranty, where the terms and limitations were specified. Needless to say, many manufacturers changed their warranties to read "Limited Warranty" after the passing of this act. The act also specified that an impUed warranty of merchantability was inferred in the sale of all goods, and could not be reduced by a limited warranty. The im-plied warranty stipulated that goods were to be "fit for ordinary purposes for which such goods are used" (Kelley, 1996).
According to Beerworth (1991), the most important sources of product liability rules in Ausfralia are the tort of negligence (the common law) and Division 2A, Part V, Trade Practices Act 1974. The law of negligence imposes liability upon a person who does not use reasonable care in the manufacture and design of a product. Division 2A, on the other hand, imposes liability upon a manufacturer for a product which is unmerchantable or unfit for its stated purpose.
were becoming more aware of their rights as a result of consumer groups being more ac-tive and vocal. Secondly, governments were responding to tiie concerns of these groups and were legislating to protect tiieir rights. Thirdly, manufactiirers were reacting to pres-sures from both consumer groups and governments. Lastiy, manufacturers were realising tiie unportance of warranties as a marketing tool. (This is discussed fiulher in Section 2,6,)
By the late 1980s, consumers were becoming more quality sensitive, Manufactiirers responded to tiiis demand by producing high quality products and backing tiiem up with longer warranties. Menezes and Quelch (1990) identified three factors for this consumer focus on quality. These comprised tiie availability of quality products originating from Japanese companies; tiie fact that many consumers have high disposable incomes but littie time or inclination to deal with product failure; and increased product complexity, often leaving the consumer unable to judge quality before buying the product.
By the 1990s, manufacturers have focussed on customer satisfaction. Warranties were seen as a means of assuring this satisfaction. For example. General Electric in the U.S. had a "satisfaction guaranteed" program for all its major appliances that allowed customers to retum any appliance within ninety days, no questions asked (Menezes and Quelch 1990). Similarly, in Ausfralia, O.P.S.M. currently offers a spectacles warranty which includes free exchange with glasses of comparable value during the first four weeks if customers are dissatisfied for any reason.
2.3 Definition of a Warranty
prod-2.4 Classification of Warranties 11
uct is used in the specified manner. For the consumer, a warranty is an msurance policy against product defects.
2.4 Classification of Warranties
The following classification of warranty policies is an adaptation of the taxonomy pre-sented by Blischke and Murthy (1992 and 1994). The policies are not necessarily mutu-ally exclusive.
1. Free Replacement Warranty: With this warranty, the manufacturer either replaces, repairs or reimburses the customer for a failed product for a period of time tyj commencing from the time of the initial purchase. This policy is the most common warranty on consumer goods, ranging from nomepairable inexpensive products, such as film, to expensive repairable items, such as automobiles and refiigerators.
2. Pro-rata Warranty: In this warranty, a manufacturer agrees to refiind an amount in proportion to the remaining time left on the warranty bounded by time t^j from the time of the initial purchase. This policy is appropriate for products such as automotive batteries and tyres, that wear out and must be replaced when they fail.
3. Combined Free Replacement and Pro-rata Warranty: Up to time t^i, this policy is a free-replacement one. Between tyji and tw2 (where t^\ < 1^2) the warranty converts to a pro-rata policy.
4. Renewing Warranty: Upon failure of a product during the warranty period, a replacement is made, and the warranty starts anew. This policy is offered with inexpensive electrical, elecfronic or mechanical products where the warranty is contamed inside the product's packaging. By returning the new warranty regisfration card, the warranty starts anew.
tiie fleet warranty has advantages to tiie manufactiirer over the combination policy because the effect of infant mortality is averaged out with longer wearing parts.
). Reliability Improvement Warranty: This policy has evolved from airiine companies purchasing commercial aircraft and is now mandatory for any U.S. Department of Defense purchase of military equipment (Nenoff, 1988). Under this policy, the manufactiirer undertakes to repair or replace tiie product or its components within a specified ttimaround tune, and make design and engineering changes necessary to meet the required reliability, as measured by the mean time between failure. This type of warranty has also been referred to as the essential performance requirements warranty (Gilbertson, 1989).
The above policies can be restricted on one variable, such as calendar time or usage (measured, for example, by distance fravelled or flying hours), or on two variables, such as tune and usage. The two-dimensional warranty is usually offered in the automobile and aviation industries.
In any of these policies, replacement or repafr upon failure is at the manufacturer or repairer's discretion, but may be written into the warranty policy. Replacement is appropriate for non-durable and inexpensive consumer goods, or where the cost of repair would be greater than the cost of replacement. Repair is more appropriate for expensive, durable goods.
When a manufacturer wants to limit the warranty by usage, but does not want to impose a two-dimensional warranty, he may offer different policies to different segments of consumers. For example, home users may be offered a two-year warranty on a washing machine, whilst an industrial or commercial user may be offered six months.
In the next section, two-dimensional warranty regions are categorised.
2.5 Two-Dimensional Warranty Regions
2.5 Two-Dimensional Warranty Regions 13
The two-dimensional warranty has been referred to under different names by vari-ous authors. Moskowitz and Chun (1994) and Chun and Tang (1999) called it the "two-attribute warranty". Farewell and Cox (1979) referred to multiple time scales, while Law-less (1995) and (1998) described it in terms of covariates. The term "two-dimensional warranty" is used in this dissertation.
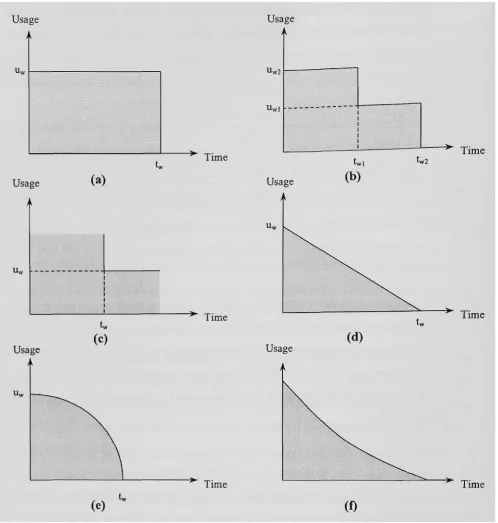
Two-dimensional warranties can be subdivided according to the two-dimensional regions representing their policies. The following two-dimensional warranty policies are an adaptation of those presented in Blischke and Murthy (1992) and (1994), Murthy, Iskandar and Wilson (1995), Singpurwalla and Wilson (1993), and Chun and Tang (1999).
1. Rectangular Region-Vi^ytre 2.1(a): Coverage is for a maximum time tw and usage
Uyj, whichever comes first. Cars and aeroplanes typically come with this type of
warranty.
2. L-shaped i?egion-Figure 2.1(b): This policy is a compromise between Policy 1 and Policy 2 above. Under this policy, the product is covered for a minimum time period
tyji and for a minimum usage u^x. The manufacturer's obligation is limited by a time
t^2 and usage Ui„2- Because of the time and usage restrictions, neither heavy users
nor light users subsidise the other. Again, no product is known to be covered by this policy.
3. Infinite L-shaped Region-^i^(\xe 2.1(c): Coverage is for a minimum time t^ and minimum usage Wu,, whichever occurs later. No product is known to be offered with this warranty. As failure of most products depends upon both usage and age to some extent, a manufacturer would be reluctant to offer this open-ended warranty.
Usage
>
" w
k
Usage
/
Uw
Usa
Uw
k
ge
(a]
t
(c
(e)
"* l i m e tw
1
*' Time
)
Time
tw
Usage
;
Uwl k
Usage
,
Uw
Usa >
k
ge
«K.
twl
(b)
(d)
(f)
tw2
tw * Time
* Time
Fig. 2.1. Two-dimensional warranty policies.
5. Circular Region-Ti^re 2.1(e): This is another variation of tiie triangular region in an attempt to make the warranty poUcy fairer for the average user.
2.6 Warranty and Management 15
determined so that any point on the curve has the same expected warranty cost to the producer. Moskowitz and Chun (1996) and Gertsbakh and Kordonsky (1998) highlighted the appeal of this policy, as the flexibility may be attractive to a variety of customers.
Other variations of the two-dimensional region have been reported in the literature, but the above are probably the most practical. One variation is the unlimited distance warranty that is offered with the sale of some vehicles. This warranty is dependent on time only, and so is, of course, a one-dimensional warranty.
The rectangular region of Figure 2.1(a) is the one in most common usage in the automobile and aviation industry. It is simple to implement, and leads to littie, if any, discrepancy.
For most other products, a one-dimensional warranty is offered, and consumers usually have a limited range of usage. Heavier users, such as commercial users, are generally offered a shorter time under warranty. Interestingly, in more recent years, this policy has been offered with imported cars in Ausfralia. It favours the heavy user.
Many of the other policies of Figure 2.1 are attractive since they are fairer to all users. However, there do not appear to be any products offered with these other policies because they are more difficult to implement, more costiy to administer, and more likely to lead to disputes and ill-feeling amongst customers.
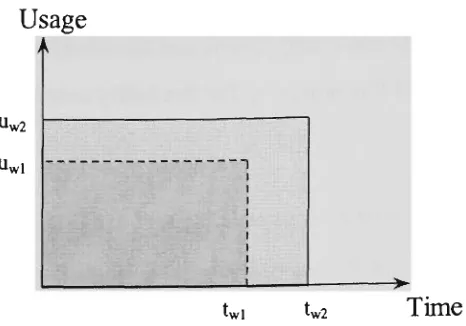
A pro-rata variation on these two-dimensional policies is also possible. For exam-ple, with the Rectangular policy, the first part of this policy is identical to Policy 1, where the product is covered for a maximum time of tj^i or usage Uy,\. The pro-rata period ex-tends this to a maximum time t^2 or usage w^2 on a pro-rata basis. This is illustrated in Figure 2,2. Again, there do not seem to be any products covered with this warranty policy.
This study focuses on the two-dimensional, free-replacement warranty.
2.6 Warranty and Management
Usage
Uw2
Uwl i
. >.
Iwl tw2 Time
Fig. 2.2. Two-dimensional pro-rata policy.
when multiple business objectives are involved? What is the optimal sfrategy for servicing a warranty? What kinds of data are needed and how should the data be analysed? What are the optimal decisions with regard to product design and manufacture, given that the product must be sold with a specific type of warranty policy?
A number of publications have endeavoured to integrate the many aspects of war-ranty analysis. Most notable of these are Blischke and Murthy (1992) and (1994), Murthy and Blischke (1992a) and (1992b), and reviews by Hill and Blischke (1987), Blischke (1990) and more recentiy, Murthy and Djanaludin (2002).
The discussion in this section reviews some of the literature that explore various issues of warranty analysis.
2.6.1 Decision-Making
2.6 Warranty and Management 17
The life cycle approach has been used by some authors. For example, Murthy and Blischke (2000) discussed engmeering (technical) issues and management (commercial) issues that affect a product throughout its life. A product's life-cycle can be divided into three broad phases. The prelaunch stage, which includes product design, development of a marketing plan and the specification of a warranty. The launch phase focuses on the target launch date. The postlaunch phase includes servicing the product, feedback and design revisions, and fulfilling the warranty obligations. By integrating warranty policy with other aspects of decision-making, the cost of a warranty can be well planned for.
Another example of a study using the product life cycle approach was the one by Polatoglu and Sahin (1998). It investigated the probability distributions of the manufac-turer's rebate, cost, revenue and profit during a cycle under a renewing, combination free replacement/pro-rata warranty policy.
A manufacturer needs to estimate the warranty cost of a product so that it can be built into the purchase price. Blischke and Scheuer (1975) modelled the long-term profit to the producer when a product is sold with and without a warranty. Both the free-replacement and pro-rata warranties were discussed. In the same stiidy, the long-term cost to a buyer was also modelled.
2.6.2 Marketing
A favourable warranty can reduce consumer-perceived risk and can be used as a market-ing tool. For example, Chrysler in the United States extended its power frain warranty from two years/24,000 miles to seven years/70,000 miles, and Chrysler aggressively ad-vertised this fact. Industry analysts calculated that this resulted in Chrysler gaining at least one market share percentage point (Menezes and Quelch, 1990). Another example was Hyundai's extension in 1990, of its one-year warranty to tliree-years/60,000 kilome-fres. This attempt to gain a greater Ausfralian-market share on its relatively new Excel resulted in a sales increase of 40% in the following year (Hyundai, 2004.)
cenhiry, Australian manufactiirers were offering 3 years/100,000 kilometres as a standard warranty because of pressure from importers.
In a highly competitive marketplace, manufactiirers see customer satisfaction as important. Murthy and Blischke (2000) pointed out tiiat product support, through the servicing of a warranty, is important in fostering customer good-will, and can lead to subsequent sales. According to Stahl and Grigsby (1997, page 165), Ford estimates that it costs five times as much to attract a new customer as it does to retain an old one.
Menezes and Quelch (1990) argued tiiat from a manufacttirer's perspective, cus-tomers that experience a problem with their product should be encouraged to invoke the warranty for two reasons. One is that consumers with problems often do not complain, they just switch brands. A second reason is that a dissatisfied customer has the poten-tial to do harm by spreading strong negative word-of-mouth comments about the product. A customer that feels satisfied with problem resolution is more likely to be loyal to that brand and spread positive word-of-mouth communication.
Elsayed (1996, page 475) summed it up as foUows:
The increasing worldwide competition is prompting manufacturers to introduce
in-novative approaches in order to increase their market shares. In addition to
improv-ing quality and reducimprov-ing prices, they also provide attractive warranties for their
products. In other words, warranties are becoming an important factor in the
con-sumer 's decision-making process. For example, when several products that perform
the same function are available in the market and their prices are essentially equal
the customer's deciding factor of preference for one product over the other includes
the manufacturer's reputation and the type and length of the warranty provided with
the product. Because of the impact of the warranty on future sales, manufacturers
who traditionally did not provide warranties for some products and services are
now providing or required to provide some type of warranty.
2.6.3 Warranty Servicing Policies
2.6 Warranty and Management 19
the product and the length of warranty remaining. The second is a constant repair-cost limit throughout the warranty period. Dagpunar concluded that there was little cost bene-fit in the adaptive policy, especially when the additional adminisfrative costs of the policy are taken into consideration.
In the case of automobile warranty claims, repair is almost certainly the only option, as replacement of the entire vehicle would be unnecessary and far too expensive. Thus, the above sfrategies are not used in this thesis.
2.6.4 Warranty Reserves
A number of studies have modelled the size of the warranty reserve needed to honour a warranty. For example, Menke (1969) considered a nonrepairable product sold with a pro-rata warranty that had an exponential failure distribution. Amato and Anderson (1976) factored into the model the present-day value of warranty claims and changes in the price level. Thomas (1989) extended the warranty reserve models by considering the uniform, gamma and Weibull failure distributions. EHashberg, Suigpurwalla and Wilson (1997) made fttrther extensions by modelling warranty reserves for two-dimensional warranties. Jun and Pham (2004) modelled the warranty reserve for the free-replacement and pro-rata warranty policies when the value of money in discounted over time and the repair in minimal on a series system.
In the current study, the warranty cost per vehicle is estimated, from which a war-ranty reserve can then be calculated.
2.6.5 Legal Obligation
Legal liability is a cost that the manufacturer may have to meet. Morgan (1982) stated that the cost of liability from product warranties has been increasing over the years.
research; and breach of warranty, when a manufactiirer does not honour the terms of tiie warranty.
2.6.6 Data Collection and Management
The importance of data collection and management was pointed out by Lawless (1998, page 41):
Ifconstinicted and maintained properly warranty data bases may be used to
pre-dict future claims, to compare claims experience for different groups of products,
and to study variations in claims relative to factors such as time and place of
man-ufacture, or usage environment. In some circumstances warranty data may also be
used to estimate the field reliability of products and to identify opportunities for the
improvement of quality and reliability.
2.7 Warranty and Engineering
A manufacturer's warranty cost depends upon the reliability of the product. The reliabil-ity of a product, in turn, depends largely upon its design characteristics and the abilreliabil-ity of the manufacturing process to produce an item according to the specified design. Greater reliability is achieved by improvements in the design and development of a product, and improvements in quality control during the manufacturing process. These improvements, however, come at a cost, and an engineering decision has to be made as to where the balance between these competing expenses should lie. Studies that explore the connec-tion between warranty cost and engmeering design and manufacture are discussed in this section.
2.7.1 Manufacturing Stages
2.7 Warranty and Engineering 21
were dependent on the parameters of the reliability of the product. These parameters were considered to be a variable that can be adjusted by the engineer, and which can take on values within a given range.
2.7.2 Quality Control
The study of warranty data provides an opportunity to monitor the reliability of a product. As Suzuki (1985) put it, a warranty "serves not only the owners, but also the manufac-turers who wish to monitor the reliability of their products". Put in another way, "the ultimate test of a manufactured product is how well it performs in the field, that is, in the hands of the customers" (Lawless and Kalbfleisch, 1992). An example of a company that uses warranty data to monitor its manufacturing is given by Firestone, who use their monthly warranty analysis as an early warning system (Menezes and Quelch 1990).
Quality control is part of the manufacturing process and is achieved through in-spection and pre-sale testing. Reducing batch sizes and increasing inin-spection increases the reliability of the end product, thus reducing warranty costs, but this is paid for in in-creased production costs. Many authors have discussed the issue of optimal batch size that minimises both production and warranty cost. For example, Chen, Yao and Zheng (1998) developed an end-of-production inspection procedure for batch-produced items. Their aim was to identify a checking policy that minimised warranty and inspection cost. The approach was to choose a sample from a batch of items. The batch was considered satisfactory if a threshold of defective items for a given sample size was not reached, and inspection was stopped. If the threshold was passed, fiirther inspection was conducted, either until the threshold for the increasing sample size was met or the entfre batch was inspected. In this way, a balance between inspection and repair cost and warranty cost was achieved. Wang and Sheu (2003) also discuss the frade-offs between manufacturing cost and warranty cost. They developed a cost model to find the optimal production lot size to minimise the total production and warranty cost.
optmiised by using a sequential search over tiie extreme points of the feasibility region. The methods used in tiiis sttidy apply to decreasing hazard systems only, which limits the shape parameter of the Weibull model to less than one.
Warranty data can be used to monitor tiie rehability of components in a system. Lu's (1998) sttidy was concemed with usmg early vehicle warranty data (4 or 5 months in service) to predict potential reliability problems. Such problems could have resulted in a product recall or other corrective action. Using data from Chrysler on a range of 23,365 cars of various models and 8,752 tiiicks, produced between 1983 and 1986, Lu modelled mileage accumulation rates on the lognormal disfribution. The Weibull distiibution was used to model the time to failure of vehicles. The reliability for each 1,000-mile inter-vals was calculated, and tiie data exfrapolated to predict fiittire claims. Early detection of reliability problems was also the subject of Wu and Meeker's (2002) study. They de-veloped a procedure to detect potential problems from early warranty data, using botii statistical decision rules and graphical methods. These techniques discussed in both of these stiidies would be very useful "quality control" information tiiat could be used in the manufacturing process.
2.7.3 Predictive Model and Warranty Data
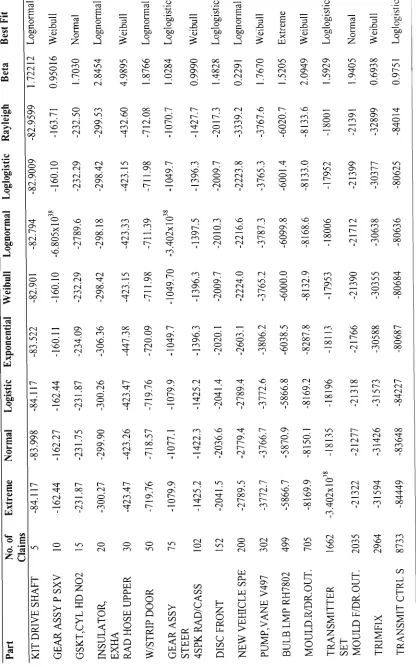
Majeske and Herrin (1998) compared the warranty cost predicted by a manufacturer's model against field data. They used two sets of warranty data to make their comparisons. The first set involved the redesigning of the radio to allow for new features, such as a compact disc player. The manufacturer used an exponential model and found that the warranty data showed a failure rate of twice that predicted by the manufacturer's model. Majeske and Herrin concluded that the Weibull model provided a better fit to the data than did the exponential model.
2.8 Conclusion 23
less severe failures, such as uneven wear in the brake pads and rotors. They concluded that manufacturers need to verify the predictive models obtained from bench testing against warranty data, and that the failure mode needs to be considered.
2.7.4 Maintenance Scheduling
The scheduling of preventive maintenance to minimise warranty costs has received atten-tion by some authors. Chun (1992) included a scheduled preventive maintenance cost and a repafr cost at failure for a product. His objective was to determine the optunal number of preventive maintenance operations during the warranty period in order to minimise the manufacturer's overall cost. He considered the case where preventive maintenance was imperfect, and repair at failure was minimal.
In a similar but more in-depth study, Lin, Zuo, Yam and Meng (2000) developed a cost model that incorporated warranty, periodic preventive maintenance and repair upon failure of a system. The study's aim, however, was to find the optimal design of a mixed series-parallel system. The overall cost, includuig manufacturing and set-up expenses, maintenance expenses and warranty costs was optimised.
In yet another study, Chen and Popova (2002) developed a maintenance pohcy to minimise servicing cost for an item with a two-dimensional warranty. An iterative pro-cedure is used to estimate the item's failure rate distribution from warranty data, The authors used an algorithm based on Monte Carlo simulation to obtain the optimal main-tenance policy.
In all three studies, the preventive maintenance cost was borne by the manufacturer. This may be the case with large military or civil projects, or with the reliability improve-ment warranty policy, but is generally not the case with consumer goods. Although there have been examples of car importers in Ausfralia taking up the scheduled maintenance costs, it is generally not the practice, with the maintenance usually being paid for by the consumer. In this thesis, it is assumed that maintenance cost will be met by the consumer.
2.8 Conclusion
discusses a range of warranty issues has been presented. In this chapter, the scope and significance of this study have been discussed. Various warranty policies have been clas-sified according to the terms of the rebate. Two-dimensional warranties, which are of interest in this study, have also been classified. The links between warranty and manage-ment, and warranty and engineering have been explored.
Chapter 3
Warranty Modelling-A Review
The last chapter presented a broad overview of warranties. The purpose of this chapter is to enlighten on the breadth of approaches to warranty modelling that exist m the literature. The chapter starts with a consideration of the processes involved in modelling the warranty cost, from when a fault occurs, through to the cost of rectifying the problem. This is followed by a discussion of the modelling of two-dimensional warranties. The chapter ends with an expose of a number of approaches used for product reliability and warranty costing.
3.1 Modelling the Warranty Process
The warranty process consists of item failure as perceived by the customer, the customer's response to that failure, and the manufacturer's or repairer's response to a customer's claim, if one is made. The following comprises a discussion of the modelling involved at each of these stages.
3.1.1 ModeUing Failure Mode
Murthy and Blischke (1992b) identified two ways of modelling the time to failure: phys-ically based or black-box based. The former approach is based on the physical nature of the failure, where items are considered to receive shocks of random magnitude at random time intervals. In the Shock Damage model, item failure occurs at the first instant that a shock exceeds a critical value. In the Cumulative Damage model, item failure occurs when the cumulative damage exceeds some critical value. In both cases, the time to fail-ure is a random variable, and obtaining its distribution fiinction involves the analysis of the stochastic process characterising the shocks.
In the black-box approach, the physics of the failure is not considered at all. The time to failure, X, is taken to be a random variable with a distribution function, F{x), based on the modeller's physical judgement and on historical data.
Many complex products have a modular design. Each module is made up of a number of components, the failure of any of which results in module failure. Thus, to
model failure, component failure needs to be related to module failure, and module failure needs to be related to item failure. Thus, the modelling of failures in a complex system can become very difficult. One smiplification is to assume that the failure of a module does not affect the failure of other modules.
3.1.2 Modelling Time to First Failure
Item failures occur randomly over tiie time continuum. Thus item failures, in tiie case of one-dimensional warranties, can be freated as random points along a time axis. The two-dimensional case is discussed in Section 3.2.
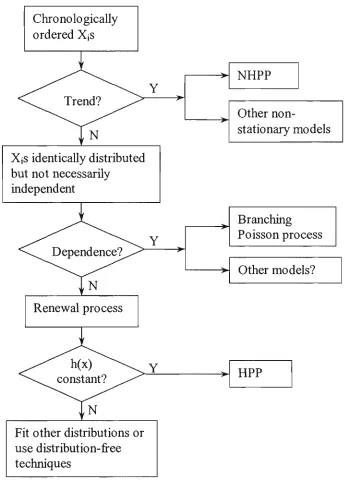
Ascher (1992) pointed out tiiat it is important to differentiate between the modelling of repairable and nomepairable systems. It is appropriate to model the time to failure of a nomepairable item or part with a suitable probability distribution function. Ascher suggested the approach outlined in Figure 3.1 (which is adapted from Figure 3 of Ascher) for analysing the inter-arrival times of a repafrable system. For a repairable system, a distinction needs to be made between the first failure and subsequent failures of an item because any subsequent failure depends on the repair or replacement policy, as discussed in Subsection 3.1.5. In fact, early models of warranty costs, such as those of Menke (1969) and Amato and Anderson (1976), ignored the repair process altogether and were based on tiie time to first failure only (Hill and Blischke, 1987 and Blischke, 1990). Considering first failure only, the expected warranty cost of an item with a warranty length of time length tu; is given by
C(t^) = CsF{t^),
where c^ is the cost to supply tiie item and F(-) is the probability distribution for the failure of the item.
The failure of components withm a system is being modelled in this sttidy. As such, tiieir failure is bemg modelled by a suitable distribution fiinction.
3.1.3 ModeUing Customer Claim Behaviour
3.1 Modelling the Warranty Process 27
Chronologically ordered XiS
Y
> >
NHPP
Other
non-stationary models
XiS identically distributed but not necessarily
independent
Y
> > •
Branclung Poisson process
Other models?
Renewal process
Fit other distributions or use distribution-free techniques
HPP
Fig. 3.1. Statistical anlaysis of successive inter-arrival times of a repairable system.
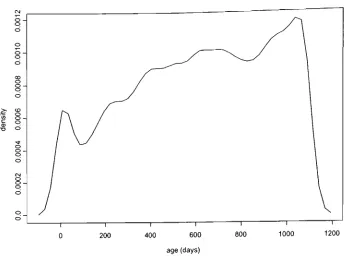
Fig. 3.2. Claims density.
On the other hand, a buyer may attempt to make a false claim, as may be the case if the item was misused. The manufacturer or repairer incurs a cost in processing the claim, and a further cost if the repafr is carried out. If the manufacturer refuses to carry out the repair, fiirther costs may be incurred in the form of litigation or the tarnishing of a reputation. The manufacturer then has to decide whether or not to honour the claim. As these issues are difficult to quantify, their inclusion adds complexities to the model. These complexities are not considered in the current study, and all claims in the warranty database have been assumed to be bona fide.
3.1.4 ModeUing Rectifi cation Action
3.1 Modelling the Warranty Process 29
1. Replacement: In the case of inexpensive items, or components of more complex ones, replacement is the usual option. The failure distribution of the new item or component would be the same as the original item, provided no design or production changes have taken place since the first item was produced.
2. As-good-as-new repair: Under this type of repair, a complex product is brought back to its original condition. The product's failure distribution after repair would be the same as that of a new item.
3. Minimal repair: Under this type of repair, the product is brought back to its condition just before failure. Its failure rate would be the same as it was just before repair.
4. Between as-good-as-new and minimal repair: The repair here may be a major overhaul, leaving the item with a lower failure rate than before the repair, but not as low as the failure rate of a new item. This may be modelled by a different failure distribution or distributions, which may depend on the number of repairs.
5. Imperfect repair: Under this type of repair, an item is left in a worse condition than before the repair. This could be due to a number of reasons, such as the installation of a faulty part, human error or the damage of another part during the repair process.
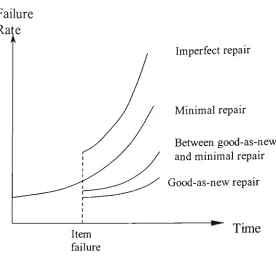
The effect that these repair-types have on the failure rate are represented in Figure 3.3, which has been adapted from Figure 2, Blischke and Murthy (1992b, p.5).
The analysis in this tiiesis is on a component level, with each repair consisting of a replacement of a component. Therefore, the new component has the same failure distribution as the original one, assuming that no design or manufacturing changes have taken place, and the rest of the components are taken to be unaffected. That is, the repair of the vehicle is taken to be minimal for all components other than the replaced one. Section 5.2 contains a more comprehensive discussion of the assumptions made in the modelling used in this study.
Failure Rate
Item failure
Imperfect repair
Minimal repair
Between good-as-new and minimal repair Good-as-new repair
Time
Fig. 3.3. Failure rates after various repairs.
of the use of the item, which may then lead to additional costs and loss of revenue. Repair time can be modelled as a random variable, having its own distribution. If the repair time is small compared to time between repairs, it can be taken to be zero. That is the case in this thesis.
3.1.5 ModeUing Subsequent Failures
The modelling of time to failures after the first failure depends upon the rectification action after a failure, as discussed in the last section.
When a system is repaired as-good-as-new, tiie failure distribution of the repaired item is identical to tiiat of tiie item when it was new. Similariy, a replacement part has the same distribution as the original if there have been no design or manufactiiring changes. Botii of tiiese sittiations can be modelled by a renewal process, where the time between renewals has a disfribution which is the same as the failure distiibution of the first failure. A detailed formulation of the renewal process is shown m Section 5.6.
3.1 Modelling the Warranty Process 31
When an item is subjected to repairs other than as-good-as-new or minimal repair, the failure rate is not the same as that of a new item, or the item just before failure. Some works on imperfect repair appear in the literature, but these are from the inspection monitoring and maintenance viewpoint (for example, Pham and Wang, 1996).
3.1.6 Modelling the Cost of Rectification
When a warranty claim is made, the manufacturer incurs a variety of costs. These costs comprise an administrative cost (even if it is not a valid claim), the cost to repair or replace the item, a retailer's handling cost, a spare parts inventory cost and possibly a transporta-tion cost to collect and retum the item. These costs can be aggregated into one service cost. This service cost depends on the product characteristics and the usage pattems of consumers. Thus, it is a random variable which can be modelled by a suitable distribu-tion funcdistribu-tion. If the variability in service cost is small, it can be treated approximately as a deterministic quantify. This seems to be the case in studies to date. The current study freats the cost of repair as a variable.
Let us first look at a model of the manufacturer's cost of servicing a free replacement warranfy when a failed item is replaced. Suppose that c^ is the average manufacturer's cost of supplying an item. This cost includes all costs of doing busmess, including manu-facturing, distributuig and advertising, but excludes warranfy costs. Let C(tT„) be the total cost of supplying the item with a warranfy of length t^. Then the total expected cost of an item under warranfy is
E[C{t^)]=Cs[l + M{t^)], (3.1)
where M(-) is the ordinary renewal fiinction associated with the distribution fiinction
F{-) (see Subsection 3.4.5), and E{-) denotes the expected value. Renewal fimctions are
difficult to evaluate in all but a few simple distributions, and this poses a problem for solving (3.1). However, extensive tables for various distributions are given in Baxter, Scheuer, Blischke and McConalogue (1981), and numerical methods are available, such as those provided by Xie (1989).
supplying an item with a warranty of length t^, as
For minimal repafr, between as-good-as-new and minimal repair, and imperfect repair, the
M{t^) term in (3.2) needs to be replaced by tiie appropriate expected number of repairs
with nonidentical failure disfributions. Equations (3.1) and (3.2) can be found in a number of papers, such as BUschke and Scheuer (1975) and (1981).
For tiie data used in this tiiesis, repafrs consist of replacmg a failed component with a new one. As the analysis is conducted on a component level, tiie repair is taken to be as-good-as-new as far as tiie replaced component is concemed. The remaining components are taken to be unaffected by this replacement.
Cost models for the pro-rata, the combination, and the reliabilify improvement war-ranties, are given in Murthy and Blischke (1992b).
3.2 Modelling Two-Dimensional Warranties
The discussion in Section 3.1 applies to both one and two-dimensional warranties. Two-dimensional warranties, however, have the additional consfraint of being limited by two variables instead of just one. For example, two-dimensional warranties exist for aero-planes and automobiles. These warranties are limited by calendar time, taken from the purchase date, and usage, which may be measured as distance or flying hours.
There are two approaches to analysing a two-dimensional warranty. In the one-dimensional approach, analysis is performed on one dimension, with the second dimen-sion being related back to the first dimendimen-sion. This approach sunplifies the problem to a one-dimensional problem. In the two-dimensional approach, analysis is performed using a two-dunensional distribution. This approach is mathematically more difficult.
3.2 Modelling Two-Dimensional Warranties 33
3.2.1 One-Dimensional Approach
In the first approach, item failure is modelled by an intensify function which is a function of both the age and usage of the item. The usage, in turn, is modelled as a function of age, so that the intensify fiinction is expressed as a function of age only. This reduces the two-dimensional problem to a one-dimensional point process formulation.
Murthy and BUschke (1992b) and Murthy, Iskandar and Wilson (1995) formulated the one-dimensional approach as follows. Let the sale of the item occur att = 0. Let
Xc{t) and Uc{t) be the age and usage, respectively, of the item currentiy m use at time t.
Let U{t) be the total usage that a buyer has had from the purchased item, including any replacements, over the time interval [0, t). If no replacements have occurred in [0, t), then
Xc{t) = t and Uc{t) = U{t). This is also tme if the item is repaired minunally, and the
repair time is negligible compared to time between repairs, and thus can be assumed to be zero.
If the relationship between age, Xc{t), and usage, Uc{t), can be assumed to be lmear, then
Uc{t) = RX,{t),
where R represents the usage rate which may vary from one user to the next, R can be modelled as a non-negative random variable with a distribution G{r). Kim, Djamaludin and Murthy (2001) considered two different densities ofG{r): the uniform distribution and the gamma distribution. They also considered the discrete case where the usage rates can be categorised into groups. Thus, conditional on R = r, failures occur according to a Poisson process with intensify A(t|r). This can be modelled in the form
X{t\r)^ij{Xe{t),UM
where ip{x,y) is an increasing fimction of both x and y.